. 2023 May 4;30(5):677-688.e5.
doi: 10.1016/j.stem.2023.03.007. Epub 2023 Apr 4.

Generation of ventralized human thalamic organoids with thalamic reticular nucleus

Affiliations

Generation of ventralized human thalamic organoids with thalamic reticular nucleus

Ferdi Ridvan Kiral et al. Cell Stem Cell. .

Abstract

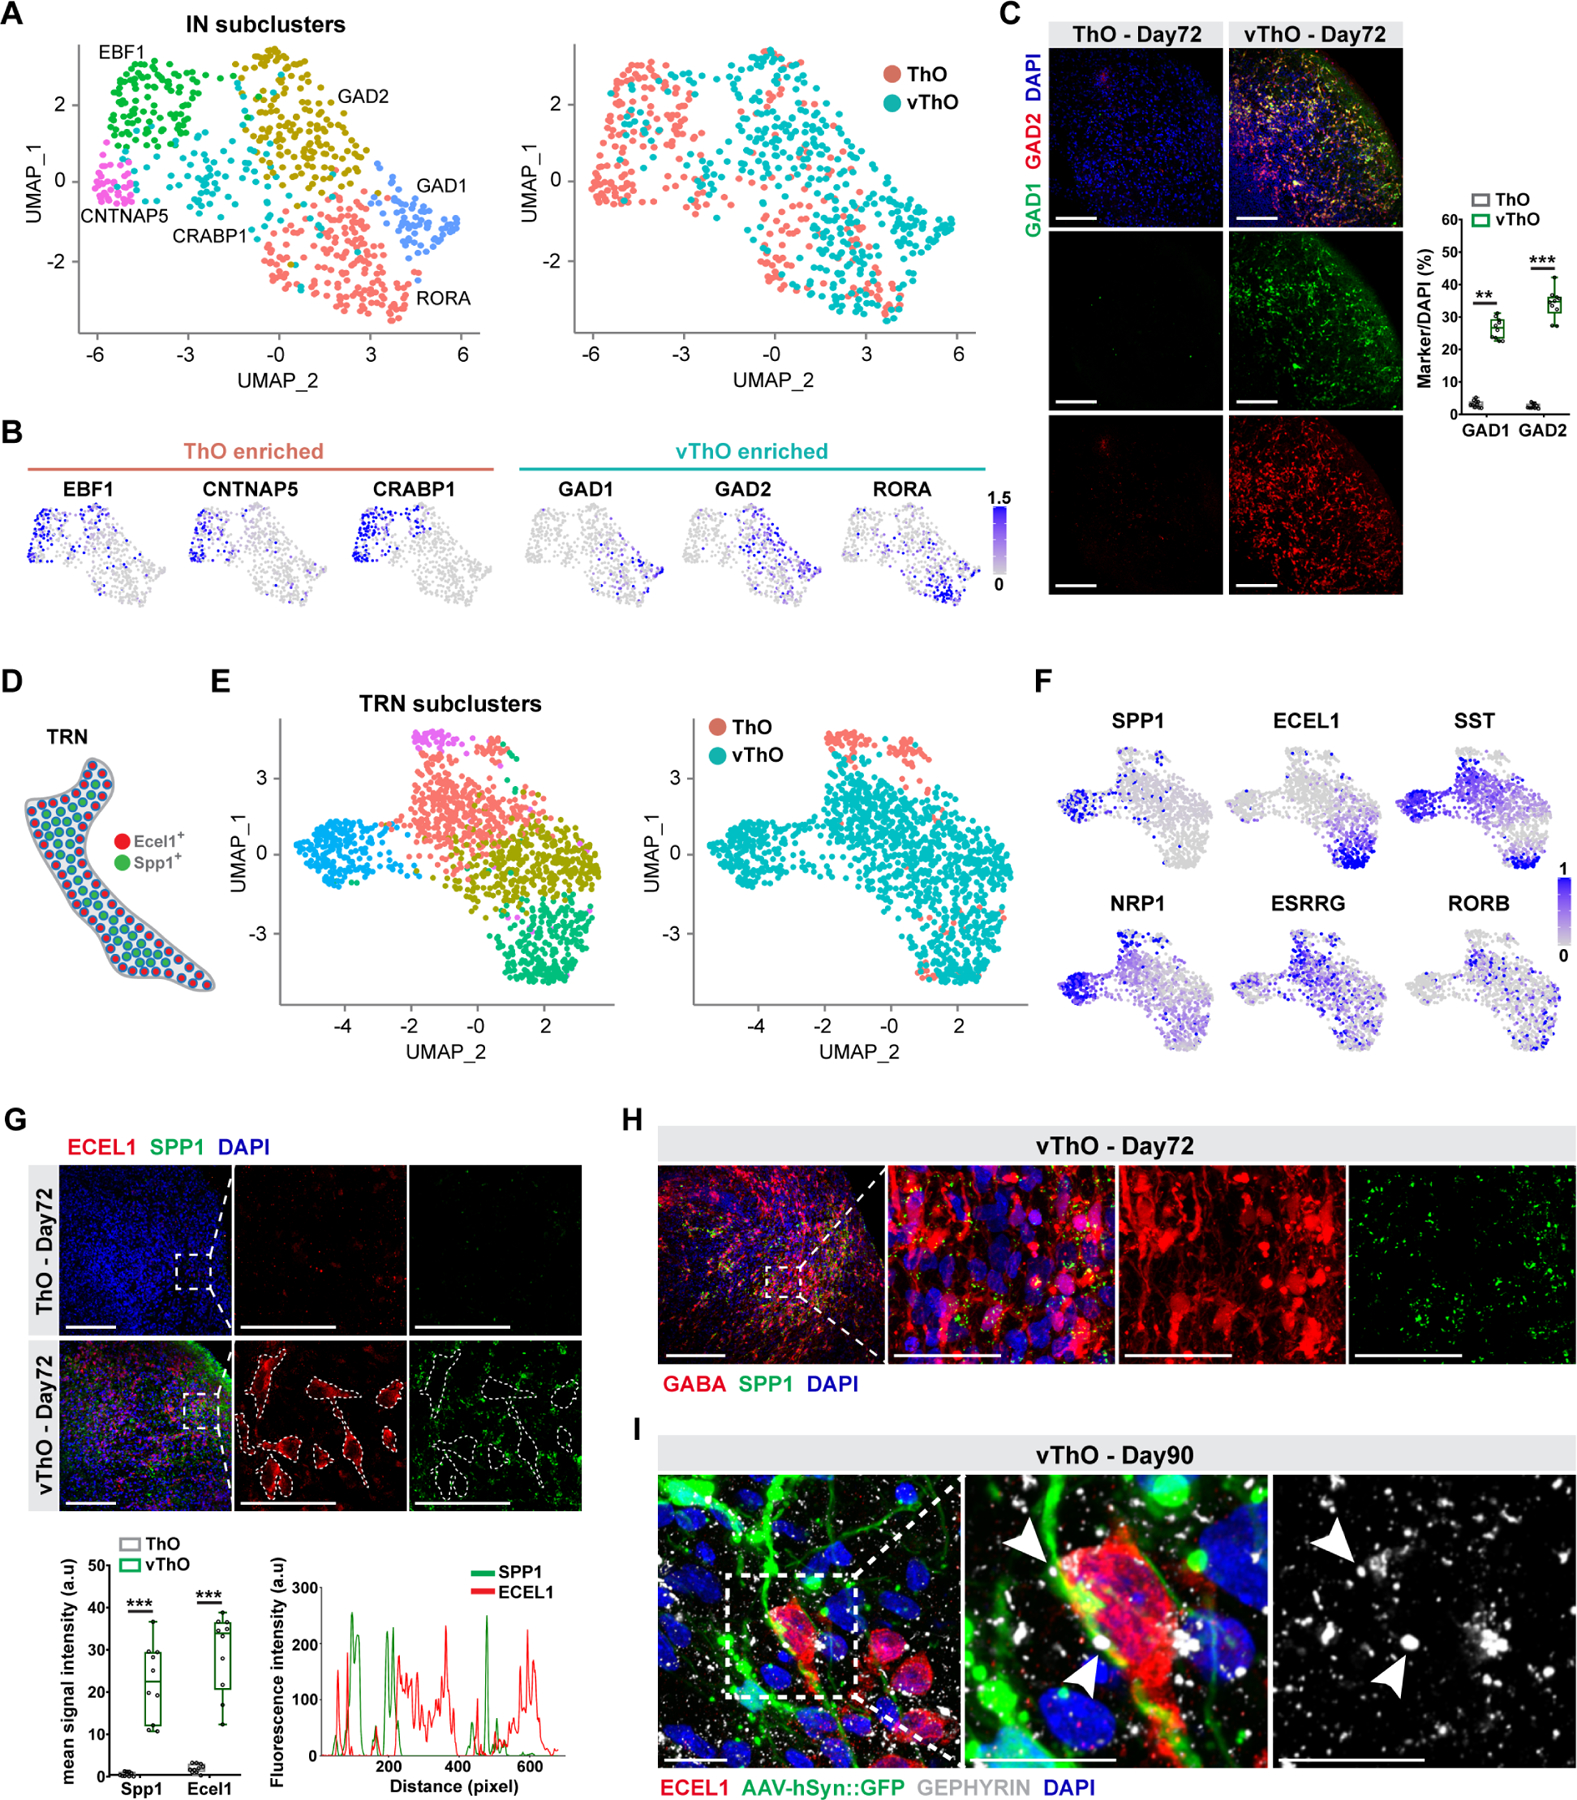
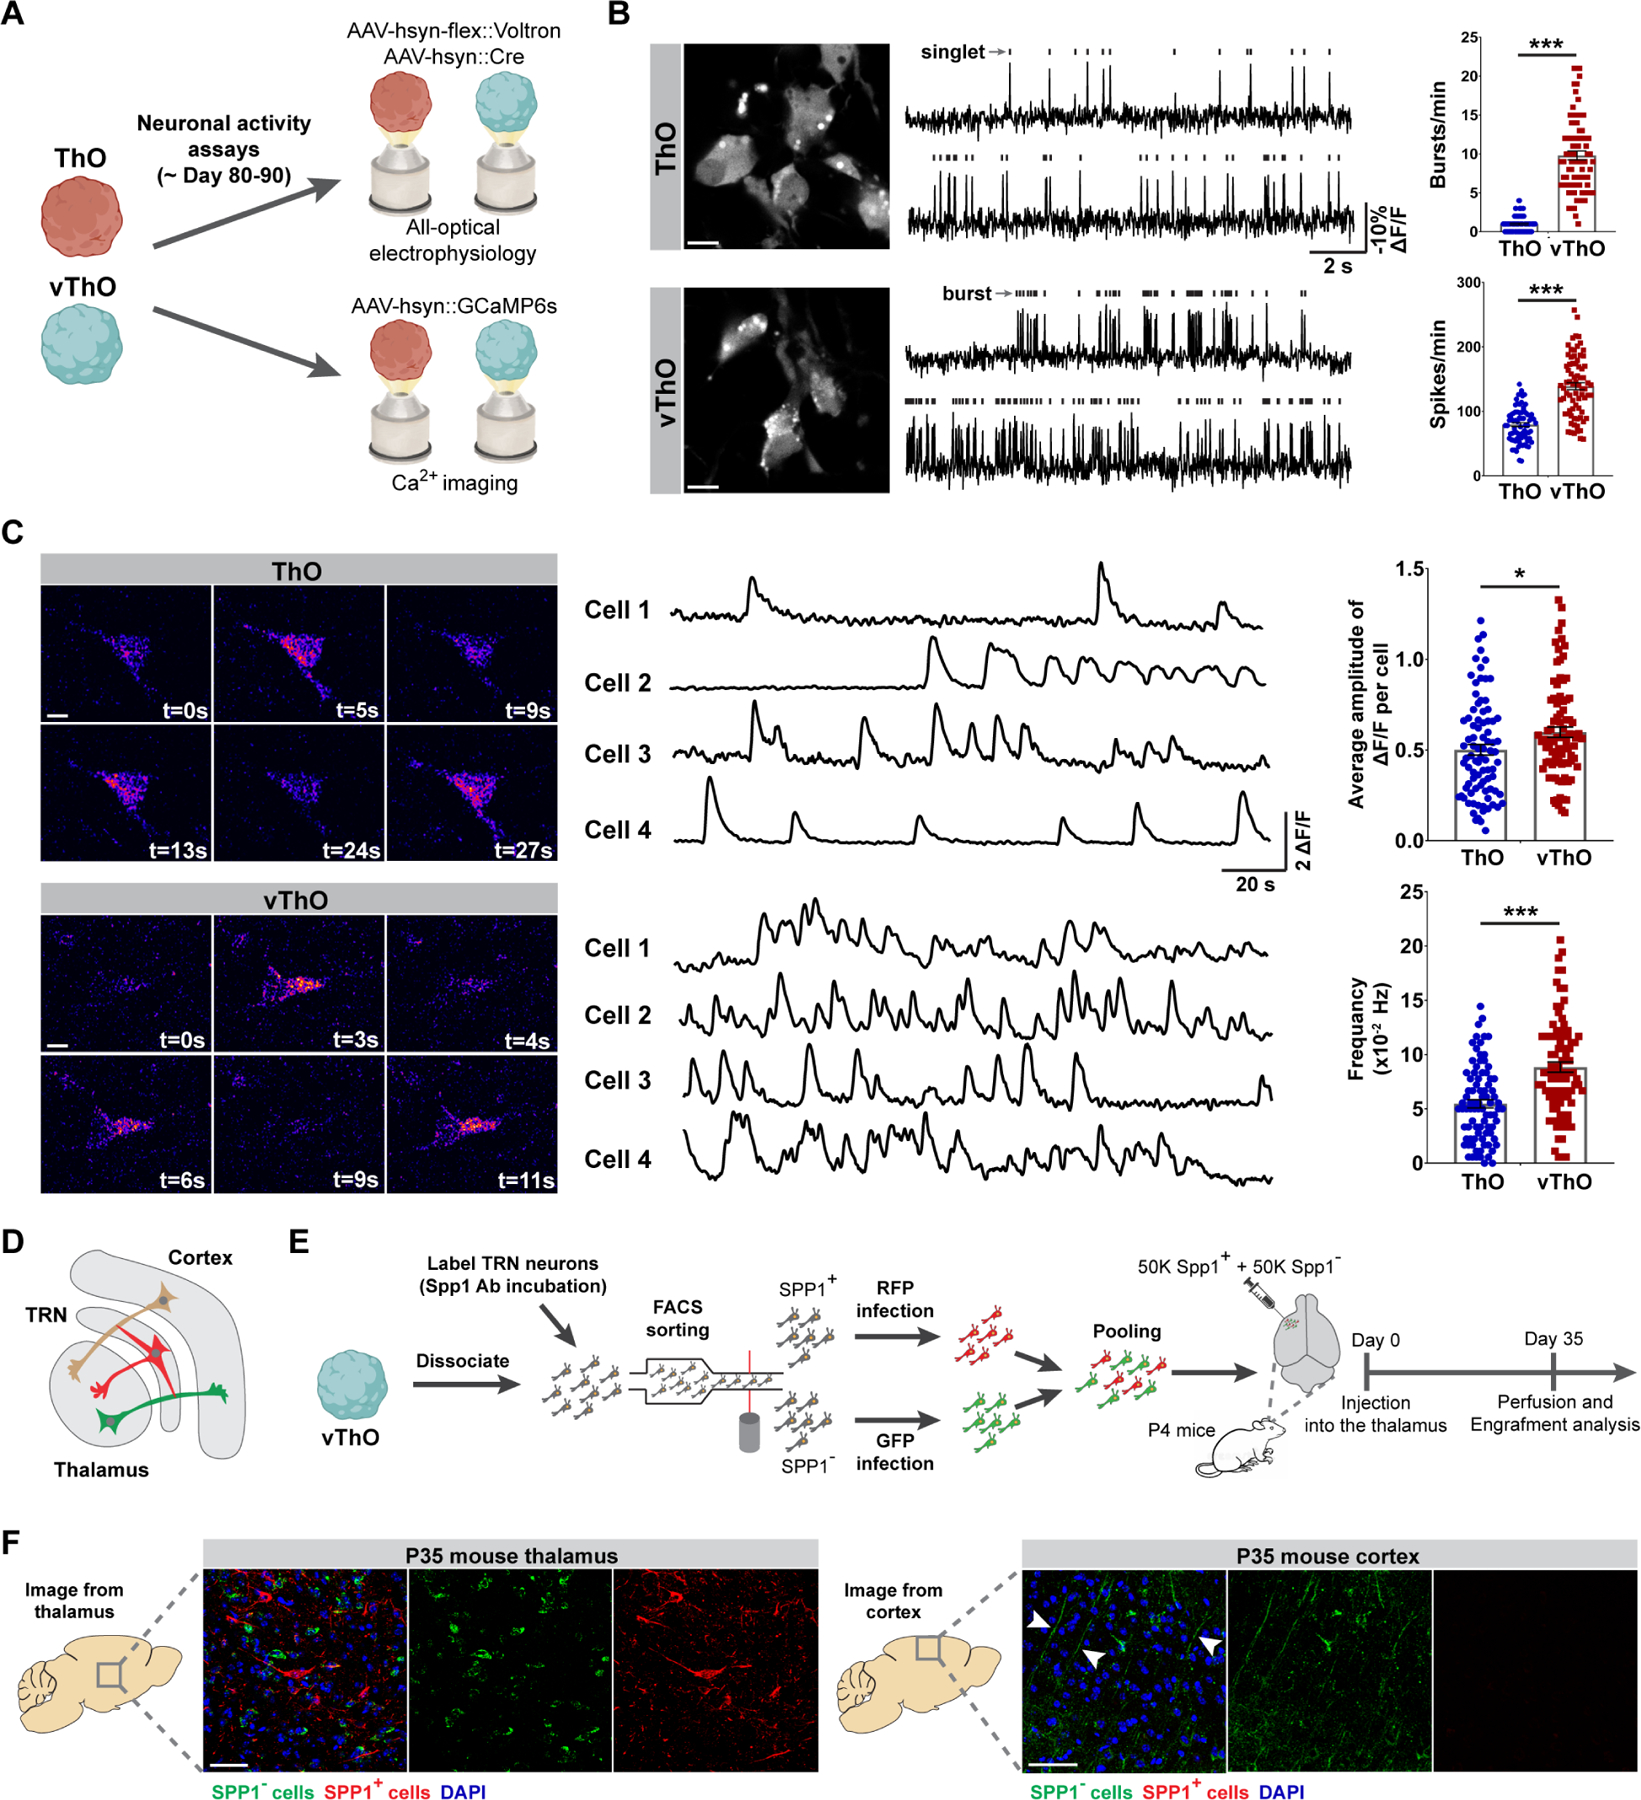
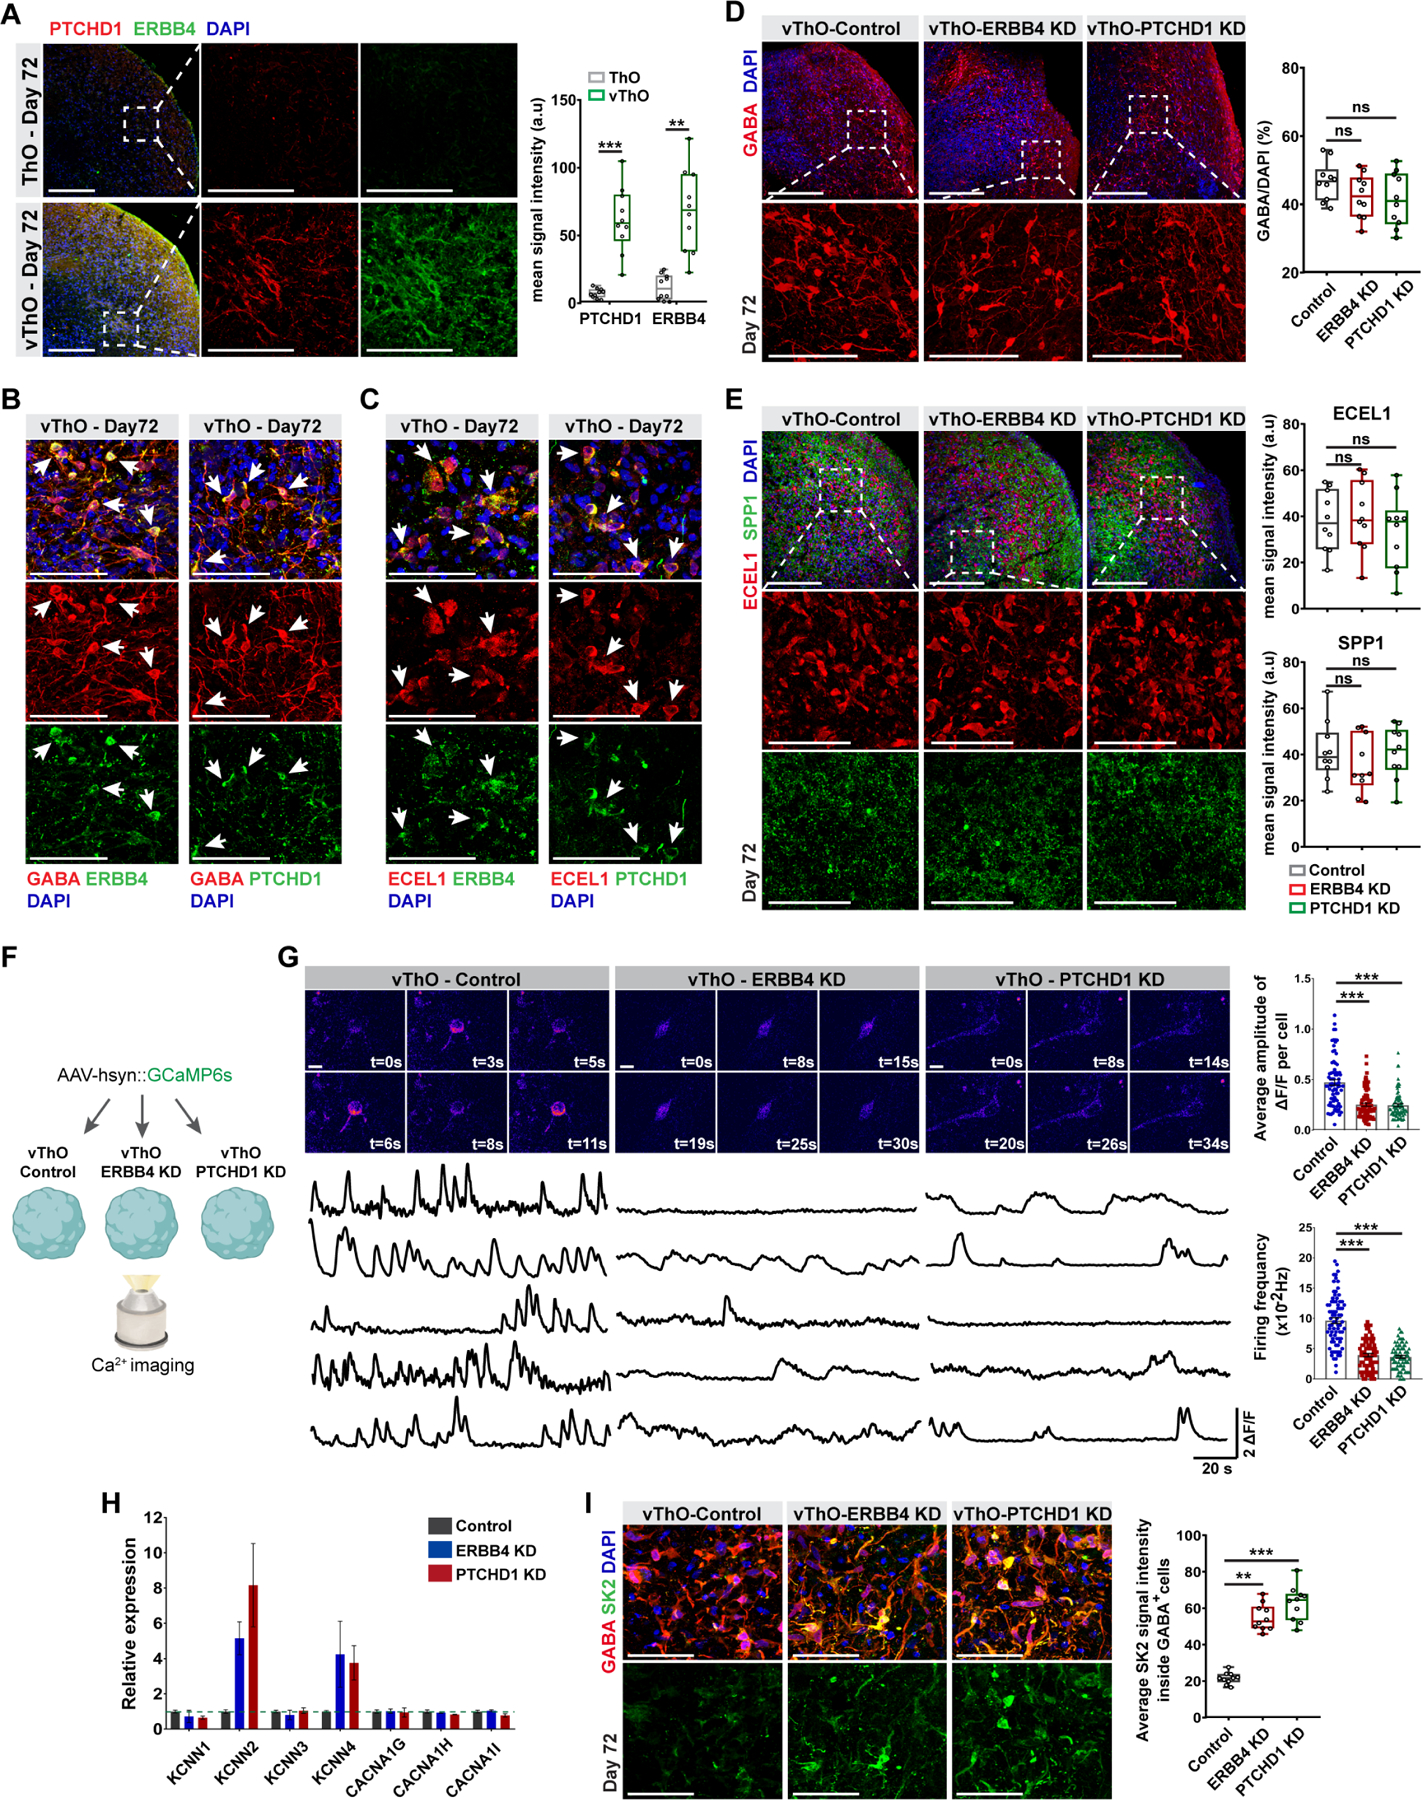
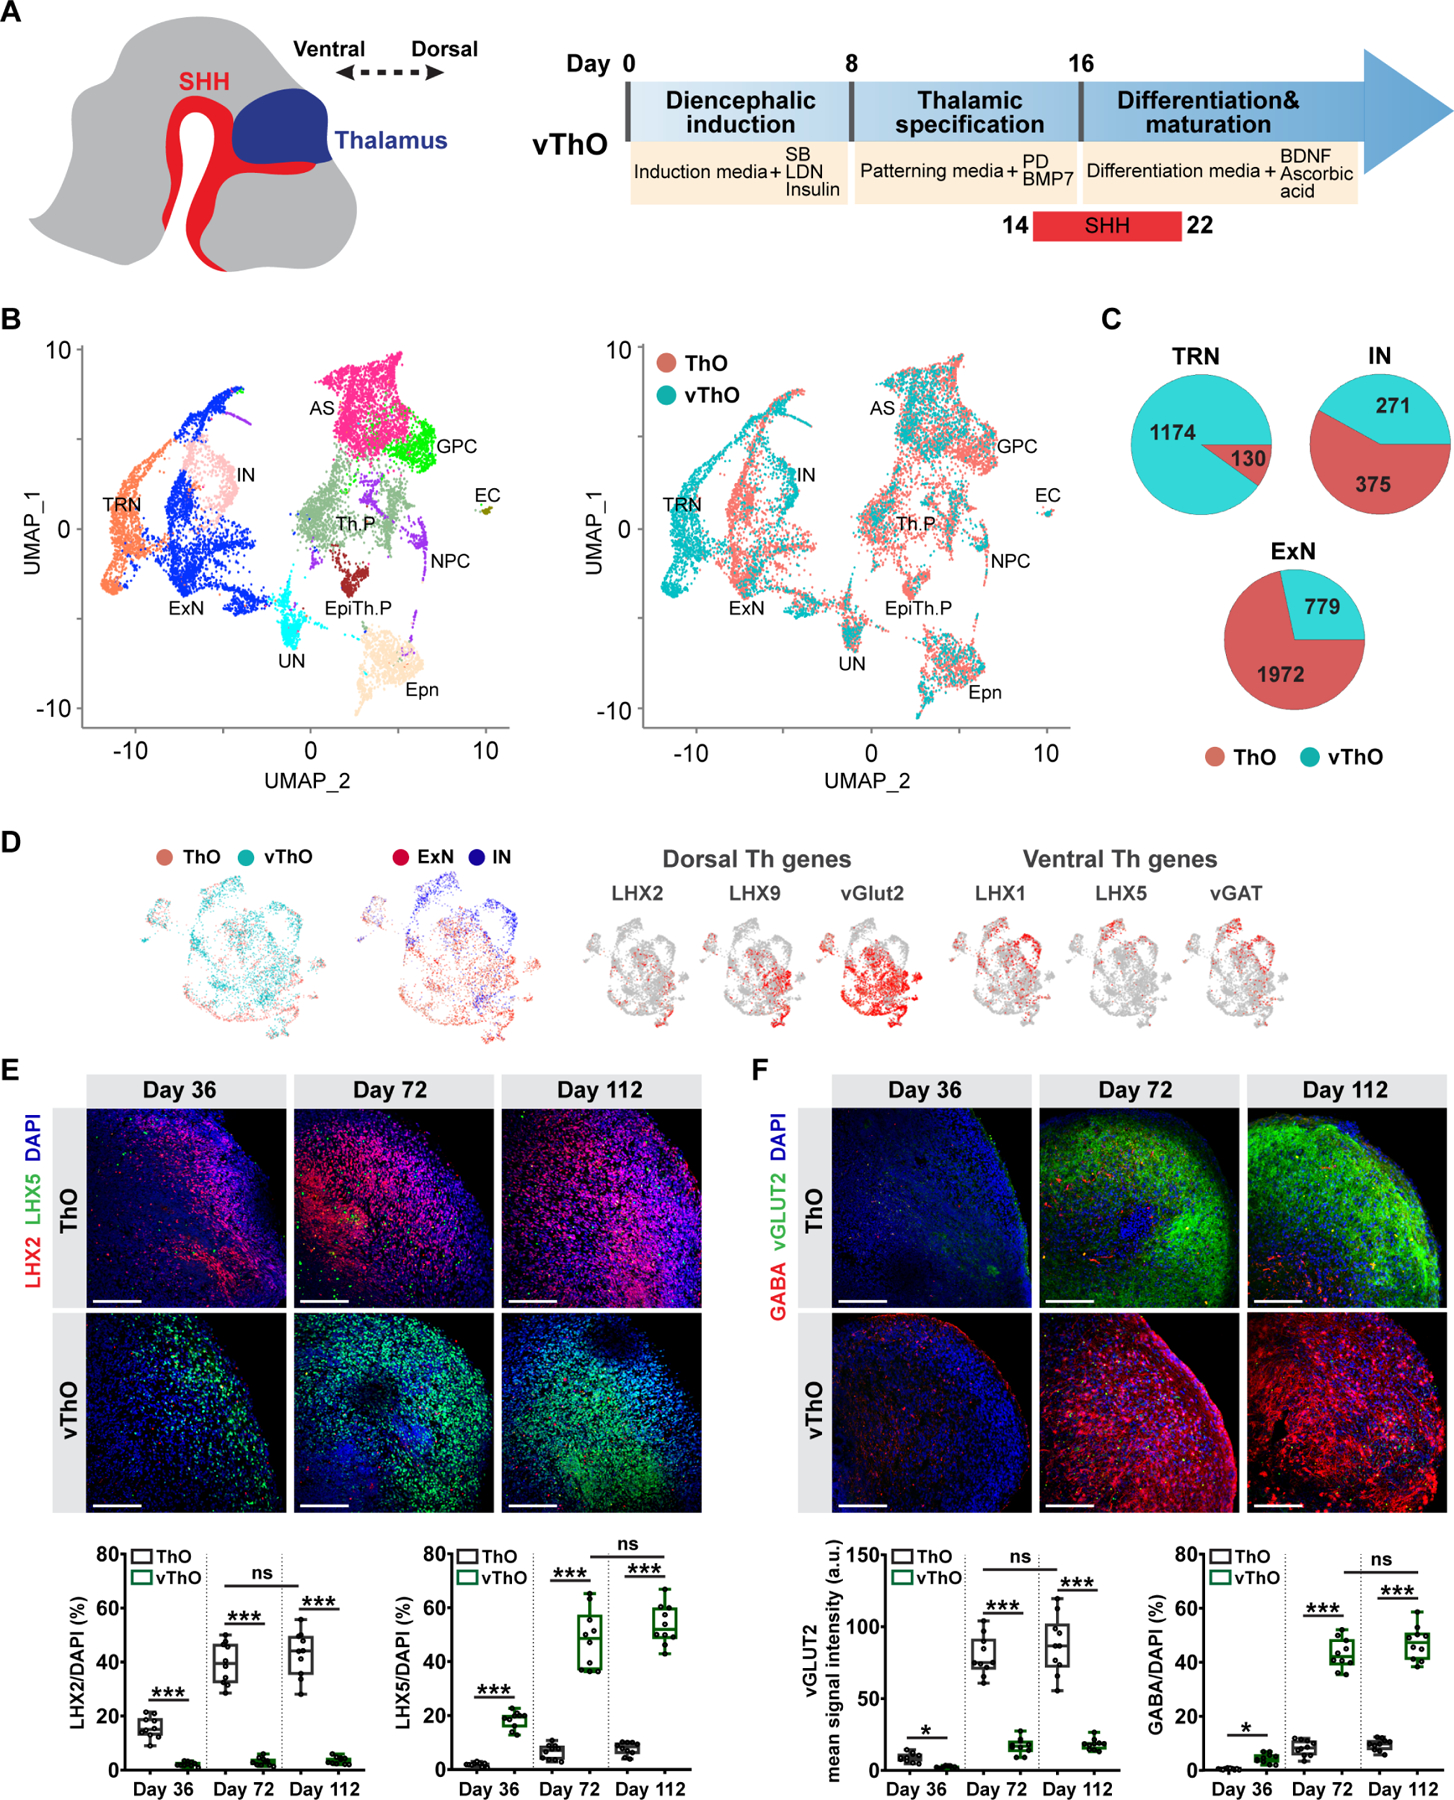
Human brain organoids provide unique platforms for modeling several aspects of human brain development and pathology. However, current brain organoid systems mostly lack the resolution to recapitulate the development of finer brain structures with subregional identity, including functionally distinct nuclei in the thalamus. Here, we report a method for converting human embryonic stem cells (hESCs) into ventral thalamic organoids (vThOs) with transcriptionally diverse nuclei identities. Notably, single-cell RNA sequencing revealed previously unachieved thalamic patterning with a thalamic reticular nucleus (TRN) signature, a GABAergic nucleus located in the ventral thalamus. Using vThOs, we explored the functions of TRN-specific, disease-associated genes patched domain containing 1 (PTCHD1) and receptor tyrosine-protein kinase (ERBB4) during human thalamic development. Perturbations in PTCHD1 or ERBB4 impaired neuronal functions in vThOs, albeit not affecting the overall thalamic lineage development. Together, vThOs present an experimental model for understanding nuclei-specific development and pathology in the thalamus of the human brain.

Keywords: 3-D organoids; ERBB4; PTCHD1; TRN; brain organoid; hESC; stem cells; thalamic organoid; thalamic reticular nucleus; ventral thalamic organoids.


Conflict of interest statement

Declaration of interests The authors declare no competing interests.

Figures

Figure 1.
Figure 1.. Transcriptional and cellular characterization of ventral thalamic organoids (vThOs).
(A) Left, a schematic view showing the regionalization of the diencephalon by SHH activity during embryonic development. Right, schematic describing the protocol for generating vThOs from human hESC. (B) UMAP plots of single-cell RNA-seq analysis from ThOs and vThOs at day 70 colored by cell type assignment (left) and organoid type (right). ExN: Excitatory neuron, IN: Inhibitory neuron, TRN: Thalamic reticular nucleus neuron, AS: astrocyte, EpiTh.P: Epithalamic progenitors, Th.P: Thalamic progenitors, NPC: neuronal progenitor cell, GPC: glia progenitor cell, Epn: Ependymal cell, EC: Endothelial cell, UN: unassigned cells. (C) Pie chart representing the cell count from ThOs and vThOs in TRN, IN, and ExN clusters. (D) Distribution of excitatory and inhibitory neurons in ThOs and vThOs, and expression profiles of known ventral/dorsal thalamic markers in ThO- and vThO-derived cells. (E) Immunostaining of vThOs and ThOs at days 36, 72, and 112 for dorsal identity marker LHX2 and ventral identity marker LHX5. Data represent the mean ± SEM (n=10 organoids, ns=not significant, ***p<0.001). An unpaired two-tail t-test with Welch’s correction was used for comparison. (F) Immunostaining of vThOs and ThOs at days 36, 72, and 112 for excitatory neuron marker vGLUT2 and inhibitory neuron marker GABA. Data represent the mean ± SEM (n=10 organoids, ns=not significant, *p<0.05, ***p<0.001). An unpaired two-tail t-test with Welch’s correction was used for comparison. Scale bars represent 100 μm in E and F.
Figure 2.
Figure 2.. Cell heterogeneity of inhibitory and TRN neuron cell clusters from vThOs.
(A) UMAP plots of single-cell RNA-seq analysis of ThOs and vThOs from IN cell clusters. (B) GAD1, GAD2, and RORA are significantly enriched in inhibitory thalamic neurons derived from vThOs. In contrast, ThO-derived inhibitory neurons express genes including EBF1, CNTNAP5, and CRABP1. Enrichment and depletion are scaled by - log2(FDR) and shown as a grey-to-blue gradient towards enriched expression. (C) Left, GAD1 and GAD2 staining of ThOs and vThOs at day 72. Right, quantification of marker+/DAPI+ cells indicated the drastic enrichment of GAD1+ and GAD2+ neurons in vThOs at day 72. Data represent the mean ± SEM (n=10 organoids, **p<0.01, ***p<0.001). An unpaired two-tail t-test with Welch’s correction was used for comparison. (D) Scheme demonstrating non-overlapping expression of ECEL1 and SPP1 within TRN. (E) UMAP plots of single-cell RNA-seq analysis of ThOs and vThOs from TRN cells indicating distinct subclusters. (F). Enrichment of TRN-specific cell markers, SPP1, ECEL1, SST, NRP1, ESRRG, and RORB within vThOs. Exclusive expressions of SPP1 and ECEL1 were observed in TRN subpopulations. Enrichment and depletion are scaled by - log2(FDR) and shown as a grey-to-blue gradient towards enriched expression. (G) Top, co-staining for SPP1 and ECEL1 in ThOs and vThOs at day 72. Dotted lines mark the territory of ECEL1-positive cells. Note the exclusion of the SPP1 signal in the dotted lines. Bottom, quantification of mean signal intensity in cells indicates the drastic enrichment of SPP1 and ECEL1 in vThOs compared to ThOs. The fluorescence intensity graph shows the non-overlapping localization of SPP1 and ECEL1. Data represent the mean ± SEM (n=10 organoids, ***p<0.001). An unpaired two-tail t-test with Welch’s correction was used for comparison. (H) Co-staining of GABA and SPP1 in vThOs at day 72. Note the co-localization of TRN neuron marker SPP1 within GABA-positive inhibitory neurons. (I) Co-staining of TRN neuron markers ECEL1 and inhibitory synapse marker GEPHYRIN in AAV-hSyn::GFP infected vThOs at Day90. Arrowheads point synapses between ECEL1+ TRN neuron and GFP+/ECEL1 nonTRN neurons. Scale bars represent 100 μm in C, G and H, and 20 μm in I.
Figure 3.
Figure 3.. Neurons from ThOs and vThOs demonstrate distinct firing properties
(A) Schematic diagram showing all-optical electrophysiology and calcium imaging approach to record neuronal activity in ThOs and vThOs at days 80–90. (B) Left, representative images of neurons in ThO and vThO expressing the voltage indicator Voltron and labeled with Janelia Fluor 549 (JF549). Middle, representative voltage traces from neurons in ThO and vThO with detected action potentials indicated by black rectangles above the traces. Right, quantifications of burst and spike numbers per minute observed in neurons from ThOs and vThOs. Data represent the mean ± SEM (n=80 neurons per condition from 8 different organoids, ***p<0.001). An unpaired two-tail t-test with Welch’s correction was used for comparison. (C) Left, representative images demonstrating calcium activity traces observed from individual neurons in ThOs and vThOs (day80-90). Right, quantifications of the average amplitude of 𝛥F/F per cell and calcium spike frequency of neurons from ThOs and vThOs. Data represent the mean ± SEM (n=90 neurons per condition from 9 different organoids, *p<0.05, ***p<0.001). An unpaired two-tail t-test with Welch’s correction was used for comparison. (D) Scheme showing main connections between the thalamus, cerebral cortex, and TRN. (E) Depiction of isolation and transplantation of SPP1+ (RFP) and SPP1 (GFP) vThO-derived neurons into the cortex of immune-deficient mice brain. (F) Co-staining for GFP and RFP indicates successful engraftment of SPP1 thalamic neurons and SPP1+ TRN neurons into the mouse thalamus (left panel). SPP1 thalamic neurons project to the cortex but not SPP1+ TRN neurons similar to their in vivo counterparts (right panel). n=7 animals. Scale bars represent 10 μm in B and C and 100 μm in F.
Figure 4.
Figure 4.. Suppression of disease associated-, TRN enriched genes, ERBB4 and PTCHD1 results in reduced neuronal activity in vThOs.
(A) Left, co-staining for ERBB4 and PTCHD1 indicates enriched expression of these genes in vThOs at day 72. Right, mean signal intensity quantification for ERBB4 and PTCHD1 in ThOs and vThOs. Data represent the mean ± SEM (n=10 organoids, **p<0.01, ***p<0.001). An unpaired two-tail t-test with Welch’s correction was used for comparison. (B) Co-staining of ERBB4 and PTCHD1 with inhibitory neuron marker GABA in vThOs at day 72. Arrows point co-localization of ERBB4-GABA and PTCHD1-GABA. (C) Co-staining of ERBB4 and PTCHD1 with TRN neuron marker ECEL1 in vThOs at day 72. Arrows point co-localization of ERBB4-ECEL1 and PTCHD1-ECEL1. (D) Left, immunostaining for inhibitory neuron marker GABA in control, ERBB4 knockdown (ERBB4-KD) and PTCHD1 knockdown (PTCHD1-KD) vThOs at day 72. Right, quantification of GABA+/DAPI+ cells in organoids indicates similar GABAergic neuron differentiation across different conditions. Data represent the mean ± SEM (n=10 organoids). One-way ANOVA with Dunnett’s multiple comparison test was used for comparison. (E) Left, immunostaining for TRN neuron markers ECEL1 and SPP1 in control, ERBB4 knockdown (ERBB4-KD) and PTCHD1 knockdown (PTCHD1-KD) vThOs at day 72. Right, quantification of ECEL1 and SPP1 mean signal intensity indicating similar TRN neuron differentiation across different conditions. Data represent the mean ± SEM (n=10 organoids). One-way ANOVA with Dunnett’s multiple comparison test was used for comparison. (F) Schematic diagram showing calcium activity recordings in vThO, vThO-ERBB4 KD, and vThO-PTCHD1 KD. (G) Left, representative images demonstrating calcium activity traces observed from individual neurons in control, ERBB4-KD and PTCHD1-KD vThOs (day80-90). Right, quantifications of the average amplitude of 𝛥F/F per cell and calcium spike frequency of neurons in control, ERBB4-KD and PTCHD1-KD vThOs. Data represent the mean ± SEM (n=80 neurons per condition from 8 different organoids, ***p<0.001). One-way ANOVA with Dunnett’s multiple comparison test was used for comparison. (H) qPCR analysis for expression levels of genes encoding for small conductance Ca2+-activated potassium channels (KCNN1-4) and T-type calcium channels (CACNA1G-I) in control, ERBB4 KD, and PTCHD1 KD vThOs. (I) Left, co-staining of inhibitory neuron marker GABA and small conductance Ca2+-activated potassium channel 2 (SK2) in control, ERBB4 KD, and PTCHD1 KD vThOs. Right, quantification of average SK2 signal intensity in GABA+ inhibitory neurons. Note accumulation of SK2 in ERBB4 KD and PTCHD1 KD compared to control vThOs. Data represent the mean ± SEM (n=10 organoids). One-way ANOVA with Dunnett’s multiple comparison test was used for comparison. Scale bars represent 100 μm in A-E and H-I, and 10 μm in G.

Similar articles

Cited by

References

    1. Xiang Y, Cakir B, and Park IH (2021). Deconstructing and reconstructing the human brain with regionally specified brain organoids. Semin Cell Dev Biol 111, 40–51. 10.1016/j.semcdb.2020.05.023. - DOI - PubMed
    1. Susaimanickam PJ, Kiral FR, and Park IH (2022). Region Specific Brain Organoids to Study Neurodevelopmental Disorders. Int J Stem Cells 15, 26–40. 10.15283/ijsc22006. - DOI - PMC - PubMed
    1. Huang WK, Wong SZH, Pather SR, Nguyen PTT, Zhang F, Zhang DY, Zhang Z, Lu L, Fang W, Chen L, et al. (2021). Generation of hypothalamic arcuate organoids from human induced pluripotent stem cells. Cell Stem Cell 28, 1657–1670 e1610. 10.1016/j.stem.2021.04.006. - DOI - PMC - PubMed
    1. Halassa MM, and Sherman SM (2019). Thalamocortical Circuit Motifs: A General Framework. Neuron 103, 762–770. 10.1016/j.neuron.2019.06.005. - DOI - PMC - PubMed
    1. Roy DS, Zhang Y, Halassa MM, and Feng G (2022). Thalamic subnetworks as units of function. Nat Neurosci 25, 140–153. 10.1038/s41593-021-00996-1. - DOI - PMC - PubMed

Publication types