. 2023 Jun:72:101715.
doi: 10.1016/j.molmet.2023.101715. Epub 2023 Apr 3.

An early, reversible cholesterolgenic etiology of diet-induced insulin resistance

Affiliations

An early, reversible cholesterolgenic etiology of diet-induced insulin resistance

Jacob D Covert et al. Mol Metab. 2023 Jun.

Abstract

Objective: A buildup of skeletal muscle plasma membrane (PM) cholesterol content in mice occurs within 1 week of a Western-style high-fat diet and causes insulin resistance. The mechanism driving this cholesterol accumulation and insulin resistance is not known. Promising cell data implicate that the hexosamine biosynthesis pathway (HBP) triggers a cholesterolgenic response via increasing the transcriptional activity of Sp1. In this study we aimed to determine whether increased HBP/Sp1 activity represented a preventable cause of insulin resistance.

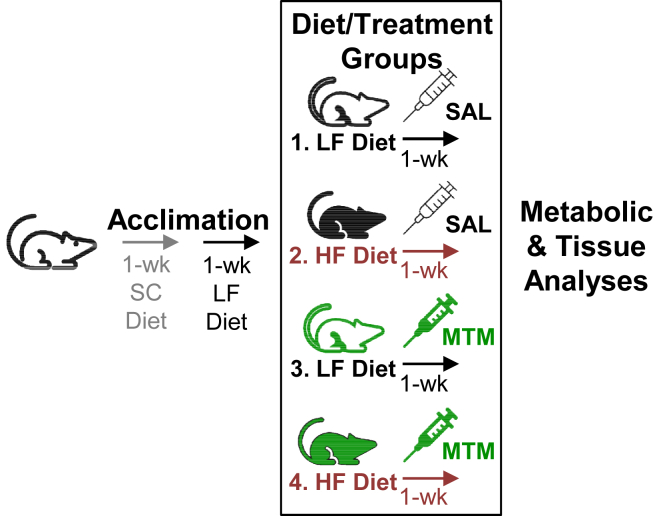
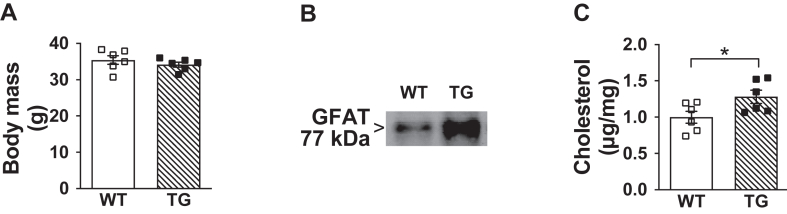
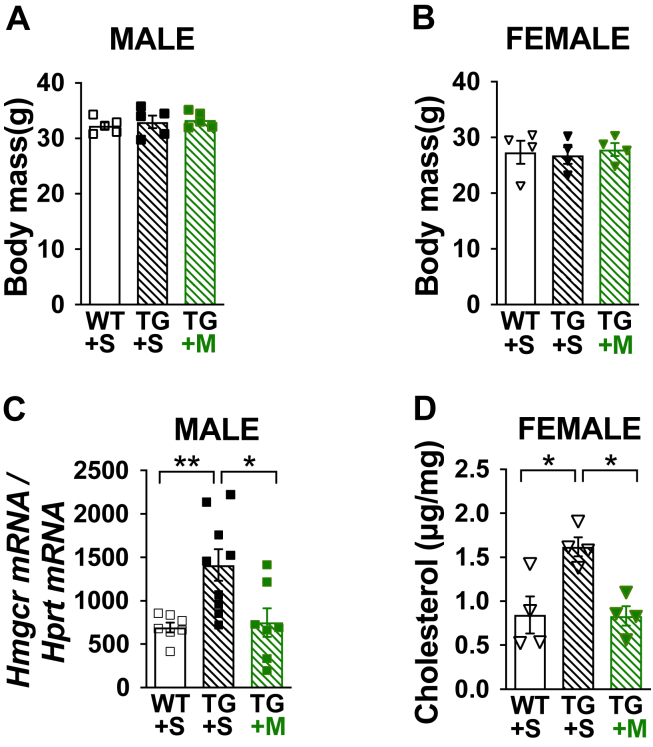
Methods: C57BL/6NJ mice were fed either a low-fat (LF, 10% kcal) or high-fat (HF, 45% kcal) diet for 1 week. During this 1-week diet the mice were treated daily with either saline or mithramycin-A (MTM), a specific Sp1/DNA-binding inhibitor. A series of metabolic and tissue analyses were then performed on these mice, as well as on mice with targeted skeletal muscle overexpression of the rate-limiting HBP enzyme glutamine-fructose-6-phosphate-amidotransferase (GFAT) that were maintained on a regular chow diet.

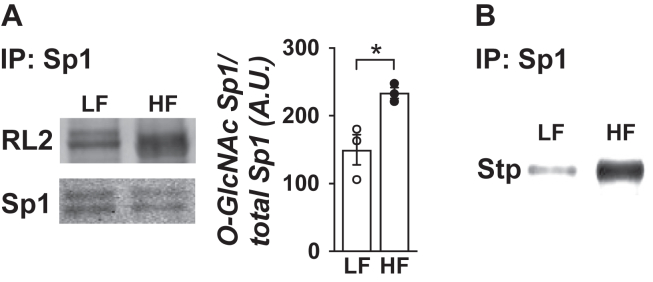
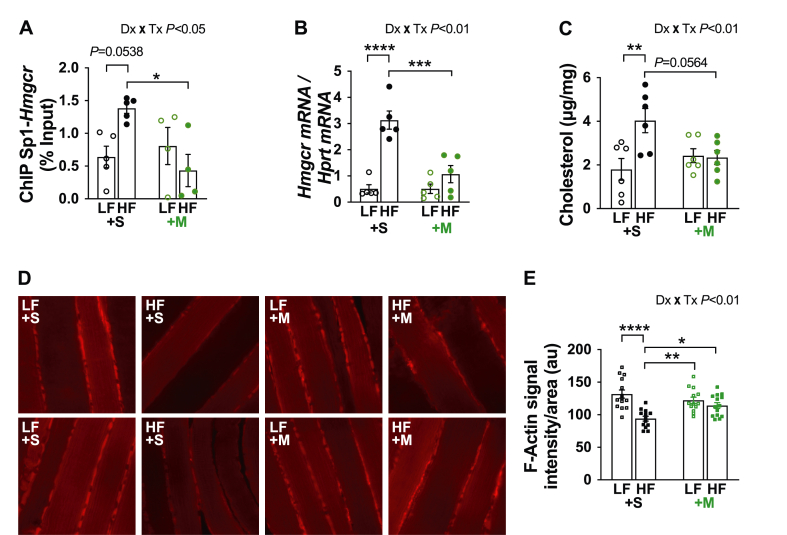
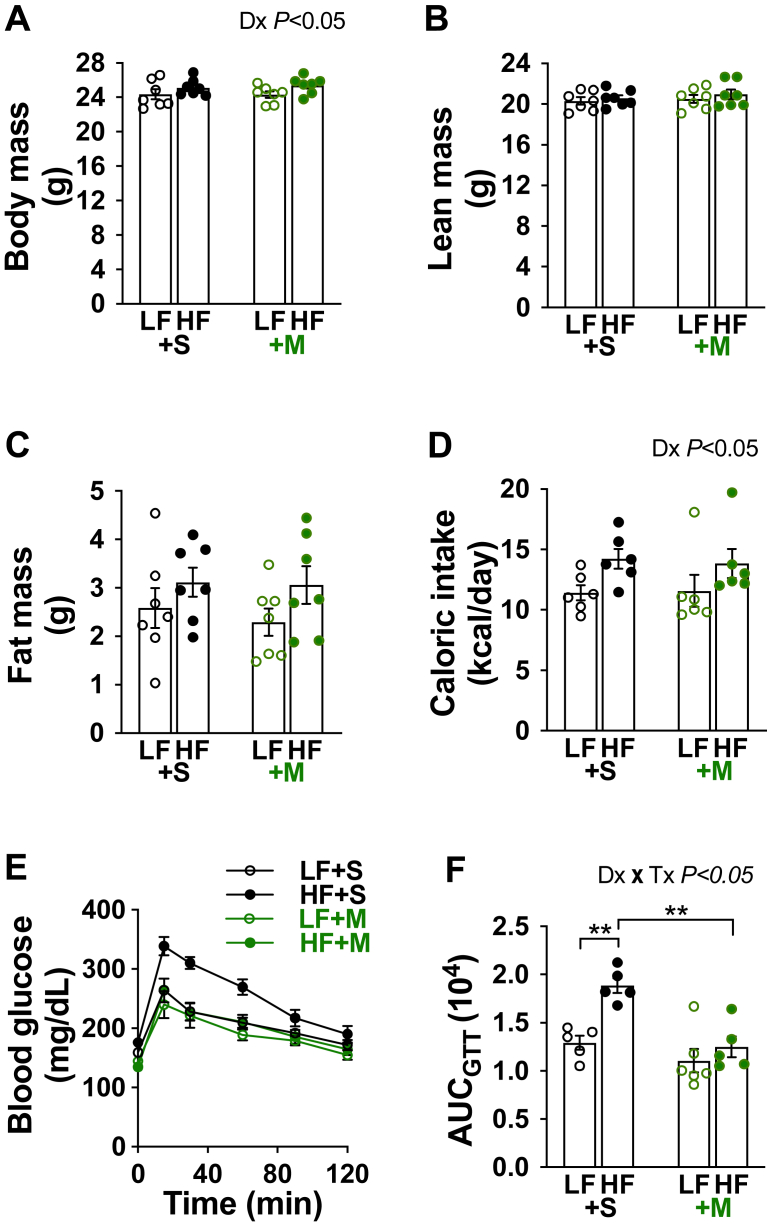
Results: Saline-treated mice fed this HF diet for 1 week did not have an increase in adiposity, lean mass, or body mass while displaying early insulin resistance. Consistent with an HBP/Sp1 cholesterolgenic response, Sp1 displayed increased O-GlcNAcylation and binding to the HMGCR promoter that increased HMGCR expression in skeletal muscle from saline-treated HF-fed mice. Skeletal muscle from these saline-treated HF-fed mice also showed a resultant elevation of PM cholesterol with an accompanying loss of cortical filamentous actin (F-actin) that is essential for insulin-stimulated glucose transport. Treating these mice daily with MTM during the 1-week HF diet fully prevented the diet-induced Sp1 cholesterolgenic response, loss of cortical F-actin, and development of insulin resistance. Similarly, increases in HMGCR expression and cholesterol were measured in muscle from GFAT transgenic mice compared to age- and weight-match wildtype littermate control mice. In the GFAT Tg mice we found that these increases were alleviated by MTM.

Conclusions: These data identify increased HBP/Sp1 activity as an early mechanism of diet-induced insulin resistance. Therapies targeting this mechanism may decelerate T2D development.

Keywords: Cholesterol; Insulin resistance; Membrane; Skeletal muscle.


Figures

Figure 1
Figure 1
Dietary and treatment intervention plan. Upon arrival to our facility, 2 wks before the diet and treatment intervention all mice were singly housed, given standard laboratory chow (SC) for 1 wk and then the low-fat (LF) diet for 1 wk to adapt to the modified diet. Following this 2-wk acclimation period, mice were either left on the LF diet (Groups 1 and 3, black line) or switched to the HF diet (Groups 2 and 4, red line). Mice were injected intraperitoneally with either saline (SAL, Groups 1 and 2, black) or 0.15 mg/kg mithramycin-A (MTM, Groups 3 and 4, green) daily during the 1-week LF or HF diet. All groups consisted of several cohorts of 6–9 mice for metabolic/tissue analyses performed immediately following the 1-wk diet/treatment period.
Figure 5
Figure 5
One week of HF feeding provokes O-linked glycosylation of Sp1 in skeletal muscle. Lysates from skeletal muscle from LF- and HF-fed mice were immunoprecipitated with an Sp1 antibody to detect O-linked glycosylation. (A) Eluted samples were immunoblotted (IB) with RL2 or Sp1 antibody (n = 3 per group). (B) Immunoprecipitates were subjected to enzymatic biotin labeling with a Click-iT kit and immunoblotted with streptavidin (Stp) antibody (n = 3 per group). Note Sp1 antibody labeling of the biotin-labeled O-GlcNAc did not yield interpretable immunoblots. Representable immunoblots are shown. Data represent means ± SEM. Difference between groups was analyzed using a two-tailed unpaired t test. ∗p < 0.05.
Figure 6
Figure 6
One week of HF feeding causes a cholesterolgenic response in skeletal muscle. (A) ChIP was performed on skeletal muscle lysates. Purified DNA and primers specific to the Sp1-binding sites in the promoter region of Hmgcr were used for qPCR (n = 4–5 per group). (B) Hmgcr mRNA expression (n = 5 per group). (C) Triad-enriched membrane cholesterol (n = 6 per group). (D) Two representative images of 1-mm sections of soleus muscle per group subjected to immunofluorescent labeling of F-actin. Note prior to imaging, all samples were de-identified to ensure an objective analysis. All images were taken in the same focal plane of the section and under identical microscopic parameters. (E) Immunofluorescence F-actin intensity/area for multiple (3–5) images captured in muscle sections per muscle per mouse (n = 3). Difference between groups was analyzed using a two-way ANOVA and Tukey's multiple comparison tests. ∗p < 0.05, ∗∗p < 0.005, ∗∗∗p < 0.0005, ∗∗∗∗p < 0.0001.
Figure 2
Figure 2
High-fat feeding for 1 week impaired glucose tolerance in saline-, but not MTM-, treated mice. (A–C) Body mass, lean mass, and adiposity following the 1-wk diet/treatment intervention for LF- (open symbols) and HF-fed (solid symbols) mice treated daily during the intervention with saline (black symbols) or MTM (green symbols) (n = 7 per group). (D) Average daily caloric intake during the 1-wk diet/treatment intervention (n = 6 per group). (E) Blood glucose measured after an intraperitoneal injection of glucose (2 g/kg, n = 5–6 per group). (F) Area under the curve (AUC). Data represent means ± SEM. Difference between groups was analyzed using a two-way ANOVA and Tukey's multiple comparison tests. ∗∗p < 0.005.
Figure 3
Figure 3
Daily MTM treatment prevented the development of insulin resistance in mice fed a HF diet for 1 week. (A) Arterial blood glucose, (B) plasma insulin, (C–D) Glucose infusion rate (GIR), (E) glucose disposal (Rd), (F) [14C]-2DG tissue glucose uptake (Rg), (G–H) glucose production (Endo Ra) and as %suppression from basal, and (I) tissue glycogen synthesis during the hyperinsulinemic-euglycemic clamp. Data represent means ± SEM from 7 to 9 mice per group. Difference between groups was analyzed using a two-way ANOVA and Tukey's multiple comparison tests. ∗p < 0.05, ∗∗p < 0.005, ∗∗∗p < 0.0005, ∗∗∗∗p < 0.0001.
Figure 4
Figure 4
Metabolic function and energy expenditure in mice during the diet/intervention. (A) Oxygen consumption (VO2), (B) carbon dioxide production (VCO2), (C) respiration (RER), (D) spontaneous physical activity (SPA), and (E–F) energy expenditure (EE). Data represent means ± SEM from 7 mice per group. (A–D) Difference between groups was analyzed using a two-way ANOVA and Tukey's multiple comparison tests. ∗p < 0.05, ∗∗p < 0.005, ∗∗∗p < 0.0005, ∗∗∗∗p < 0.0001 versus respective light group.
Figure 7
Figure 7
Overexpression of skeletal muscle GFAT causes membrane cholesterol accumulation and glucose intolerance in male mice fed standard laboratory chow. (A) Body mass of age-and weight-matched GFAT Tg and Wt littermate control mice (n = 6 per group), (B) Representative immunoblot of GFAT from skeletal muscle lysate, and (C) Skeletal muscle membrane cholesterol (n = 6 per group) from these mice. Data represent means ± SEM. Difference between groups was analyzed using a one-tailed unpaired t test. ∗p < 0.05.
Figure 8
Figure 8
Insulin-resistant GFAT Tg mice display an Sp1-mediated cholesterolgenic response. Age- and weight-matched male and female Tg and Wt littermate control mice fed standard laboratory chow were treated with either saline (+S) or MTM (+M) for 1 wk for determination of (A, B) Body mass (4–5 per group), (C) Skeletal muscle Hmgcr mRNA expression (n = 7–9 per group), and (D) Skeletal muscle membrane cholesterol (n = 4). Data represent means ± SEM. Difference between groups was analyzed using a one-way ANOVA and the Tukey's multiple comparison tests. ∗p < 0.05, ∗∗p < 0.005.

Similar articles

Cited by

References

    1. Norton L., Shannon C., Gastaldelli A., DeFronzo R.A. Insulin: the master regulator of glucose metabolism. Metabolism. 2022;129 - PubMed
    1. Grice B.A., Barton K.J., Covert J.D., Kreilach A.M., Tackett L., Brozinick J.T., et al. Excess membrane cholesterol is an early contributing reversible aspect of skeletal muscle insulin resistance in C57BL/6NJ mice fed a Western-style high-fat diet. Am J Physiol Endocrinol Metab. 2019;317(2):E362–E373. - PMC - PubMed
    1. Tsakiridis T., Vranic M., Klip A. Disassembly of the actin network inhibits insulin-dependent stimulation of glucose transport and prevents recruitment of glucose transporters to the plasma membrane. J Biol Chem. 1994;269(47):29934–29942. - PubMed
    1. Omata W., Shibata H., Li L., Takata K., Kojima I. Actin filaments play a critical role in insulin-induced exocytotic recruitment but not in endocytosis of GLUT4 in isolated rat adipocytes. Biochem J. 2000;346(Pt 2):321–328. - PMC - PubMed
    1. Tong P., Khayat Z.A., Huang C., Patel N., Ueyama A., Klip A. Insulin-induced cortical actin remodeling promotes GLUT4 insertion at muscle cell membrane ruffles. J Clin Invest. 2001;108(3):371–381. - PMC - PubMed

Publication types