

Deep fiber clustering: Anatomically informed fiber clustering with self-supervised deep learning for fast and effective tractography parcellation
- PMID: 37019346
- PMCID: PMC10958986
- DOI: 10.1016/j.neuroimage.2023.120086
Deep fiber clustering: Anatomically informed fiber clustering with self-supervised deep learning for fast and effective tractography parcellation
Abstract
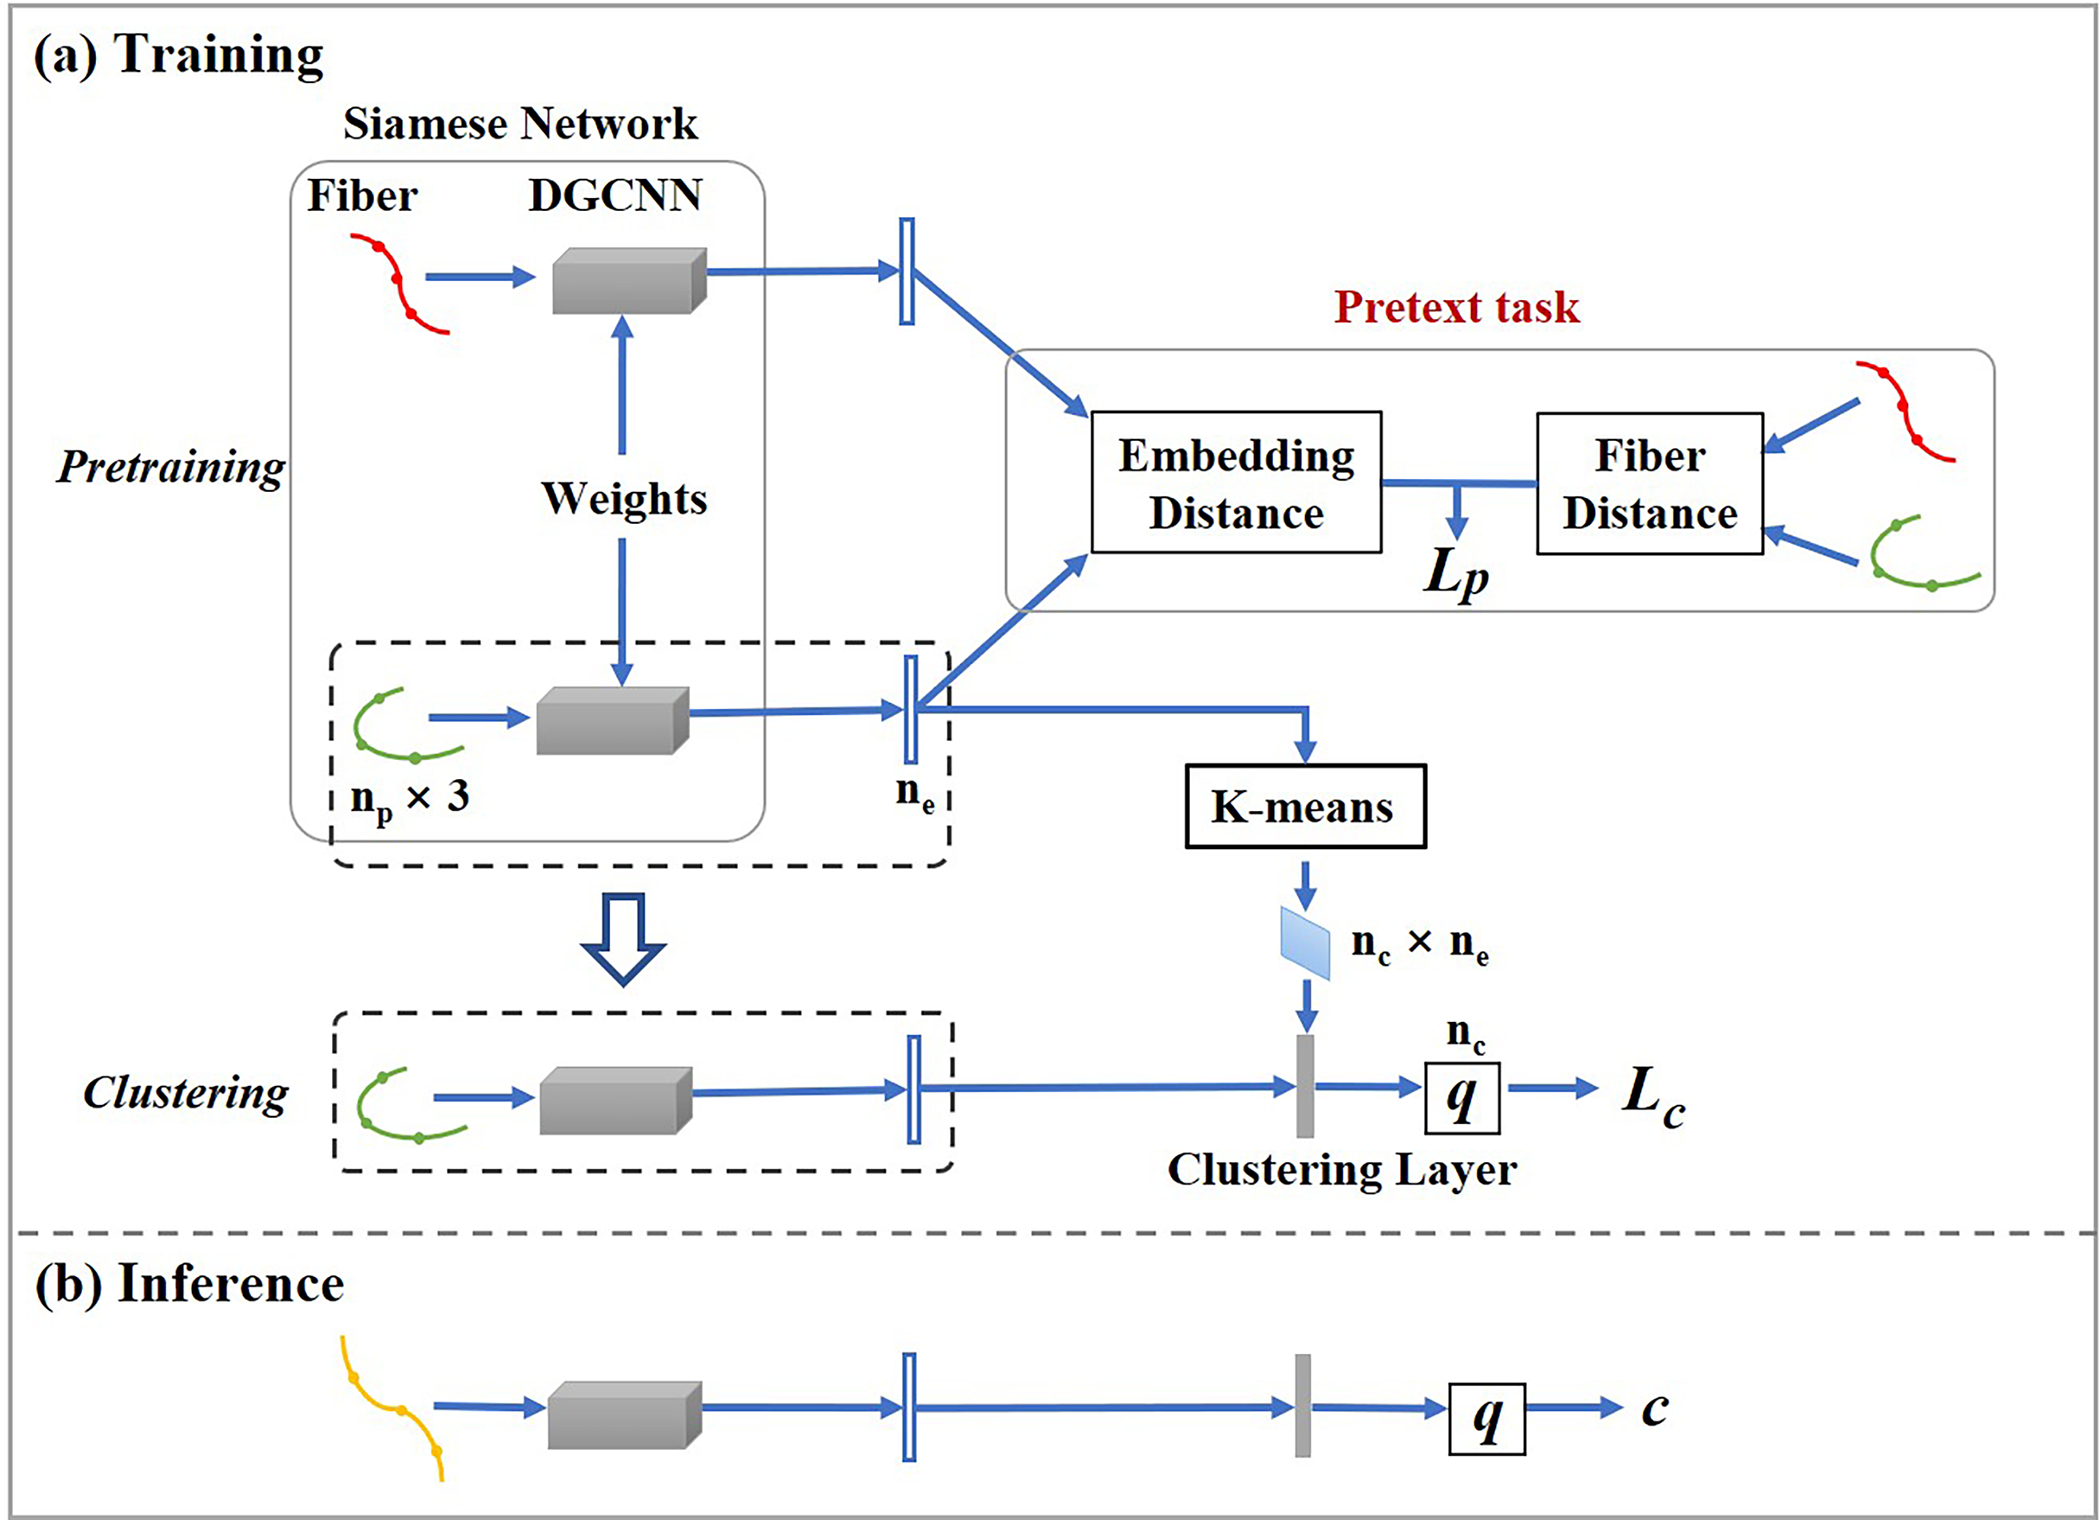
White matter fiber clustering is an important strategy for white matter parcellation, which enables quantitative analysis of brain connections in health and disease. In combination with expert neuroanatomical labeling, data-driven white matter fiber clustering is a powerful tool for creating atlases that can model white matter anatomy across individuals. While widely used fiber clustering approaches have shown good performance using classical unsupervised machine learning techniques, recent advances in deep learning reveal a promising direction toward fast and effective fiber clustering. In this work, we propose a novel deep learning framework for white matter fiber clustering, Deep Fiber Clustering (DFC), which solves the unsupervised clustering problem as a self-supervised learning task with a domain-specific pretext task to predict pairwise fiber distances. This process learns a high-dimensional embedding feature representation for each fiber, regardless of the order of fiber points reconstructed during tractography. We design a novel network architecture that represents input fibers as point clouds and allows the incorporation of additional sources of input information from gray matter parcellation. Thus, DFC makes use of combined information about white matter fiber geometry and gray matter anatomy to improve the anatomical coherence of fiber clusters. In addition, DFC conducts outlier removal naturally by rejecting fibers with low cluster assignment probability. We evaluate DFC on three independently acquired cohorts, including data from 220 individuals across genders, ages (young and elderly adults), and different health conditions (healthy control and multiple neuropsychiatric disorders). We compare DFC to several state-of-the-art white matter fiber clustering algorithms. Experimental results demonstrate superior performance of DFC in terms of cluster compactness, generalization ability, anatomical coherence, and computational efficiency.
Keywords: Deep learning,; Fiber clustering; Image diffusion MRI; Self-supervised learning; Tractography.
Copyright © 2023. Published by Elsevier Inc.
Conflict of interest statement
Declaration of Competing Interest None.
Figures


Similar articles
-
Superficial white matter analysis: An efficient point-cloud-based deep learning framework with supervised contrastive learning for consistent tractography parcellation across populations and dMRI acquisitions.Med Image Anal. 2023 Apr;85:102759. doi: 10.1016/j.media.2023.102759. Epub 2023 Jan 23. Med Image Anal. 2023. PMID: 36706638 Free PMC article.
-
An anatomically curated fiber clustering white matter atlas for consistent white matter tract parcellation across the lifespan.Neuroimage. 2018 Oct 1;179:429-447. doi: 10.1016/j.neuroimage.2018.06.027. Epub 2018 Jun 18. Neuroimage. 2018. PMID: 29920375 Free PMC article.
-
Test-retest reproducibility of white matter parcellation using diffusion MRI tractography fiber clustering.Hum Brain Mapp. 2019 Jul;40(10):3041-3057. doi: 10.1002/hbm.24579. Epub 2019 Mar 15. Hum Brain Mapp. 2019. PMID: 30875144 Free PMC article.
-
The Shape of the Brain's Connections Is Predictive of Cognitive Performance: An Explainable Machine Learning Study.Hum Brain Mapp. 2025 Apr 1;46(5):e70166. doi: 10.1002/hbm.70166. Hum Brain Mapp. 2025. PMID: 40143640 Free PMC article. Review.
-
Deep Learning Methods for Identification of White Matter Fiber Tracts: Review of State-of-the-Art and Future Prospective.Neuroinformatics. 2023 Jul;21(3):517-548. doi: 10.1007/s12021-023-09636-4. Epub 2023 Jun 17. Neuroinformatics. 2023. PMID: 37328715 Review.
Cited by
-
Think deep in the tractography game: deep learning for tractography computing and analysis.Brain Struct Funct. 2025 Jun 16;230(6):100. doi: 10.1007/s00429-025-02938-0. Brain Struct Funct. 2025. PMID: 40522497 Review.
-
Superficial white matter analysis: An efficient point-cloud-based deep learning framework with supervised contrastive learning for consistent tractography parcellation across populations and dMRI acquisitions.Med Image Anal. 2023 Apr;85:102759. doi: 10.1016/j.media.2023.102759. Epub 2023 Jan 23. Med Image Anal. 2023. PMID: 36706638 Free PMC article.
-
TractCloud-FOV: Deep Learning-Based Robust Tractography Parcellation in Diffusion MRI With Incomplete Field of View.Hum Brain Mapp. 2025 Apr 1;46(5):e70201. doi: 10.1002/hbm.70201. Hum Brain Mapp. 2025. PMID: 40193105 Free PMC article.
-
A review on learning-based algorithms for tractography and human brain white matter tracts recognition.Neuroradiology. 2025 Jun 4. doi: 10.1007/s00234-025-03637-7. Online ahead of print. Neuroradiology. 2025. PMID: 40464927 Review.
-
Phybers: a package for brain tractography analysis.Front Neurosci. 2024 Mar 11;18:1333243. doi: 10.3389/fnins.2024.1333243. eCollection 2024. Front Neurosci. 2024. PMID: 38529266 Free PMC article.
References
-
- Astolfi P, Verhagen R, Petit L, Olivetti E, Masci J, Boscaini D, Avesani P, 2020. Tractogram Filtering of Anatomically Non-Plausible Fibers with Geometric Deep Learning, in: Medical Image Computing and Computer Assisted Intervention – MICCAI 2020. Springer International Publishing, pp. 291–301.
-
- Avants BB, Tustison N, Song G, 2009. Advanced normalization tools (ANTS). Insight J. 2, 1–35.
-
- Basser PJ, Pajevic S, Pierpaoli C, Duda J, Aldroubi A, 2000. In vivo fiber tractography using DT-MRI data. Magn. Reson. Med. 44, 625–632. - PubMed
-
- Battocchio M, Schiavi S, Descoteaux M, Daducci A, 2022. Bundle-o-graphy: improving structural connectivity estimation with adaptive microstructure-informed tractography. Neuroimage 263, 119600. - PubMed
Publication types
MeSH terms
Grants and funding
LinkOut - more resources
Full Text Sources
