

Integrative Proteomics and N-Glycoproteomics Analyses of Rheumatoid Arthritis Synovium Reveal Immune-Associated Glycopeptides
- PMID: 37019382
- PMCID: PMC10176071
- DOI: 10.1016/j.mcpro.2023.100540
Integrative Proteomics and N-Glycoproteomics Analyses of Rheumatoid Arthritis Synovium Reveal Immune-Associated Glycopeptides
Abstract
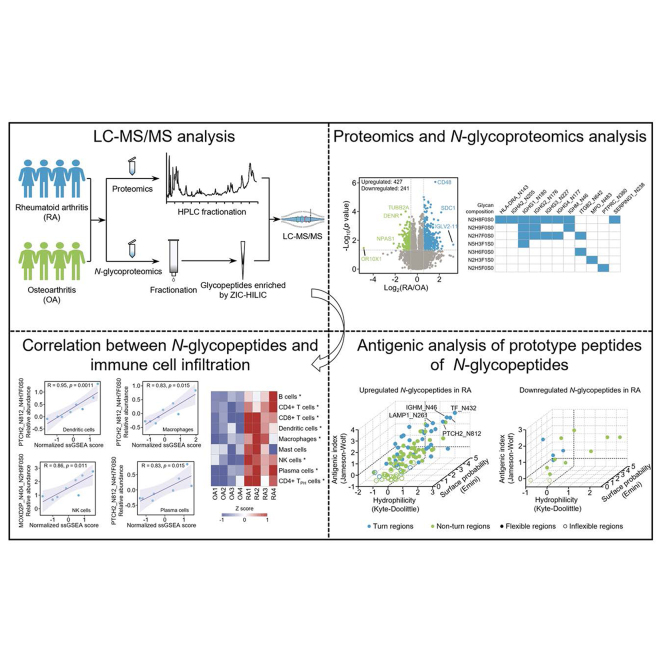
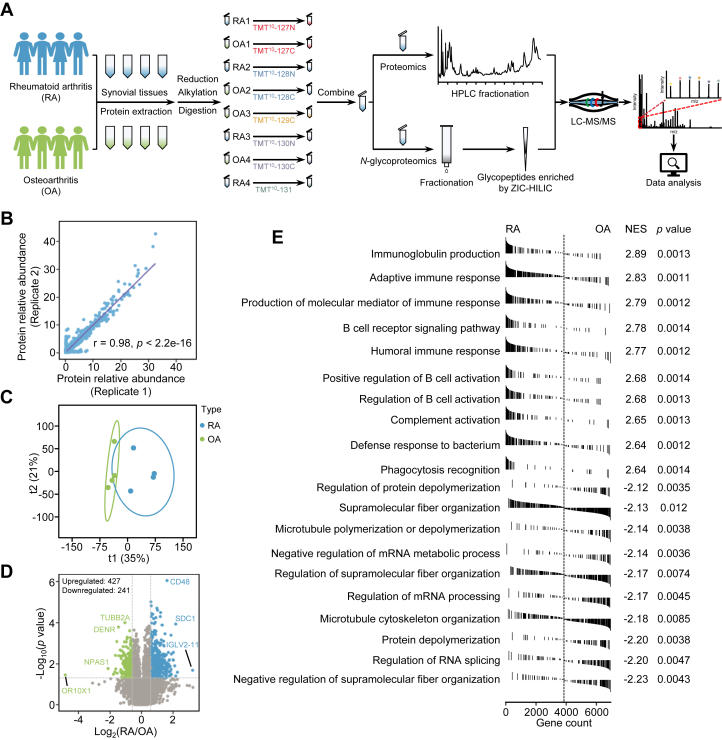
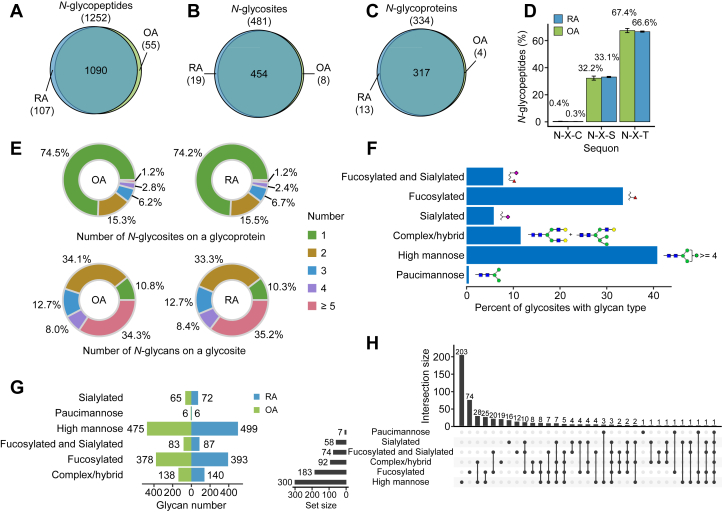
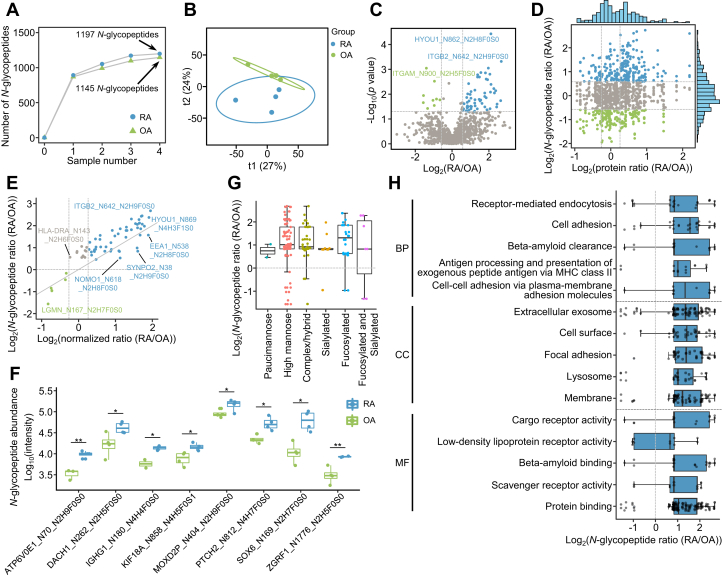
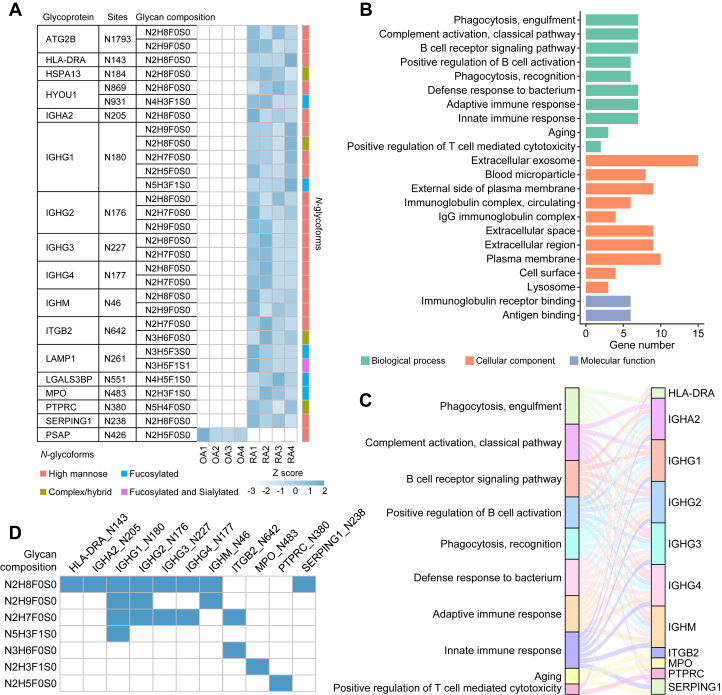
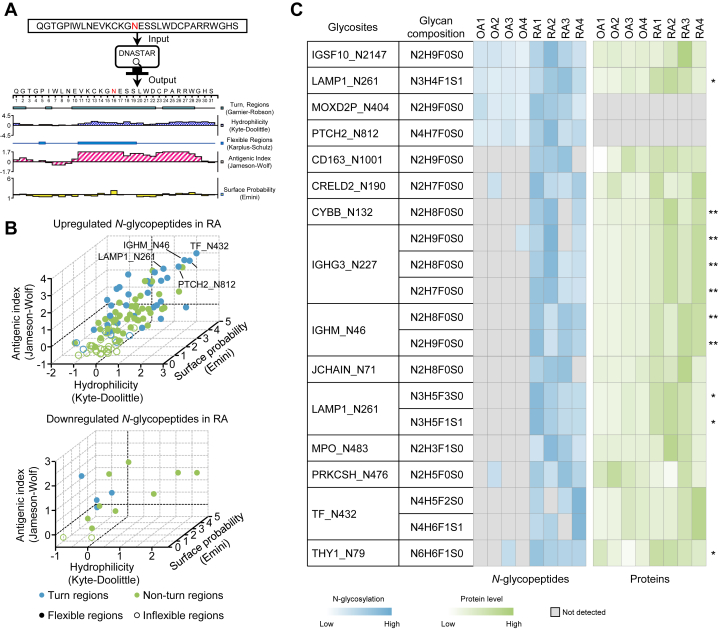
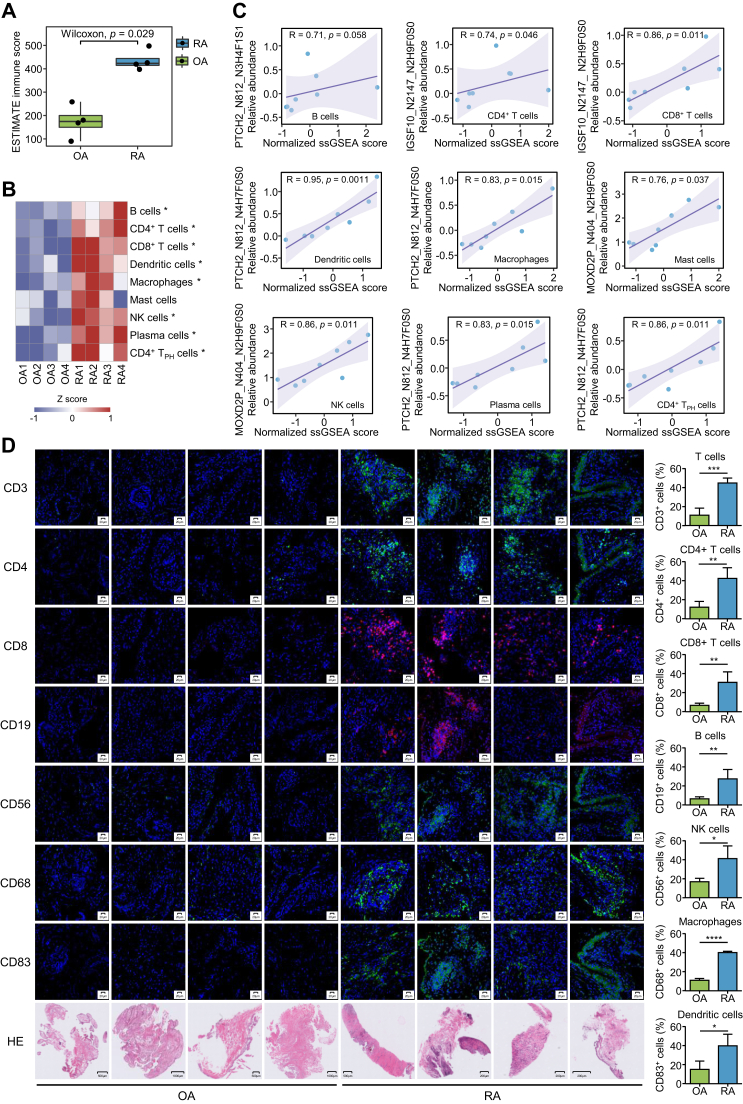
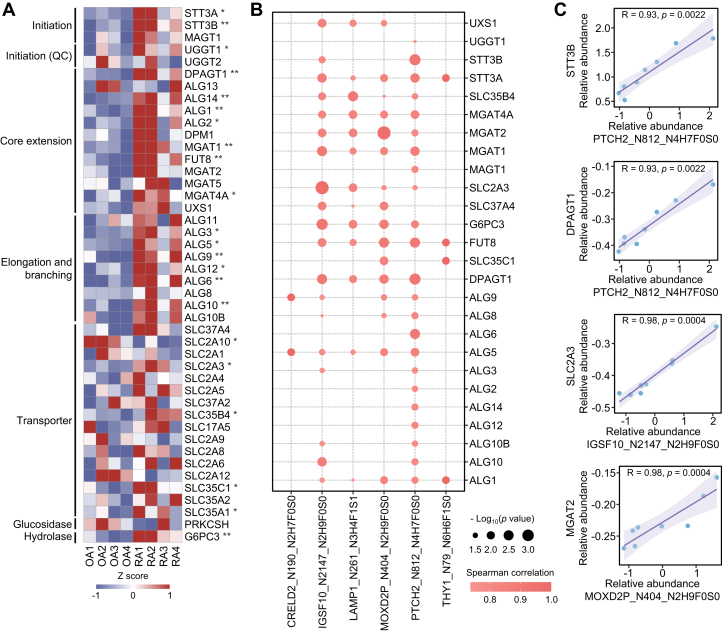
Rheumatoid arthritis (RA) is a typical autoimmune disease characterized by synovial inflammation, synovial tissue hyperplasia, and destruction of bone and cartilage. Protein glycosylation plays key roles in the pathogenesis of RA but in-depth glycoproteomics analysis of synovial tissues is still lacking. Here, by using a strategy to quantify intact N-glycopeptides, we identified 1260 intact N-glycopeptides from 481 N-glycosites on 334 glycoproteins in RA synovium. Bioinformatics analysis revealed that the hyper-glycosylated proteins in RA were closely linked to immune responses. By using DNASTAR software, we identified 20 N-glycopeptides whose prototype peptides were highly immunogenic. We next calculated the enrichment scores of nine types of immune cells using specific gene sets from public single-cell transcriptomics data of RA and revealed that the N-glycosylation levels at some sites, such as IGSF10_N2147, MOXD2P_N404, and PTCH2_N812, were significantly correlated with the enrichment scores of certain immune cell types. Furthermore, we showed that aberrant N-glycosylation in the RA synovium was related to increased expression of glycosylation enzymes. Collectively, this work presents, for the first time, the N-glycoproteome of RA synovium and describes immune-associated glycosylation, providing novel insights into RA pathogenesis.
Keywords: N-glycoproteomics; immune cell infiltration; protein glycosylation; rheumatoid arthritis; synovium.
Copyright © 2023 The Authors. Published by Elsevier Inc. All rights reserved.
Conflict of interest statement
Conflict of interest The authors declare no competing interests.
Figures
Similar articles
-
[A large-scale method for the enrichment and identification of N-glycopeptides in microscale plasma samples].Se Pu. 2025 Sep;43(9):996-1004. doi: 10.3724/SP.J.1123.2025.04004. Se Pu. 2025. PMID: 40910306 Chinese.
-
Synovial infiltrating immune cell heterogeneity associated with synovitis severity and systemic disease activity in rheumatoid arthritis: a cross-sectional study.Clin Rheumatol. 2025 Sep;44(9):3487-3495. doi: 10.1007/s10067-025-07565-y. Epub 2025 Jul 30. Clin Rheumatol. 2025. PMID: 40739375
-
Core autophagy genes and immune infiltration characteristics in rheumatoid arthritis: A bioinformatics study.PLoS One. 2025 Jul 11;20(7):e0326168. doi: 10.1371/journal.pone.0326168. eCollection 2025. PLoS One. 2025. PMID: 40644421 Free PMC article.
-
Balneotherapy (or spa therapy) for rheumatoid arthritis.Cochrane Database Syst Rev. 2015 Apr 11;2015(4):CD000518. doi: 10.1002/14651858.CD000518.pub2. Cochrane Database Syst Rev. 2015. PMID: 25862243 Free PMC article.
-
Biologics or tofacitinib for people with rheumatoid arthritis naive to methotrexate: a systematic review and network meta-analysis.Cochrane Database Syst Rev. 2017 May 8;5(5):CD012657. doi: 10.1002/14651858.CD012657. Cochrane Database Syst Rev. 2017. PMID: 28481462 Free PMC article.
Cited by
-
Immunopeptidomics for autoimmunity: unlocking the chamber of immune secrets.NPJ Syst Biol Appl. 2025 Jan 17;11(1):10. doi: 10.1038/s41540-024-00482-x. NPJ Syst Biol Appl. 2025. PMID: 39833247 Free PMC article. Review.
-
Protein posttranslational modifications in health and diseases: Functions, regulatory mechanisms, and therapeutic implications.MedComm (2020). 2023 May 2;4(3):e261. doi: 10.1002/mco2.261. eCollection 2023 Jun. MedComm (2020). 2023. PMID: 37143582 Free PMC article. Review.
-
A longitudinal cohort study uncovers plasma protein biomarkers predating clinical onset and treatment response of rheumatoid arthritis.Nat Commun. 2025 Jul 21;16(1):6692. doi: 10.1038/s41467-025-62032-1. Nat Commun. 2025. PMID: 40691443 Free PMC article.
-
Optimization of glycopeptide enrichment techniques for the identification of clinical biomarkers.Expert Rev Proteomics. 2024 Nov;21(11):431-462. doi: 10.1080/14789450.2024.2418491. Epub 2024 Oct 31. Expert Rev Proteomics. 2024. PMID: 39439029 Review.
-
Immunoglobulin A carries sulfated and O-acetylated N-glycans primarily at the tailpiece site - strategies for site-specific N-glycan identification.Front Mol Biosci. 2025 Aug 1;12:1595173. doi: 10.3389/fmolb.2025.1595173. eCollection 2025. Front Mol Biosci. 2025. PMID: 40821702 Free PMC article.
References
-
- Malmstrom V., Catrina A.I., Klareskog L. The immunopathogenesis of seropositive rheumatoid arthritis: from triggering to targeting. Nat. Rev. Immunol. 2017;17:60–75. - PubMed
-
- Scherer H.U., Haupl T., Burmester G.R. The etiology of rheumatoid arthritis. J. Autoimmun. 2020;110:102400. - PubMed
-
- Smolen J.S., Aletaha D., McInnes I.B. Rheumatoid arthritis. Lancet. 2016;388:2023–2038. - PubMed
-
- Kissel T., van Schie K.A., Hafkenscheid L., Lundquist A., Kokkonen H., Wuhrer M., et al. On the presence of HLA-SE alleles and ACPA-IgG variable domain glycosylation in the phase preceding the development of rheumatoid arthritis. Ann. Rheum. Dis. 2019;78:1616–1620. - PubMed
-
- Conigliaro P., Triggianese P., De Martino E., Fonti G.L., Chimenti M.S., Sunzini F., et al. Challenges in the treatment of rheumatoid arthritis. Autoimmun. Rev. 2019;18:706–713. - PubMed
Publication types
MeSH terms
Substances
LinkOut - more resources
Full Text Sources
Medical
