. 2023 Apr 26;23(8):3217-3223.
doi: 10.1021/acs.nanolett.2c05053. Epub 2023 Apr 5.

Passive Recording of Bioelectrical Signals from Non-Excitable Cells by Fluorescent Mirroring

Affiliations

Passive Recording of Bioelectrical Signals from Non-Excitable Cells by Fluorescent Mirroring

Rosalia Moreddu et al. Nano Lett. .

Abstract

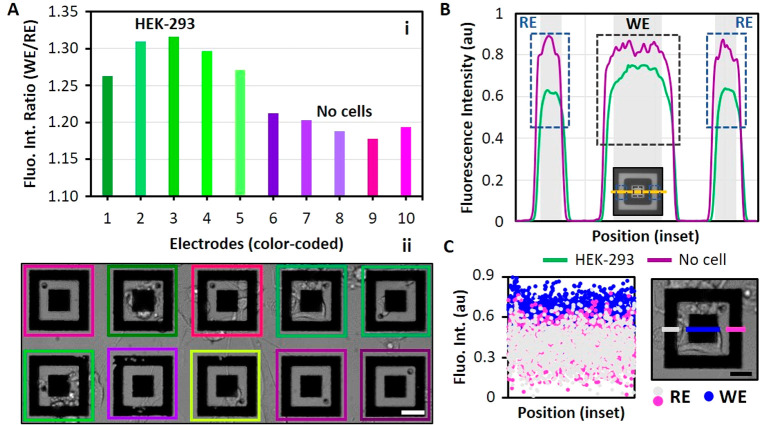
Bioelectrical variations trigger different cell responses, including migration, mitosis, and mutation. At the tissue level, these actions result in phenomena such as wound healing, proliferation, and pathogenesis. Monitoring these mechanisms dynamically is highly desirable in diagnostics and drug testing. However, existing technologies are invasive: either they require physical access to the intracellular compartments, or they imply direct contact with the cellular medium. Here, we present a novel approach for the passive recording of electrical signals from non-excitable cells adhering to 3D microelectrodes, based on optical mirroring. Preliminary results yielded a fluorescence intensity output increase of the 5,8% in the presence of a HEK-293 cell on the electrode compared to bare microelectrodes. At present, this technology may be employed to evaluate cell-substrate adhesion and monitor cell proliferation. Further refinements could allow extrapolating quantitative data on surface charges and resting potential to investigate the electrical phenomena involved in cell migration and cancer progression.

Keywords: HEK-293; bioelectricity; cell−surface adhesion; fluorescence; non−excitable cells.


Conflict of interest statement

The authors declare no competing financial interest.

Figures

Figure 1
Figure 1
Working principle of the nanoplatform. (A) Schematic of the device physics when in contact with a cell. The suspended membrane (gray layer) defines two areas: the area located above is termed the biological chamber, where cells are cultivated, and the area below is the optical chamber, hosting the fluorophores dispersion. The high-density electrode matrix manufactured at the membrane consists of individual electrode systems, each comprising a pass-through structure (working electrode, WE) where the cell signal (EDLcell) comes from and a surrounding planar structure (reference electrode, RE), which serves as the background signal (EDLbg). Charged fluorophores migrate within the optical chamber and sit at the electrical double layer, generating a static signal in accordance with the cell charge. (B) Fluorescent emission triggered by exciting the optical dispersion allows to record the mirrored signal with a confocal microscope. Multiple spots allow the simultaneous recording from different areas of the sample, each of about 120 μm.
Figure 2
Figure 2
Finite element modeling of the charge mirroring at the electrical double layer. (A) Schematic of the simulated geometry. The linear system comprises cell (intracellular fluid and cellular membrane), electrode (gold), and dispersion (rhodamine fluorophores in ethylene glycol). The permittivity ε and height h are indicated for each of the assigned materials. (B) Electric potential distribution over the linear geometry in contact with a cell having potential Vcell in the range from −10 to −50 mV at steps of 10 mV. The case Vcell = 0 allows to observe the electrical double layer in the absence of cells on the electrode. The inset shows a zoom-in of (B) at the segment D–E (electrode–dispersion interface). (C) Rhodamine concentration-dependent charge density at the Au–dispersion interface as a function of the cell potential. The charge density at the electrical double layer increases for larger (more negative) cell potentials. At Vcell = 0, the non-null charge density indicates the intrinsic electrical double layer (background signal). The concentration is taken as C/Cbulk, where Cbulk is the concentration used in this work. (D) Representation of the setup implemented to validate the functionality of the device. The 3D electrodes were polarized from the top chamber with an electrode immersed in the electrolyte (cell medium). (E) Cell-less results obtained with the setup displayed in (D) for a sample working electrode (i) and its optical reference (ii).
Figure 3
Figure 3
Images of the nanoplatform. (A) Photographs of the device as seen from the side and from the top. The silicon chip holds a Si3N4 membrane located at the center, over which a glass cylinder is bonded to allow cell culturing over the membrane. Scale bars: 5 mm. (B) Optical microscopy image of the suspended membrane (orange) with patterned planar electrodes, as seen from the optical chamber (bottom). The inset shows zoomed-in planar electrodes. Scale bars: 120 μm (main) and 100 μm (inset). (C) Bright and dark field images of a pair of planar electrodes. The central square (working electrode) is physically connected with the 3D microelectrodes located on the top side of the suspended membrane. The surrounding hollow square (reference electrode) only interfaces with the optical chamber. Scale bars: 30 μm. (D) Matrix of nanoholes drilled through the suspended membrane, prior to gold electrodeposition. The inset shows a zoom-in of a hole. Scale bars: 2 μm (main) and 200 nm (inset). (E) Array of 3D microelectrodes obtained by galvanic growth of gold through the nanoholes. Scale bars: 2 μm (main) and 500 nm (inset).
Figure 4
Figure 4
Fluorescence recording from an electrode matrix. (A) The bar graph (i) presents the fluorescence intensity ratio between the signal recorded in the working electrode and its reference. Electrodes are color-coded (ii) according to their state (green scale: working electrodes in contact with a HEK cell; purple scale: bare working electrodes). Scale bar: 30 μm. (B) Line graph across a horizontal section of each electrode. The section is highlighted in yellow in the inset image. The two lateral peaks refer to the segments falling into the reference electrode area (RE, RE), and the central larger peak refers to the working electrode (WE). The curves follow the color code in (A). Scale bar: 30 μm. (C) Sample recording in different areas of a planar electrode comprising RE and WE. The scatter plot indicates the absolute fluorescence intensity recorded in left RE (gray), WE (blue), and right RE (pink), as displayed in the image. Scale bar: 25 μm.
Figure 5
Figure 5
Statistical results on the fluorescence intensity recorded from electrode systems in contact with HEK-293 cells compared to bare electrodes. (A) Representative image of an electrode pair under illumination with white light and under fluorescent emission, as seen from the optical chamber. The electrode at the left is in direct contact with a HEK-293 cell, and the electrode at the right faces the cell medium. Scale bars: 35 μm. (B) Distribution and rug plots indicating the frequency of occurrence of the fluorescence intensity ratio WE/RE values in electrodes contacted with HEK-293 cells compared with bare electrodes. The gray area displays the average fluorescence shift based on the experimental data from 280 electrodes. The rug plot at the bottom helps to visualize the distribution. C, D) Probability plots of the fluorescence emitted from electrodes coupled with a cell (C) and bare electrodes (D). It is possible to notice that in both cases the empirical values resemble the theoretical values, and hence the data follow a normal distribution.

References

    1. Bruno G.; Melle G.; Barbaglia A.; Iachetta G.; Melikov R.; Perrone M.; Dipalo M.; De Angelis F. All-Optical and Label-Free Stimulation of Action Potentials in Neurons and Cardiomyocytes by Plasmonic Porous Metamaterials. Adv. Sci. 2021, 8 (21), e2100627.10.1002/advs.202100627. - DOI - PMC - PubMed
    1. Cui B. X.; Jahed Z.; Yang Y.; Tsai C. T. Intracellular recording of cardiac action potentials via membrane electroporation. Biophys. J. 2022, 121 (3), 304a.10.1016/j.bpj.2021.11.1241. - DOI
    1. Li T. L.; Liu Y.; Forro C.; Yang X.; Beker L.; Bao Z.; Cui B.; Pasca S. P. Stretchable mesh microelectronics for the biointegration and stimulation of human neural organoids. Biomaterials 2022, 290, 121825.10.1016/j.biomaterials.2022.121825. - DOI - PMC - PubMed
    1. Dipalo M.; Rastogi S. K.; Matino L.; Garg R.; Bliley J.; Iachetta G.; Melle G.; Shrestha R.; Shen S.; Santoro F.; et al. Intracellular action potential recordings from cardiomyocytes by ultrafast pulsed laser irradiation of fuzzy graphene microelectrodes. Sci. Adv. 2021, 7 (15), eadb5175.10.1126/sciadv.abd5175. - DOI - PMC - PubMed
    1. Cervera J.; Pai V. P.; Levin M.; Mafe S. From non-excitable single-cell to multicellular bioelectrical states supported by ion channels and gap junction proteins: Electrical potentials as distributed controllers. Prog. Biophys. Mol. Biol. 2019, 149, 39–53. 10.1016/j.pbiomolbio.2019.06.004. - DOI - PubMed

Publication types