. 2023 Apr 5:381:e071609.
doi: 10.1136/bmj-2022-071609.

Dietary sugar consumption and health: umbrella review

Affiliations

Dietary sugar consumption and health: umbrella review

Yin Huang et al. BMJ. .

Abstract

Objective: To evaluate the quality of evidence, potential biases, and validity of all available studies on dietary sugar consumption and health outcomes.

Design: Umbrella review of existing meta-analyses.

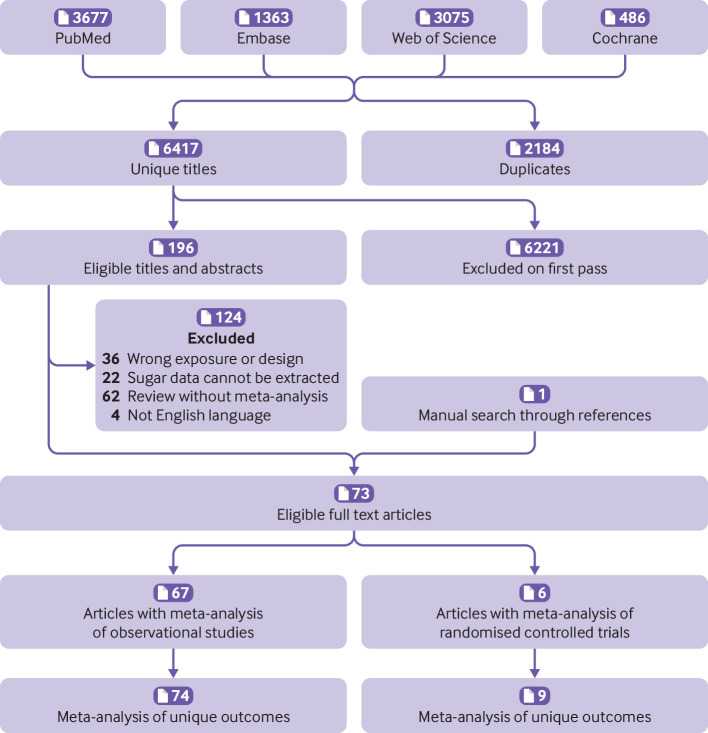
Data sources: PubMed, Embase, Web of Science, Cochrane Database of Systematic Reviews, and hand searching of reference lists.

Inclusion criteria: Systematic reviews and meta-analyses of randomised controlled trials, cohort studies, case-control studies, or cross sectional studies that evaluated the effect of dietary sugar consumption on any health outcomes in humans free from acute or chronic diseases.

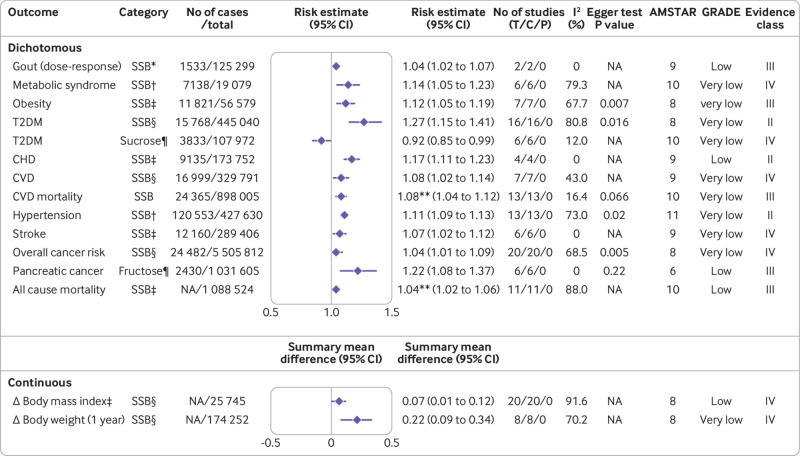
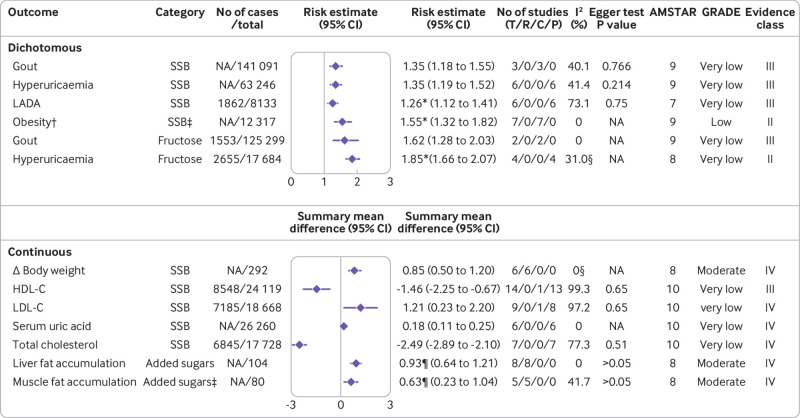
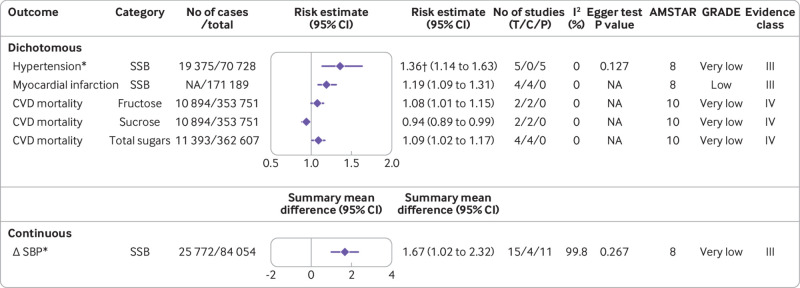
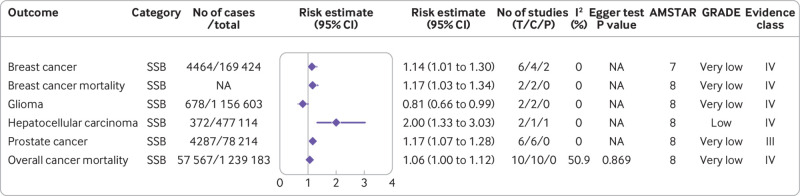
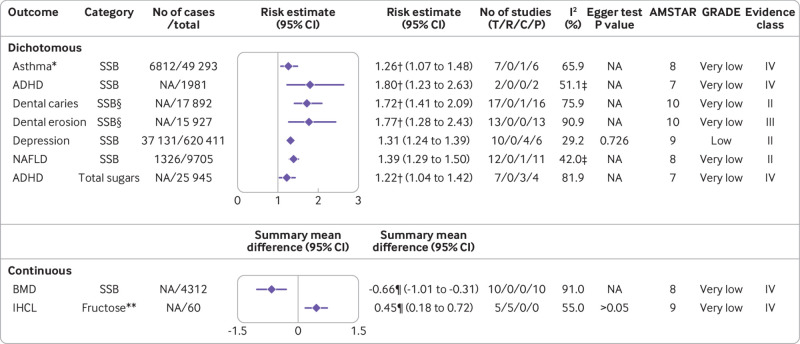
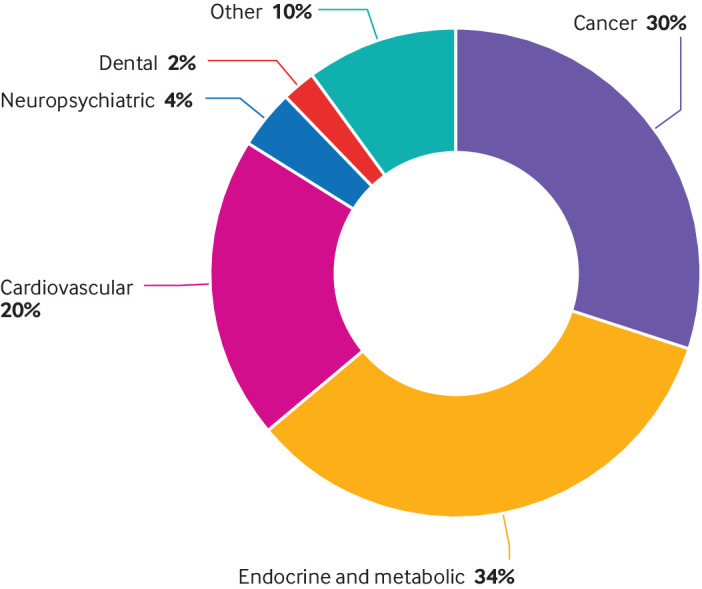
Results: The search identified 73 meta-analyses and 83 health outcomes from 8601 unique articles, including 74 unique outcomes in meta-analyses of observational studies and nine unique outcomes in meta-analyses of randomised controlled trials. Significant harmful associations between dietary sugar consumption and 18 endocrine/metabolic outcomes, 10 cardiovascular outcomes, seven cancer outcomes, and 10 other outcomes (neuropsychiatric, dental, hepatic, osteal, and allergic) were detected. Moderate quality evidence suggested that the highest versus lowest dietary sugar consumption was associated with increased body weight (sugar sweetened beverages) (class IV evidence) and ectopic fatty accumulation (added sugars) (class IV evidence). Low quality evidence indicated that each serving/week increment of sugar sweetened beverage consumption was associated with a 4% higher risk of gout (class III evidence) and each 250 mL/day increment of sugar sweetened beverage consumption was associated with a 17% and 4% higher risk of coronary heart disease (class II evidence) and all cause mortality (class III evidence), respectively. In addition, low quality evidence suggested that every 25 g/day increment of fructose consumption was associated with a 22% higher risk of pancreatic cancer (class III evidence).

Conclusions: High dietary sugar consumption is generally more harmful than beneficial for health, especially in cardiometabolic disease. Reducing the consumption of free sugars or added sugars to below 25 g/day (approximately 6 teaspoons/day) and limiting the consumption of sugar sweetened beverages to less than one serving/week (approximately 200-355 mL/week) are recommended to reduce the adverse effect of sugars on health.

Systematic review registration: PROSPERO CRD42022300982.


Conflict of interest statement

Competing interests: All authors have completed the ICMJE uniform disclosure form at www.icmje.org/disclosure-of-interest/ and declare: support from the National Natural Science Foundation of China and Program from the Department of Science and Technology of Sichuan Province for the submitted work; no financial relationship with any organisations that might have an interest in the submitted work in the previous three years; no other relationships or activities that could appear to have influenced the submitted work.

Figures

Fig 1
Fig 1
Flowchart of systematic search and selection process
Fig 2
Fig 2
Significant dose-response relations between dietary sugar consumption and multiple health outcomes. Estimates are relative risks, summary mean difference is weighted mean difference, and effect models are random unless noted otherwise. Δ=final value – baseline value; AMSTAR=a measurement tool to assess systematic reviews; C=cohort studies; CHD=coronary heart disease; CI=confidence interval; CVD=cardiovascular disease; GRADE=Grading of Recommendations Assessment, Development and Evaluation; NA=not available; P=population based case-control and/or cross sectional studies; SSB=sugar sweetened beverage; T=total No of studies; T2DM=type 2 diabetes mellitus. *1 serving/week increment. †355 mL/d increment. ‡250 mL/d increment. §1 serving/d increment. ¶25 g/d increment. **Hazard ratio. †Children
Fig 3
Fig 3
Significant non-dose-response relations between dietary sugar consumption and endocrine and metabolic outcomes. Comparisons are highest versus lowest, estimates are relative risks, summary mean difference is weighted mean difference, and effect models are random unless noted otherwise. Complete associations between dietary sugar consumption and endocrine and metabolic outcomes are shown in supplementary table A. Δ=final value – baseline value; AMSTAR=a measurement tool to assess systematic reviews; C=cohort studies; CI=confidence interval; GRADE=Grading of Recommendations Assessment, Development and Evaluation; HDL-C=high density lipoprotein cholesterol; LADA=latent autoimmune diabetes in adults; LDL-C=low density lipoprotein cholesterol; NA=not available; P=population based case-control and/or cross sectional studies; R=randomised controlled trials; SSB=sugar sweetened beverage; T=total No of studies. *Odds ratio. †Children. ‡Any versus none. §Fixed effects model. ¶Standardised mean difference
Fig 4
Fig 4
Significant non-dose-response relations between dietary sugar consumption and cardiovascular outcomes. Comparisons are highest versus lowest, estimates are relative risks, summary mean difference is weighted mean difference, and effect models are random unless noted otherwise. Complete associations between dietary sugar consumption and cardiovascular outcomes are shown in supplementary table B. Δ=final value – baseline value; AMSTAR=a measurement tool to assess systematic reviews; C=cohort studies; CI=confidence interval; CVD=cardiovascular disease; GRADE=Grading of Recommendations Assessment, Development and Evaluation; NA=not available; P=population based case-control and/or cross sectional studies; SBP=systolic blood pressure; SSB=sugar sweetened beverage; T=total No of studies. *Children and adolescents. †Odds ratio
Fig 5
Fig 5
Significant non-dose-response relations between dietary sugar consumption and cancer outcomes. Comparisons are highest versus lowest, estimates are relative risks, and effect models are random unless noted otherwise. Complete associations between dietary sugar consumption and cancer outcomes are shown in supplementary table C. AMSTAR=a measurement tool to assess systematic reviews; GRADE=Grading of Recommendations Assessment, Development and Evaluation; C=cohort studies; CI=confidence interval; NA=not available; P=population based case-control and/or cross sectional studies; SSB=sugar-sweetened beverage; T=total No of studies
Fig 6
Fig 6
Significant non-dose-response relations between dietary sugar consumption and other outcomes. Comparisons are highest versus lowest, estimates are relative risks, summary mean difference is weighted mean difference, and effect models are random unless noted otherwise. Complete associations between dietary sugar consumption and other outcomes are shown in supplementary table D. ADHD=attention deficit/hyperactivity disorder; AMSTAR=a measurement tool to assess systematic reviews; BMD=bone mineral density; C=cohort studies; CI=confidence interval; GRADE=Grading of Recommendations Assessment, Development and Evaluation; IHCL=intrahepatocellular lipids; NA=not available; NAFLD=non-alcoholic fatty liver disease; P=population based case-control and/or cross sectional studies; R=randomised controlled trials; SSB=sugar-sweetened beverage; T=total No of studies. *Children. †Odds ratio. ‡Fixed effects model. §Never/low versus moderate/high consumption. ¶Standardised mean difference. **Any versus none
Fig 7
Fig 7
Map of outcomes associated with dietary sugar consumption

Comment in

References

    1. Qin P, Li Q, Zhao Y, et al. . Sugar and artificially sweetened beverages and risk of obesity, type 2 diabetes mellitus, hypertension, and all-cause mortality: a dose-response meta-analysis of prospective cohort studies. Eur J Epidemiol 2020;35:655-71. 10.1007/s10654-020-00655-y - DOI - PubMed
    1. Ruanpeng D, Thongprayoon C, Cheungpasitporn W, Harindhanavudhi T. Sugar and artificially sweetened beverages linked to obesity: a systematic review and meta-analysis. QJM 2017;110:513-20. 10.1093/qjmed/hcx068 - DOI - PubMed
    1. Te Morenga L, Mallard S, Mann J. Dietary sugars and body weight: systematic review and meta-analyses of randomised controlled trials and cohort studies. BMJ 2012;346:e7492. 10.1136/bmj.e7492 - DOI - PubMed
    1. Malik VS, Popkin BM, Bray GA, Després JP, Willett WC, Hu FB. Sugar-sweetened beverages and risk of metabolic syndrome and type 2 diabetes: a meta-analysis. Diabetes Care 2010;33:2477-83. 10.2337/dc10-1079 - DOI - PMC - PubMed
    1. Imamura F, O’Connor L, Ye Z, et al. . Consumption of sugar sweetened beverages, artificially sweetened beverages, and fruit juice and incidence of type 2 diabetes: systematic review, meta-analysis, and estimation of population attributable fraction. BMJ 2015;351:h3576. 10.1136/bmj.h3576 - DOI - PMC - PubMed

Publication types