. 2023 Sep;72(9):1758-1773.
doi: 10.1136/gutjnl-2022-328364. Epub 2023 Apr 5.

Targeting PPAR-gamma counteracts tumour adaptation to immune-checkpoint blockade in hepatocellular carcinoma

Affiliations

Targeting PPAR-gamma counteracts tumour adaptation to immune-checkpoint blockade in hepatocellular carcinoma

Zhewen Xiong et al. Gut. 2023 Sep.

Abstract

Objective: Therapy-induced tumour microenvironment (TME) remodelling poses a major hurdle for cancer cure. As the majority of patients with hepatocellular carcinoma (HCC) exhibits primary or acquired resistance to antiprogrammed cell death (ligand)-1 (anti-PD-[L]1) therapies, we aimed to investigate the mechanisms underlying tumour adaptation to immune-checkpoint targeting.

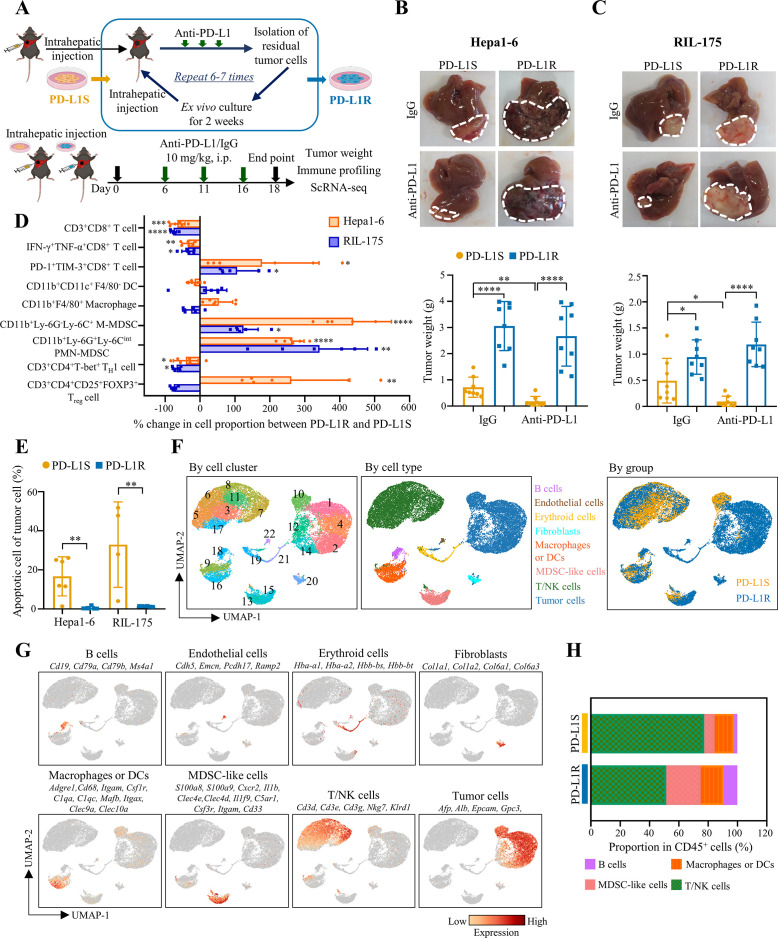
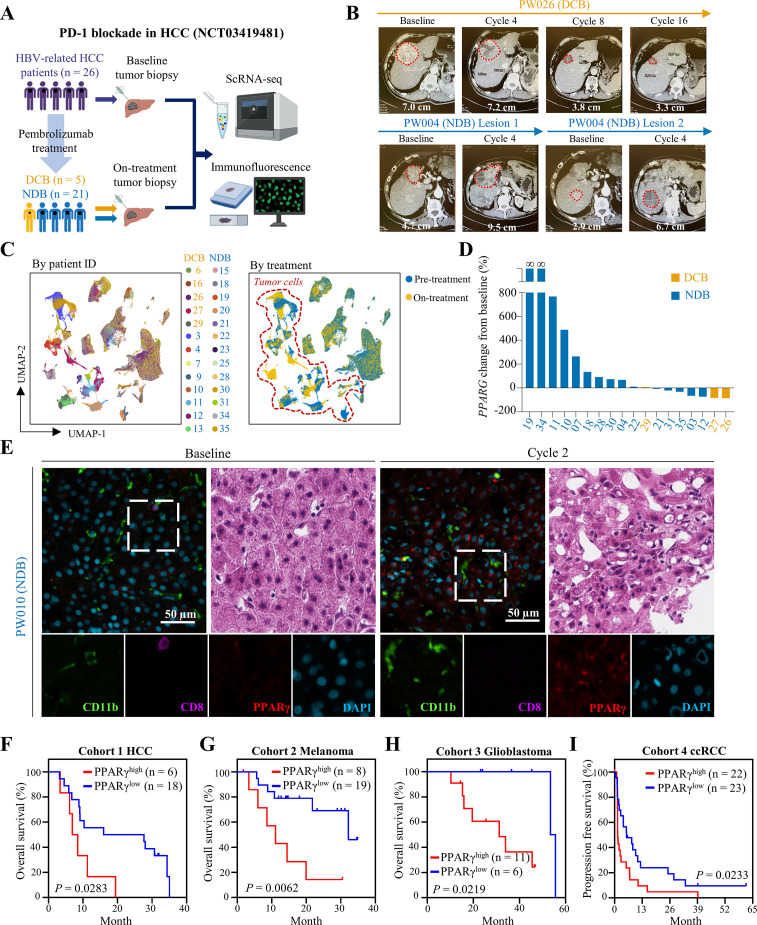
Design: Two immunotherapy-resistant HCC models were generated by serial orthotopic implantation of HCC cells through anti-PD-L1-treated syngeneic, immunocompetent mice and interrogated by single-cell RNA sequencing (scRNA-seq), genomic and immune profiling. Key signalling pathway was investigated by lentiviral-mediated knockdown and pharmacological inhibition, and further verified by scRNA-seq analysis of HCC tumour biopsies from a phase II trial of pembrolizumab (NCT03419481).

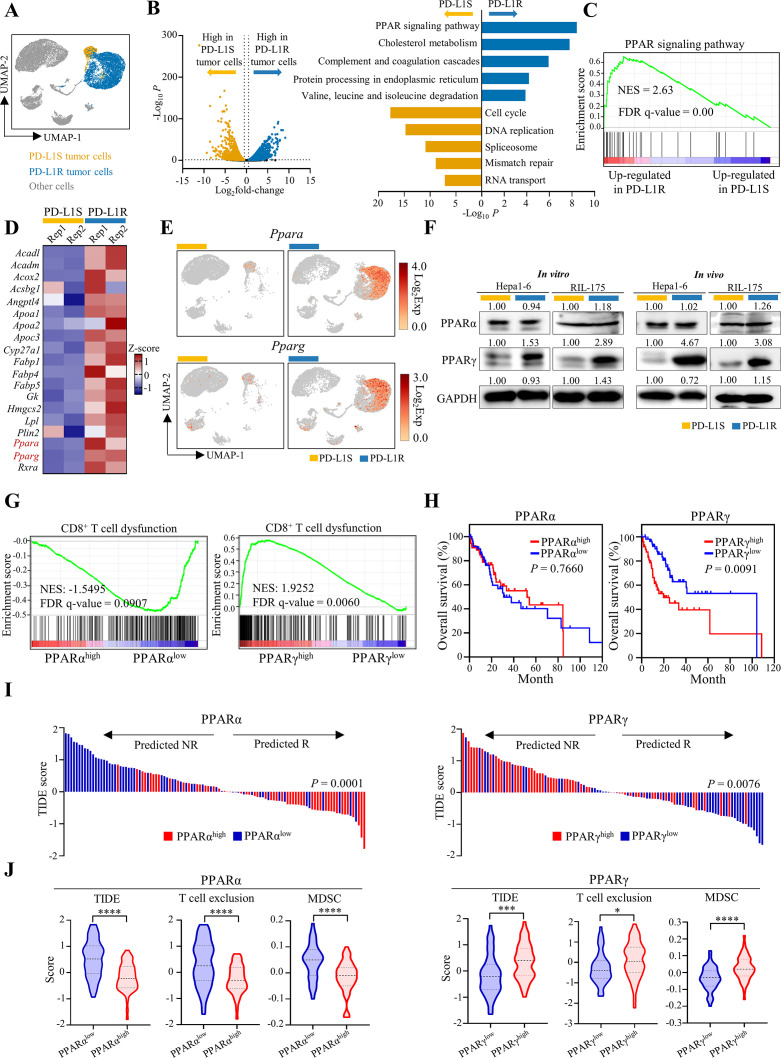
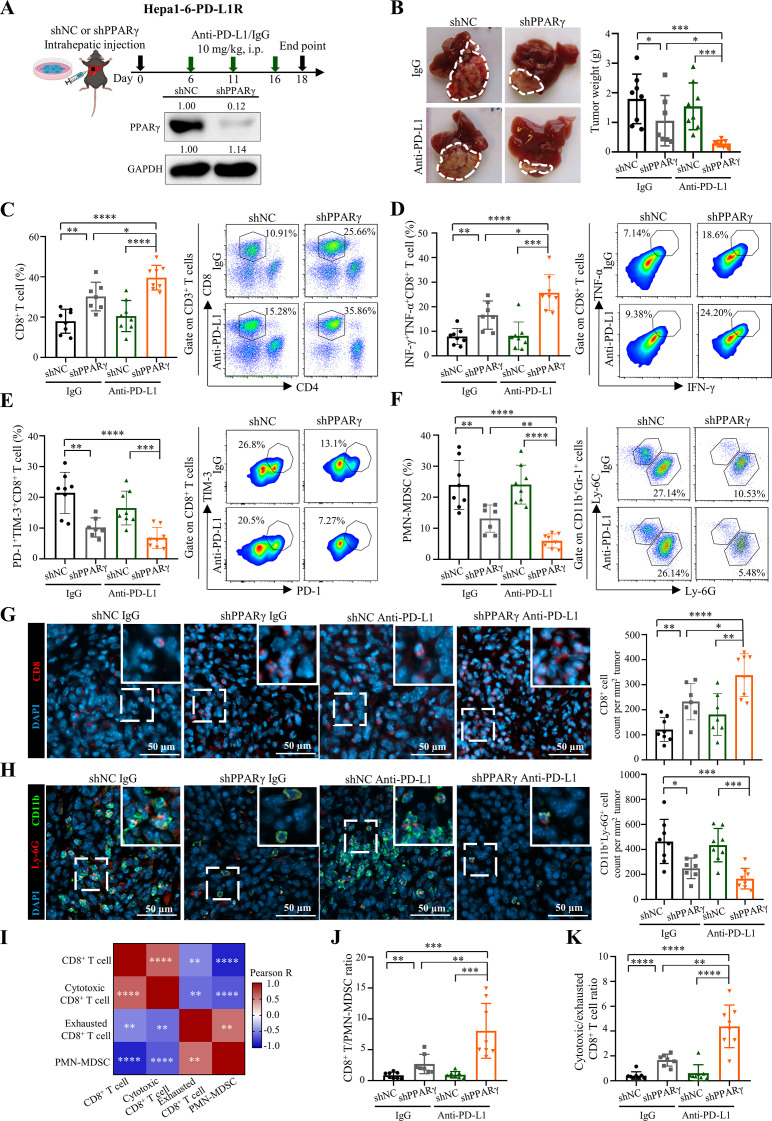
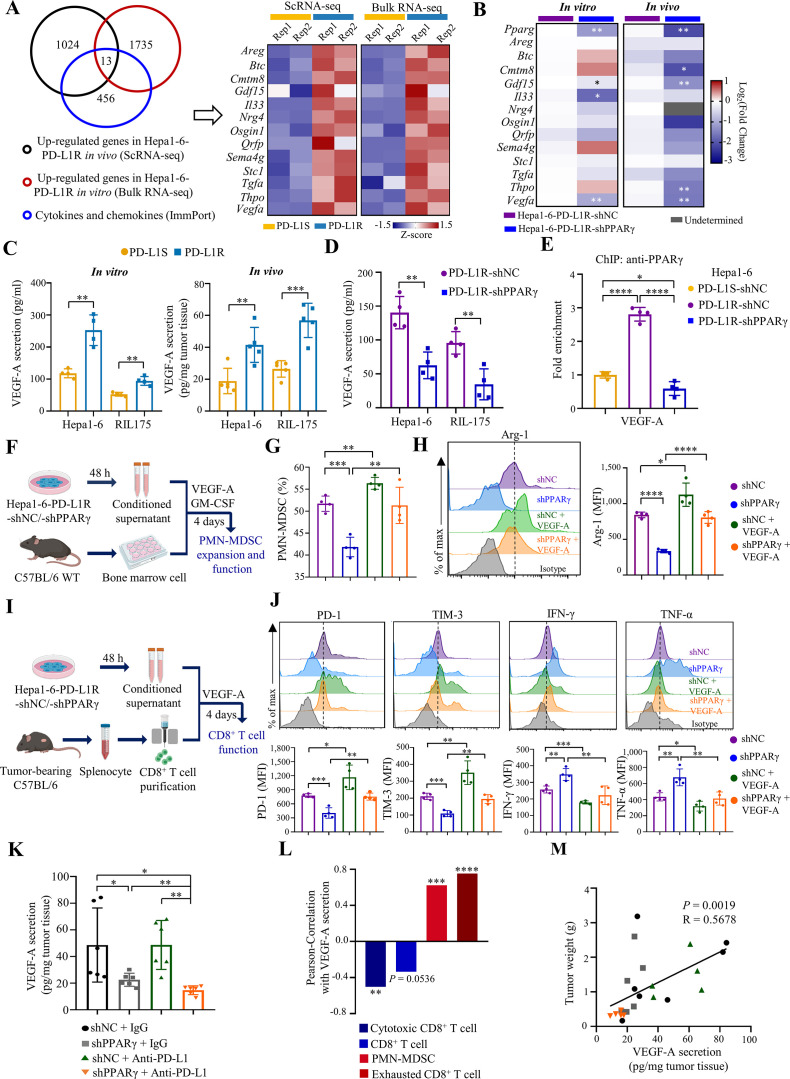
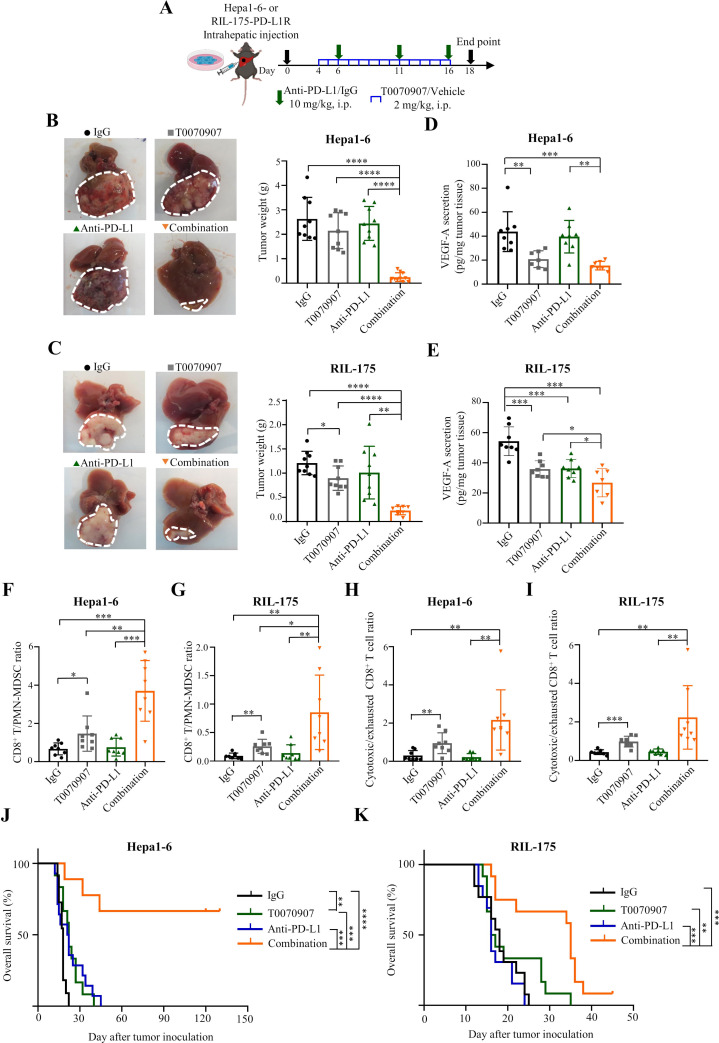
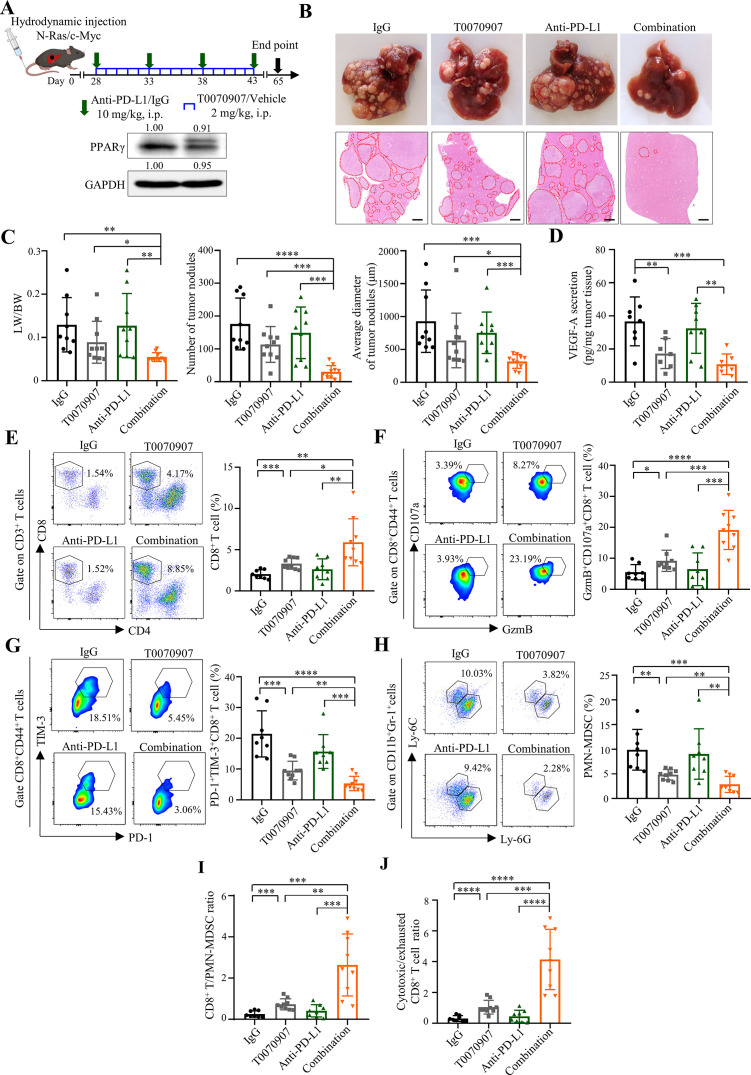
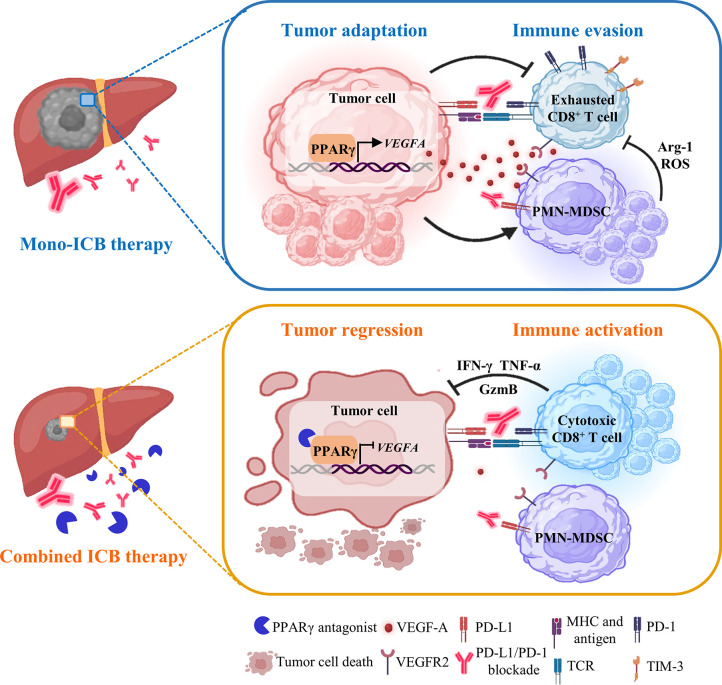
Results: Anti-PD-L1-resistant tumours grew >10-fold larger than parental tumours in immunocompetent but not immunocompromised mice without overt genetic changes, which were accompanied by intratumoral accumulation of myeloid-derived suppressor cells (MDSC), cytotoxic to exhausted CD8+ T cell conversion and exclusion. Mechanistically, tumour cell-intrinsic upregulation of peroxisome proliferator-activated receptor-gamma (PPARγ) transcriptionally activated vascular endothelial growth factor-A (VEGF-A) production to drive MDSC expansion and CD8+ T cell dysfunction. A selective PPARγ antagonist triggered an immune suppressive-to-stimulatory TME conversion and resensitised tumours to anti-PD-L1 therapy in orthotopic and spontaneous HCC models. Importantly, 40% (6/15) of patients with HCC resistant to pembrolizumab exhibited tumorous PPARγ induction. Moreover, higher baseline PPARγ expression was associated with poorer survival of anti-PD-(L)1-treated patients in multiple cancer types.

Conclusion: We uncover an adaptive transcriptional programme by which tumour cells evade immune-checkpoint targeting via PPARγ/VEGF-A-mediated TME immunosuppression, thus providing a strategy for counteracting immunotherapeutic resistance in HCC.

Keywords: CANCER IMMUNOBIOLOGY; HEPATOCELLULAR CARCINOMA; IMMUNOTHERAPY; PPAR GAMMA.


Conflict of interest statement

Competing interests: The authors declare no conflicts of interest that pertain to this work except the following declarations. YMDL is a scientific cofounder of Grail, receives royalties from Illumina, Grail, Sequenom, Xcelom, DRA and Take2, serves as a consultant to Decheng Capital and holds equity in Illumina/Grail, DRA and Take2. SLC serves as a consultant to and receives honoraria from Astra-Zeneca, Eisai and MSD.

Figures

Figure 1
Figure 1
HCC cells acquire immune evasion capability in ICB-resistant orthotopic mouse models. (A) Schematic diagram of establishment of ICB-resistant models. (B) Representative liver tumour photos and tumour weights of Hepa1-6-derived and (C) RIL-175-derived PD-L1S and PD-L1R tumours at the endpoint are shown (n=8). (D) Proportions of CD3+CD8+ T cells, CD11b+CD11c+F4/80- DCs, CD11b+F4/80+ macrophages, CD11b+Ly-6G-Ly-6C+ M-MDSCs, CD11b+Ly-6G+Ly-6Cint PMN-MDSCs, CD3+CD4+T-bet+ TH1 cells and CD3+CD4+CD25+FOXP3+ Treg cells in tumour-infiltrating CD45+ leucocytes, and IFN-γ+TNF-α+ cells and PD-1+TIM-3+ cells among tumour-infiltrating CD8+ T cells were determined by flow cytometry. Percentage changes of indicated immune cell proportions between anti-PD-L1-treated PD-L1R versus PD-L1S tumours from Hepa1-6 and RIL-175 models (n=4 to 6). (E) Percentages of apoptotic cells indicated by Annexin V+/PI+ in CD45- cells isolated from anti-PD-L1 treated tumours are shown (n=4 to 6). (F) ScRNA-seq analysis of anti-PD-L1-treated PD-L1S and PD-L1R tumours (n=2 per group) from Hepa1-6 orthotopic model. UMAP projection of 25 396 single cells isolated from tumour tissues, coloured by graph-based cell clusters, inferred cell types or experimental groups, respectively. (G) UMAP plots showing the mRNA expression and distribution of canonical markers for major cell types. Each cell was coloured based on normalised mRNA level of indicated genes. (H) Percentage of tumour-infiltrating immune populations identified in (F) is shown as mean in each group. Data represent as mean±SD. Statistical significance was determined by unpaired two-tailed Student’s t-test. *P<0.05; **p<0.01; ***p<0.001; ****p<0.0001. DC, dendritic cell; HCC, hepatocellular carcinoma; ICB, immune-checkpoint blockade; MDSC, myeloid-derived suppressor cell; PD-L1R, programmed death-1-ligand-1 resistant; PD-L1S, programmed death-1-ligand-1 sensitive; PMN, polymorphonuclear; UMAP, Uniform Manifold Approximation and Projection.
Figure 2
Figure 2
Adaptive upregulation of PPARγ correlates with immune dysregulation in mouse models and patients with HCC. (A) ScRNA-seq analysis of tumour cell clusters from Hepa1-6-PD-L1S and PD-L1R tumours with anti-PD-L1 treatment (n=2 per group). UMAP plot of the identified tumour cells. (B) Volcano plot of differentially expressed genes (DEGs; left; Log2fold-change >0.5 and p<0.05) and KEGG pathway enrichment analysis for top five enriched pathways of DEGs (right; Log2fold-change>0.5, p<0.05 and normalised expression >0.1) in anti-PD-L1-treated PD-L1S (orange bar) or PD-L1R tumour cells (blue bar), respectively. (C) GSEA plot of PPAR signalling pathway (KEGG) in PD-L1R tumour cells compared with PD-L1S tumour cells. (D) Heatmap showing z-score transformed expression of PPAR-related genes identified in (B) in PD-L1S or PD-L1R tumour cells from each sample. (E) UMAP plots of expression patterns of Ppara (top) and Pparg (bottom) in PD-L1S and PD-L1R single cells. (F) Representative western blot analysis of PPARα and PPARγ in Hepa1-6 or RIL-175-PD-L1S and -PD-L1R cell lines and anti-PD-L1-treated tumour tissues. GAPDH served as loading control. (G) TCGA HCC samples with high (n=55) and low (n=55) mRNA levels of PPARA or PPARG that were stratified by top and bottom 15% in 369 patients were selected for subsequent analysis. GSEA plots of CD8+ T cell dysfunction signature in patients with TCGA HCC with high and low expressions of PPARA or PPARG. (H) Kaplan-Meier curves of overall survival in patients with HCC according to the expression of PPARA or PPARG. (I) Prediction of potential clinical ICB response in patients with PPARαhigh versus PPARαlow or PPARγhigh versus PPARγlow HCC using the TIDE signature. (J) Analysis of TIDE, T cell exclusion and MDSC scores by TIDE algorithm in patients with PPARαhigh and PPARαlow or PPARγhigh and PPARγlow HCC. Statistical significance was assessed by two-sided log-rank (Mantel-Cox) test for (H), by two-sided χ² test for (I) and by unpaired two-tailed Student’s t-test for (J). *P<0.05; ***p<0.001; ****p<0.0001. DEGs, differentially expressed genes; GSEA, Gene Set Enrichment Analysis; HCC, hepatocellular carcinoma; ICB, immune-checkpoint blockade; KEGG, Kyoto Encyclopedia of Genes and Genomes; MDSC, myeloid-derived suppressor cell; PD-L1R, programmed death-1-ligand-1 resistant; PD-L1S, programmed death-1-ligand-1 sensitive; PPARγ, peroxisome proliferator-activated receptor-gamma; TIDE, Tumor Immune Dysfunction and Exclusion; UMAP, Uniform Manifold Approximation and Projection.
Figure 3
Figure 3
Tumour-intrinsic PPARγ orchestrates TME remodelling to resist ICB therapy. (A) Treatment schedule for anti-PD-L1 antibody (10F.9G2) or isotype control (LTF-2) in Hepa1-6-PD-L1R-short hairpin RNA against negative control sequence (shNC)-tumour or shPPARγ-tumour bearing mice. In brief, 5×10⁶ tumour cells were intrahepatically injected into C57BL/6 mice, which were then treated with anti-PD-L1 or isotype control antibodies via i.p. injection at day 6, 11 and 16. Tumour samples were collected at day 18-post tumour implantation for further analysis. Representative western blot images of PPARγ in Hepa1-6-PD-L1R-shNC or -shPPARγ stable cell lines are shown. GAPDH served as loading control. (B) Representative liver tumour photos and tumour weights of PD-L1R-shNC-tumour or shPPARγ-tumour bearing mice with treatment of anti-PD-L1 or isotype control at the endpoint are shown (n=7 to 8). (C) Representative flow cytometry dot plots and proportions of CD8+ T cells in CD45+ cells, (D) IFN-γ+TNF-α+ cells and (E) PD-1+TIM-3+ cells in CD8+ T cells, as well as (F) PMN-MDSCs in CD45+ cells in tumours from indicated groups are shown (n=7 to 8). (G) Representative immunofluorescence images of CD8 (red), (H) CD11b (green)/Ly-6G (red) and quantification dot plot bar graphs in liver tumours from indicated groups (n=7 to 8). DAPI (blue) indicates the nuclei staining. Scale bars, 50 µm. (I) Correlation heatmap of immune cell proportions calculated by data from C to F. (J) The ratios of CD8+ T/PMN-MDSCs and (K) cytotoxic/exhausted CD8+ T cell in tumours (n=7 to 8). Data represent as mean±SD. Statistical significance was determined by unpaired two-tailed Student’s t-test. Two-tailed Pearson’s correlation was used to describe the correlation between variables. *P<0.05; **p<0.01; ***p<0.001; ****p<0.0001. ICB, immune-checkpoint blockade; IFN, interferon; MDSC, myeloid-derived suppressor cell; PD-L1, programmed death-1-ligand-1; PMN, polymorphonuclear; PPARγ, peroxisome proliferator-activated receptor-gamma; TIM, T cell immunoglobulin; TME, tumour microenvironment; TNF, tumour necrosis factor.
Figure 4
Figure 4
Tumour-intrinsic PPARγ transcriptionally activates VEGF-A production to remodel TME. (A) Venn diagram of upregulated genes in Hepa1-6-PD-L1R tumour cell clusters (scRNA-seq), Hepa1-6-PD-L1R cell lines from bulk RNA-seq data and cytokines/chemokines from ImmPort. Heatmap showing normalised and z-scored expression of the 13 overlapped genes in scRNA-seq or bulk RNA-seq data, respectively (n=2). (B) Heatmap of relative mRNA levels of Pparg and the 13 indicated candidate genes in Hepa1-6-shNC-tumour and shPPARγ tumour cells (n=4) or tissues (n=5 to 6) are shown. (C) ELISA analysis of VEGF-A secretion levels in cell lines (n=4) and anti-PD-L1-treated tumour tissues (n=5) from Hepa1-6 and RIL-175 models. (D) VEGF-A protein concentration in cell lysates of Hepa1-6 or RIL-175-shNC and shPPARγ cell lines determined by ELISA (n=4). (E) ChIP-qPCR analysis of PPARγ occupancy on the Vegfa promoter region in the indicated cell lines (n=4). Data are normalised to PD-L1S control level. (F) Schematic illustration of PMN-MDSC expansion and functional analysis ex vivo. (G) Proportions of PMN-MDSC in CD45+ cells in indicated groups were assessed by flow cytometry (n=4). (H) Representative overlay histogram and expression levels determined by mean fluorescence intensity (MFI) of Arg-1 in PMN-MDSCs (n=4). (I) Schematic illustration of CD8+ T cell functional assay ex vivo. (J) Representative overlay histogram and MFI of PD-1, TIM-3, IFN-γ and TNF-α in CD8+ T cells (n=4). Dashed line indicates the peak of the Hepa1-6-shNC sample. (K) C57BL/6 mice were intrahepatically injected with Hepa1-6-PD-L1R-shNC or shPPARγ cells (5×10⁶), followed by three doses of treatment with anti-PD-L1 antibody 10F.9G2 or isotype control LTF-2 (10 mg/kg, i.p., every 5 days). Tumours were harvested at the experimental endpoint. VEGF-A secretion levels in tumour tissues were measured from indicated groups. (L) Pearson correlation of immune cell proportions with VEGF-A secretion in tumour tissues. (M) Correlation between VEGF-A secretion in tumour tissues and tumour weight. Data represent as mean±SD. Statistical significance was determined by unpaired two-tailed Student’s t-test. Single-tailed Pearson’s correlation was used to describe the correlation between variables. *P<0.05; **p<0.01; ***p<0.001; ****p<0.0001. ICB, immune-checkpoint blockade; IFN, interferon; MDSC, myeloid-derived suppressor cell; PD-1, programmed cell death protein 1; PMN, polymorphonuclear; PPARγ, peroxisome proliferator-activated receptor-gamma; TME, tumour microenvironment; TNF, tumour necrosis factor.
Figure 5
Figure 5
PPARγ antagonist T0070907 averts ICB resistance in orthotopic HCC models. (A) Combinatory treatment schedule of T0070907 and anti-PD-L1 antibody 10F.9G2 in mice bearing Hepa1-6 or RIL-175-PD-L1R tumours. (B) Representative liver tumour photos and tumour weights of indicated groups in Hepa1-6 and (C) RIL-175-derived ICB-resistant models (n=8 to 10). (D) ELISA analysis of VEGF-A secretion levels of indicated groups in Hepa1-6 and (E) RIL-175-derived ICB-resistant models (n=7 to 8). (F) The ratios of CD8+ T/PMN-MDSC in Hepa1-6 and (G) RIL-175 resistant tumours from indicated groups (n=8). (H) The ratios of cytotoxic/exhausted CD8+ T cell in Hepa1-6 and (I) RIL-175 resistant tumours from indicated groups (n=8). (J) Kaplan-Meier survival analysis of mice from indicated groups in Hepa1-6 and (K) RIL-175-derived ICB-resistant models (n=9 to 14). Data represent as mean±SD. Statistical significance was assessed by unpaired two-tailed Student’s t-test for (B)–(I), and by two-sided log-rank (Mantel-Cox) test for (J) and (K). *P<0.05; **p<0.01; ***p<0.001; ****p<0.0001. IFN, interferon; MDSC, myeloid-derived suppressor cell; MFI, mean fluorescence intensity; PD-L1R, programmed death-1-ligand-1 resistant; PMN, polymorphonuclear; PPARγ, peroxisome proliferator-activated receptor-gamma; TIM, T cell immunoglobulin; TME, tumour microenvironment; TNF, tumour necrosis factor; VEGF, vascular endothelial growth factor.
Figure 6
Figure 6
PPARγ antagonist T0070907 overcomes ICB resistance in the spontaneous HCC model. (A) Combinatory treatment schedule of T0070907 and anti-PD-L1 antibody 10F.9G2 in N-Ras/c-Myc-induced spontaneous HCC model (top). Representative western blot images of PPARγ in N-Ras/c-Myc-induced tumours (bottom). GAPDH served as loading controls. (B) Representative photos (top) and H&E staining images (bottom) of liver tumours of indicated groups (n=9 to 10). Scale bars, 500 µm. Tumour area is circled by red dotted line. (C) Tumour burden in indicated groups was evaluated by liver versus body weight ratios (LW/BW; left), numbers (middle) and average diameters (right) of tumour nodules per mouse from H&E images. (D) VEGF-A secretion levels in tumour tissues from indicated groups (n=7 to 8). (E) The proportions of CD8+ T cells, (F) GzmB+CD107a+ and (G) PD-1+TIM-3+ cells in tumorous CD8+ T cells as well as (H) PMN-MDSCs in tumorous CD45+ cells from indicated groups (n=8 to 9). (I) The ratios of CD8+ T/PMN-MDSC and (J) cytotoxic/exhausted CD8+ T cell in indicated groups. Data represent as mean±SD. Statistical significance was determined by unpaired two-tailed Student’s t-test. *P<0.05; **p<0.01; ***p<0.001; ****p<0.0001. BW, body weight; HCC, hepatocellular carcinoma; ICB, immune-checkpoint blockade; LW, liver weight; MDSC, myeloid-derived suppressor cell; PD-L1, programmed death-1-ligand-1; PMN, polymorphonuclear; PPARγ, peroxisome proliferator-activated receptor-gamma; TIM, T cell immunoglobulin; VEGF, vascular endothelial growth factor.
Figure 7
Figure 7
High PPARγ expression correlates with immunosuppressive TME and poor ICB response in human HCC and other cancer types. (A) Schematic overview of a phase II clinical trial of pembrolizumab in patients with HBV-related HCC (NCT03419481) and tumour biopsy collection for analyses. (B) Longitudinal CT scans of a patient with DCB (PW026) and another patient with NDB (PW004) at indicated time points. The target lesion and its longest diameter are shown. Treatment for PW004 was stopped at cycle 4 due to disease progression. (C) UMAP plot of 210 153 single cells coloured by patient ID and treatment status. (D) Waterfall plot of individual patient-level percentage change in tumour cell-intrinsic PPARG mRNA levels from baseline to two-cycle of pembrolizumab (on-treatment). Baseline PPARG expression of PW019 and PW034 is numerically equal to 0. (E) Representative coimmunofluorescence images of CD11b, CD8 and PPARγ, as well as H&E images of paired baseline and on-treatment biopsies from a patient with NDB (PW010) are shown. Scale bars, 50 µm. (F) Kaplan-Meier survival analyses of patients with HCC, (G) melanoma, (H) glioblastoma and (I) ccRCC (CheckMate 010) undergone ICB treatment according to their baseline PPARG expression levels. Statistical significance was assessed by two-sided log-rank (Mantel-Cox) test. ccRCC, clear cell renal cell carcinoma; DCB, durable clinical benefits; HCC, hepatocellular carcinoma; ICB, immune-checkpoint blockade; NDB, no durable benefits; PPARγ, peroxisome proliferator-activated receptor-gamma; TME, tumour microenvironment; UMAP, Uniform Manifold Approximation and Projection.
Figure 8
Figure 8
A working model of a tumorous adaptive transcriptional programme to evade immune-checkpoint targeting. During mono-ICB therapy, HCC cells adapt by PPARγ upregulation to orchestrate an MDSC-enriched and T cell-dysfunctional TME via VEGF-A secretion. Selective targeting of PPARγ signalling abrogates the adaptive immune-evasive programme in TME to avert ICB resistance, leading to tumour regression. HCC, hepatocellular carcinoma; ICB, immune-checkpoint blockade; MDSC, myeloid-derived suppressor cell; PPARγ, peroxisome proliferator-activated receptor-gamma; TME, tumour microenvironment; VEGF, vascular endothelial growth factor.

References

    1. Forner A, Reig M, Bruix J. Hepatocellular carcinoma. Lancet 2018;391:1301–14. 10.1016/S0140-6736(18)30010-2 - DOI - PubMed
    1. Zhou J, Liu M, Sun H, et al. . Hepatoma-intrinsic CCRK inhibition diminishes myeloid-derived suppressor cell immunosuppression and enhances immune-checkpoint blockade efficacy. Gut 2018;67:931–44. 10.1136/gutjnl-2017-314032 - DOI - PMC - PubMed
    1. Liu M, Zhou J, Liu X, et al. . Targeting monocyte-intrinsic enhancer reprogramming improves immunotherapy efficacy in hepatocellular carcinoma. Gut 2020;69:365–79. 10.1136/gutjnl-2018-317257 - DOI - PubMed
    1. Yang W, Feng Y, Zhou J, et al. . A selective HDAC8 inhibitor potentiates antitumor immunity and efficacy of immune checkpoint blockade in hepatocellular carcinoma. Sci Transl Med 2021;13:eaaz6804. 10.1126/scitranslmed.aaz6804 - DOI - PubMed
    1. Finn RS, Qin S, Ikeda M, et al. . Atezolizumab plus bevacizumab in unresectable hepatocellular carcinoma. N Engl J Med 2020;382:1894–905. 10.1056/NEJMoa1915745 - DOI - PubMed

Publication types

Associated data