. 2023 Apr 5;14(1):1900.
doi: 10.1038/s41467-023-37262-w.

Hematopoietic stem-cell gene therapy is associated with restored white matter microvascular function in cerebral adrenoleukodystrophy

Affiliations

Hematopoietic stem-cell gene therapy is associated with restored white matter microvascular function in cerebral adrenoleukodystrophy

Arne Lauer et al. Nat Commun. .

Abstract

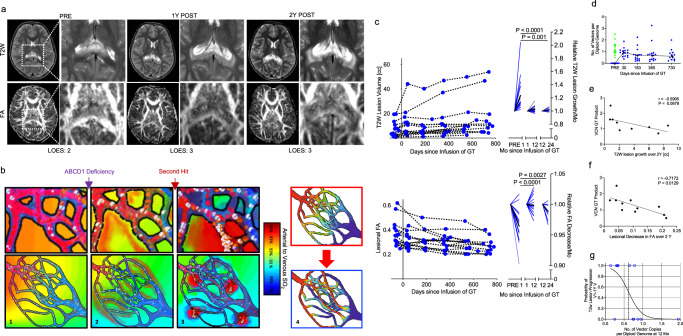
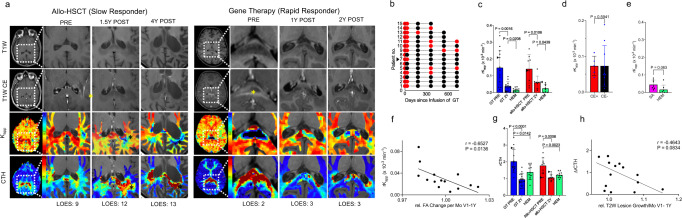
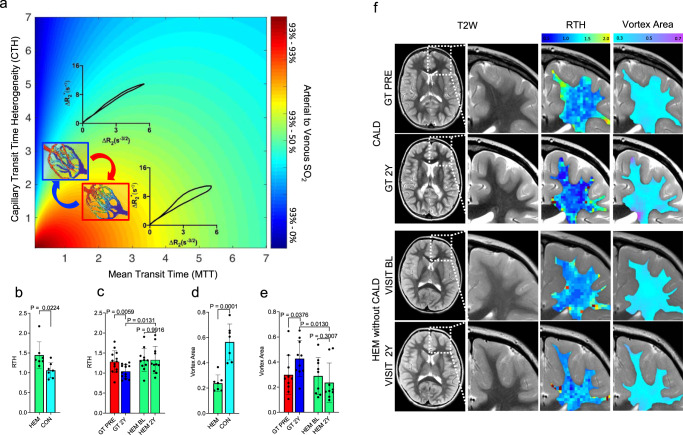
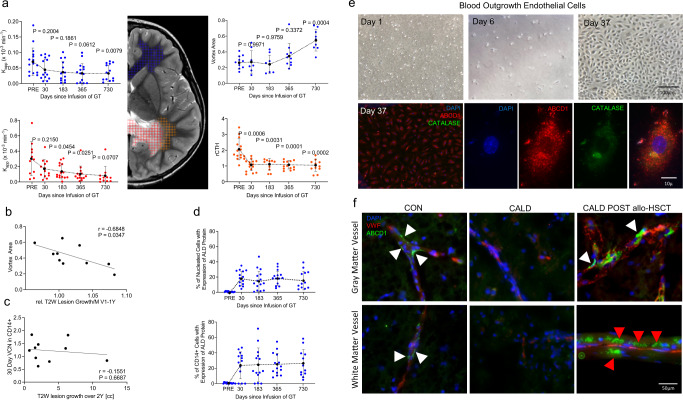
Blood-brain barrier disruption marks the onset of cerebral adrenoleukodystrophy (CALD), a devastating cerebral demyelinating disease caused by loss of ABCD1 gene function. The underlying mechanism are not well understood, but evidence suggests that microvascular dysfunction is involved. We analyzed cerebral perfusion imaging in boys with CALD treated with autologous hematopoietic stem-cells transduced with the Lenti-D lentiviral vector that contains ABCD1 cDNA as part of a single group, open-label phase 2-3 safety and efficacy study (NCT01896102) and patients treated with allogeneic hematopoietic stem cell transplantation. We found widespread and sustained normalization of white matter permeability and microvascular flow. We demonstrate that ABCD1 functional bone marrow-derived cells can engraft in the cerebral vascular and perivascular space. Inverse correlation between gene dosage and lesion growth suggests that corrected cells contribute long-term to remodeling of brain microvascular function. Further studies are needed to explore the longevity of these effects.


Conflict of interest statement

This work was funded primarily by NINDS K08 NS094683-01 and R01NS117575 with a partial contribution from Bluebird Bio. D.J.L. is a consultant for Bluebird Bio. D.W. has received research funding for research in hemoglobinopathies and licensed certain IP relevant to hemoglobinopathies to Bluebird Bio. He has received payments from Bluebird Bio in past through BCH institutional licensing agreement and has the potential for future royalty/milestone income. P.L.M. is the co-I of Bluebird Bio clinical trials. She is a consultant to bluebird bio. F.S.E. is the co-PI of Bluebird Bio clinical trials. M.B.H and K.M. are co-applicants on a patent application based on the presented techniques in this manuscript (PCT/DK2014/050296) and are shareholders in Cercare Medical ApS. A.L.; S.L.S.; M.C.; X.D.; C.D.; S.M.C.; V.K.; C.A.L.; D.R.; J.K.-C.; K.E., and P.C. do not have any disclosures to report directly relating to this study.

Figures

Fig. 1
Fig. 1. Gene dosage and correlations with demyelinating lesion growth in CALD.
a Representative images of T2-weighted (T2W) and fractional anisotropy (FA) maps of a patient with CALD before (PRE), 1 and 2 years post successful gene therapy (GT). Magnifications illustrate the progress of the T2W lesion and structural tissue reorganization on FA maps primarily within the first year and only minor changes in the second year. b Schematic illustrations of microvascular vulnerability caused by ABCD1 deficiency. Loss of ABCD1 function in hemizygotes leads to altered interactions of leukocytes and brain-endothelium. Compared to healthy flow conditions (1), this causes increased flow heterogeneity and BBB-permeability within capillary beds (2) and precedes conversion to CALD exacerbated by a yet unknown “second hit” (red). As the CALD manifests, flow heterogeneity and BBB-permeability exacerbate (3). The degree of leukocyte-to-brain-endothelial cell interaction is thought to affect microcirculation causing flow disturbances and shunting in the capillary bed, impairing vascular efficacy (4). c Longitudinal data for T2W lesion volume (top) and mean lesional FA (bottom) of GT-treated patients (n = 15). For each row left, diagram shows the longitudinal course and right diagram shows relative monthly change in lesion volume and FA PRE to visit 1 (1–2 Mo) and within the first and second-year follow-up (1–12 Mo, 12–24 Mo) post treatment. Blue lines indicate individual, black line represents mean change. Welch’s ANOVA between-group difference P = 0.0004 and P < 0.0001. The P values were determined by Dunnett’s multiple comparison test. d Individual Vector copy number (VCN) in the GT product before infusion (green) and in the peripheral blood (blue) for each patient at follow-up after Infusion (n = 11–15, dotted line connects median; error bars indicate interquartile range). e Plot showing the relationship of VCN in the GT product and T2W lesion growth over 2 years (n = 9, two outliers removed, simple linear regression). f Plot showing the relationship of VCN in the GT product and FA decreases over two years (n = 11, simple linear regression). g Logistic regression curve representing an estimate of the probability of delayed T2W lesion growth depending on VCN in the peripheral blood at 12 months (yes vs. no increase V1-12 months, χ2[1] = 7.88, p = 0.037, Pseudo R2 = 0.41, Exp(B) = 0.003, 95% CI 0.001–0.707, n = 15). Source data are provided as a Source Data file.
Fig. 2
Fig. 2. Effects of allo-HSCT and gene therapy on inflammatory CALD lesions.
a Representative T1-weighted images without (T1W) and with gadolinium contrast enhancement (T1W CE), the apparent contrast leakage parameter (Kapp) and capillary flow heterogeneity (CTH) maps of two CALD patients before (PRE) and after (POST) treatment with allogenic hematopoietic stem-cell transplantation (allo-HSCT, left) or gene therapy (GT, right). Lesion magnifications in PRE show strong CE ring enhancement which resolved POST treatment in both patients, while POST Kapp- and CTH maps show persisting regionally increased BBB-permeability and microvascular flow heterogeneity in the allo-HSCT patient, in contrast to a GT-treated patient with rapid normalization of microvascular perfusion markers. Data points of these patients are highlighted with pointing triangles in the following figures. b Longitudinal data on binary contrast reads (yes vs. no pathologic CE) in GT patients (n = 15). c Lesional relative Kapp PRE and 2Y post GT (n = 13) and allo-HSCT (n = 8) and relative Kapp in corresponding white matter in age-matched hemizygotes without CALD (HEM, n = 11–8). Error bars show mean ± SD; the P values were determined by two-tailed paired and unpaired students’ t tests. d Comparison of lesional Kapp in patients assessed positive (CE+) and negative (CE−) for pathologic enhancement at 1Y (n = 5–10). Error bars show mean ± SD; two-tailed unpaired students’ t tests. e Same as c for CALD patients with self-arrested lesions (SA, n = 7) vs. age-matched HEM (n = 7). Two-tailed unpaired students’ t tests. f Plot showing the relationship of Kapp at 1Y and relative monthly FA decrease between the first month POST (V1) and 1Y (n = 15). Line indicates regression; two-tailed Pearson’s correlation. g Perilesional rCTH PRE and 2Y post GT (n = 13) and allo-HSCT (n = 10) and rCTH in corresponding white matter in age-matched hemizygotes without CALD (HEM, n = 11–10) Error bars show mean ± SD; the P values were determined by two-tailed paired and unpaired students’ t tests. h Correlation plot showing perilesional rCTH 1Y and relative monthly T2W lesion growth between the first month POST (V1) and 1Y (n = 15). Line indicates regression; two-tailed Pearson’s correlation. Source data are provided as a Source Data file.
Fig. 3
Fig. 3. Effects of gene therapy on non-lesional white matter microvascular function.
a Theoretical relationship between the imaging parameters capillary transit time heterogeneity (CTH) and mean transit time (MTT, an overall tissue perfusion marker) regarding the oxygen saturation of the perfused tissue. Flow disturbances in the capillary system lead to a mismatch between MTT and CTH (quantifiable as increased relative transit time heterogeneity = RTH). The microvascular flow delay results in increased oxygen extraction in the capillary bed (ΔSO2) indicating a reduction in vascular efficacy. This affects the relaxation curves from MRI gradient- and spin-echo signals and forms a reduced relative vortex area (VA). b Mean RTH in corresponding NAWM of HEM and controls without ALD (CON, n = 7). Data are expressed as mean ± SD; the P values were determined by two-tailed unpaired students’ t tests. c Mean RTH in distant normal-appearing white matter (NAWM) in CALD patients (n = 13) before (PRE) and 2Y post gene therapy (GT) and baseline to 2Y follow-up visit in age-matched hemizygotes without CALD (HEM, BL vs. 2Y, n = 11). Data are expressed as mean ± SD; the P values were determined by two-tailed paired and unpaired students’ t tests. d Same comparisons as in (b) for mean VA (n = 7). Data are expressed as mean ± SD; the P values were determined by two-tailed unpaired students’ t tests. e Same comparisons as in c for mean VA (n = 10–9). Data are expressed as mean ± SD; the P values were determined by two-tailed paired and unpaired students’ t tests. f Representative T2-weighted (T2W) images of distant NAWM and corresponding RTH and VA maps in a CALD patient PRE and 2Y post GT and an untreated HEM boy of same age without CALD at baseline and 2 years later. Source data are provided as a Source Data file.
Fig. 4
Fig. 4. Engraftment of Bone-marrow Derived ABCD1 Sufficient Cells into the Brain Vasculature.
a Longitudinal mean Kapp and mean VA in distant NAWM (blue), mean Kapp in the lesion (red) and mean perilesional rCTH (orange) following gene therapy (GT, n = 7–15 each time point). Black dots indicate grouped mean, error bars indicate SD. Mixed effects analysis with Geisser-Greenhouse correction, a single pooled variance and P values (vs. PRE) adjusted for multiplicity. b Correlation plot showing post treatment VA in NAWM vs. relative monthly T2w lesion growth V1-1Y (n = 10). Line indicates regression; two-tailed Pearson’s correlation. c Plot showing the relationship of VCN in CD14+ at 30 days and T2W lesion growth over two years (n = 10, simple linear regression). d Longitudinal data on percentage of CD14+ and nucleated cells expressing ALD protein in the peripheral blood after infusion of GT (n = 15). Dotted line connects means; error bars indicate SD. e In vitro Blood outgrowth endothelial cell morphology after GT at day 1, 6 and 37 from a patient with at baseline missing ALDP expressio. Microphotographs of representative confocal imaging show ALDP expression in peroxisomes as demonstrated by colocalization with catalase. Two biological replicates with three technical replicates each were performed. f Ex vivo representative microphotographs of brain specimens from a control (CON), an untreated patient with CALD with no ABCD1 expression, and a patient with CALD treated with allo-HSCT, 15 months after successful bone marrow peripheral blood engraftment. Following allo-HSCT punctate (peroxisomal) high ALDP expression is observed in microvascular pericytes (white arrows) and endothelial cells (white arrowheads) suggesting brain mural vascular engraftment of donor (ABCD1+) cells. Large numbers of infiltrating donor-ALDP expressing perivascular mononuclear cells were found in the perilesional white matter micro vessels after allo-HSCT. Three consecutive sections each were processed with the same technique. Source data are provided as a Source Data file.

References

    1. Mosser J, et al. Putative X-linked adrenoleukodystrophy gene shares unexpected homology with ABC transporters. Nature. 1993;361:726–730. doi: 10.1038/361726a0. - DOI - PubMed
    1. Moser HW, et al. X-Linked adrenoleukodystrophy: overview and prognosis as a function of age and brain magnetic resonance imaging abnormality. A study involving 372 patients. Neuropediatrics. 2000;31:227–239. doi: 10.1055/s-2000-9236. - DOI - PubMed
    1. Moser HW, Mahmood A, Raymond GV. X-linked adrenoleukodystrophy. Nat. Clin. Pract. Neurol. 2007;3:140–151. doi: 10.1038/ncpneuro0421. - DOI - PubMed
    1. Eichler FS, et al. Is microglial apoptosis an early pathogenic change in cerebral X-linked adrenoleukodystrophy? Ann. Neurol. 2008;63:729–742. doi: 10.1002/ana.21391. - DOI - PubMed
    1. Musolino PL, Rapalino O, Caruso P, Caviness VS, Eichler FS. Hypoperfusion predicts lesion progression in cerebral X-linked adrenoleukodystrophy. Brain. 2012;135:2676–2683. doi: 10.1093/brain/aws206. - DOI - PMC - PubMed

Publication types