. 2023 Apr 5;14(1):1898.
doi: 10.1038/s41467-023-37578-7.

The m6A reader YTHDC1 and the RNA helicase DDX5 control the production of rhabdomyosarcoma-enriched circRNAs

Affiliations

The m6A reader YTHDC1 and the RNA helicase DDX5 control the production of rhabdomyosarcoma-enriched circRNAs

Dario Dattilo et al. Nat Commun. .

Abstract

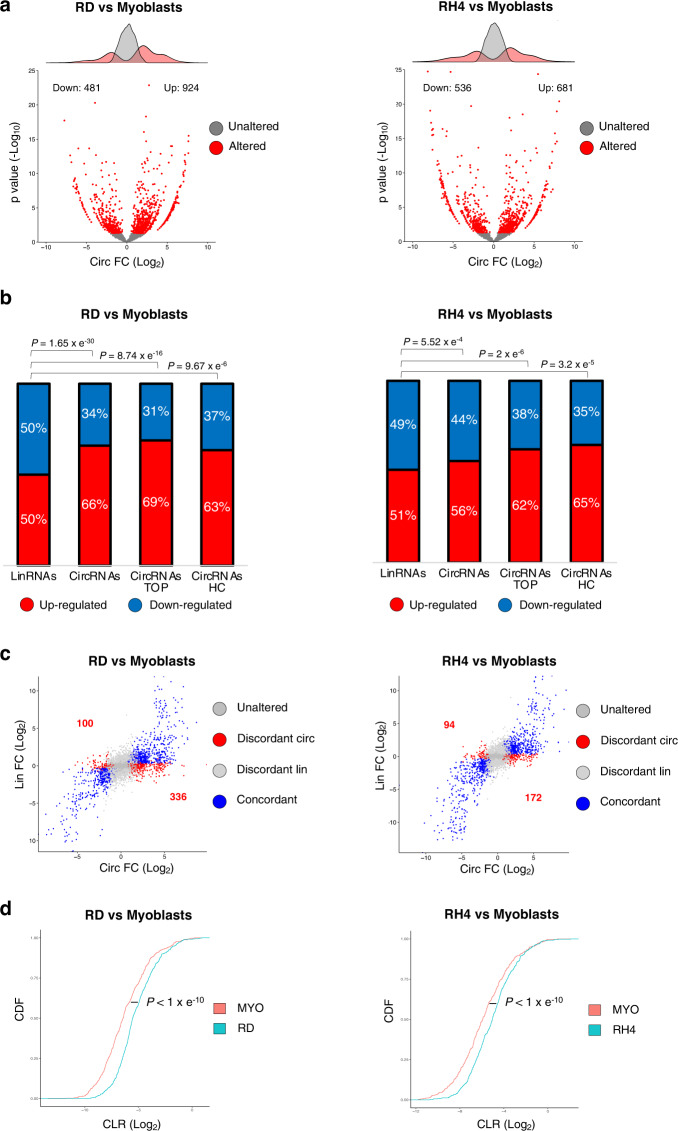
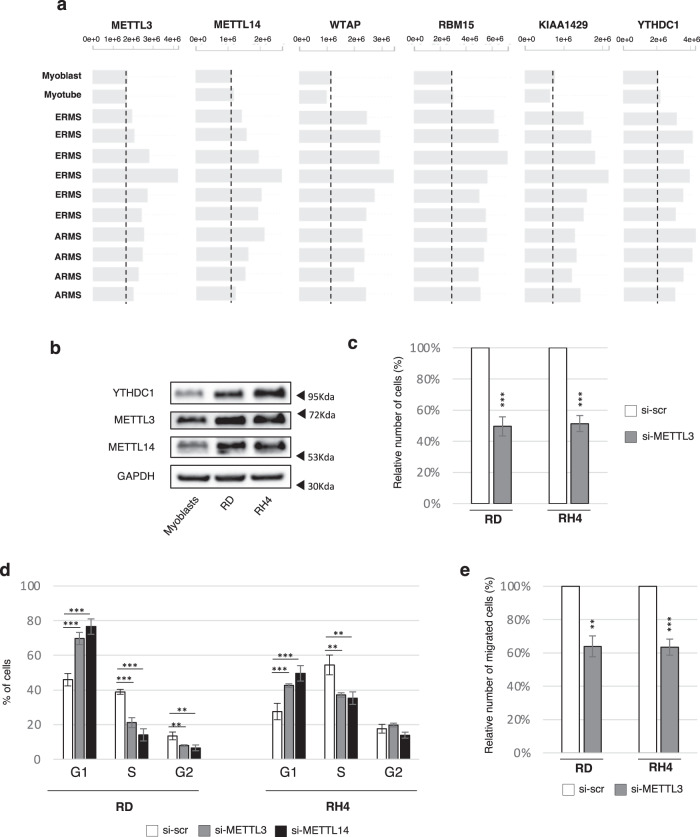
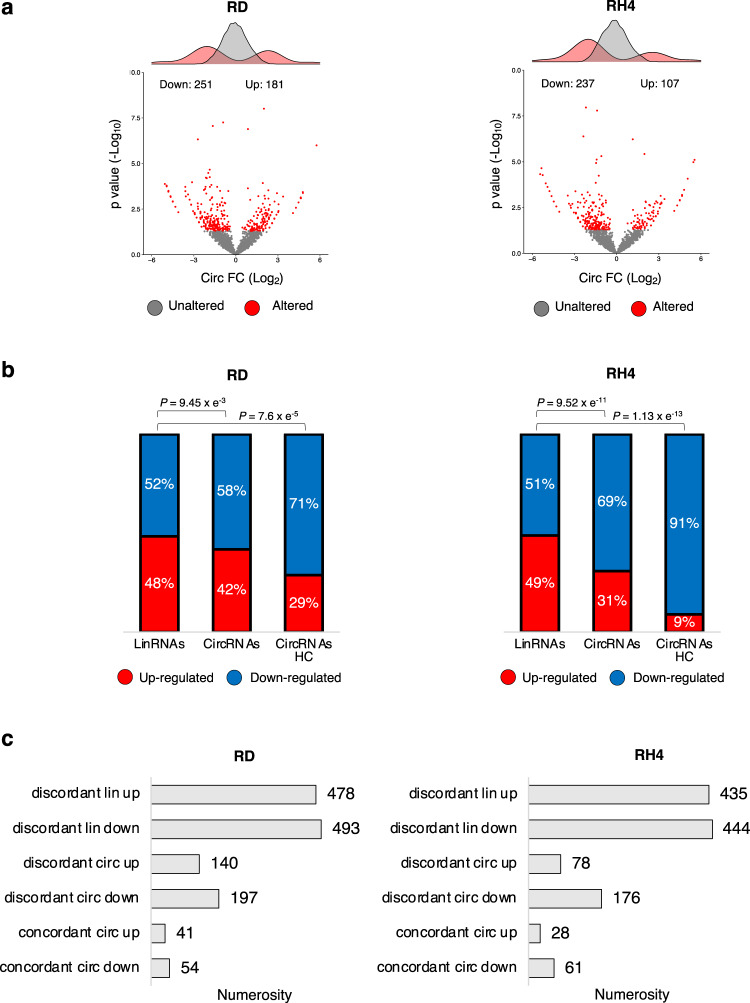
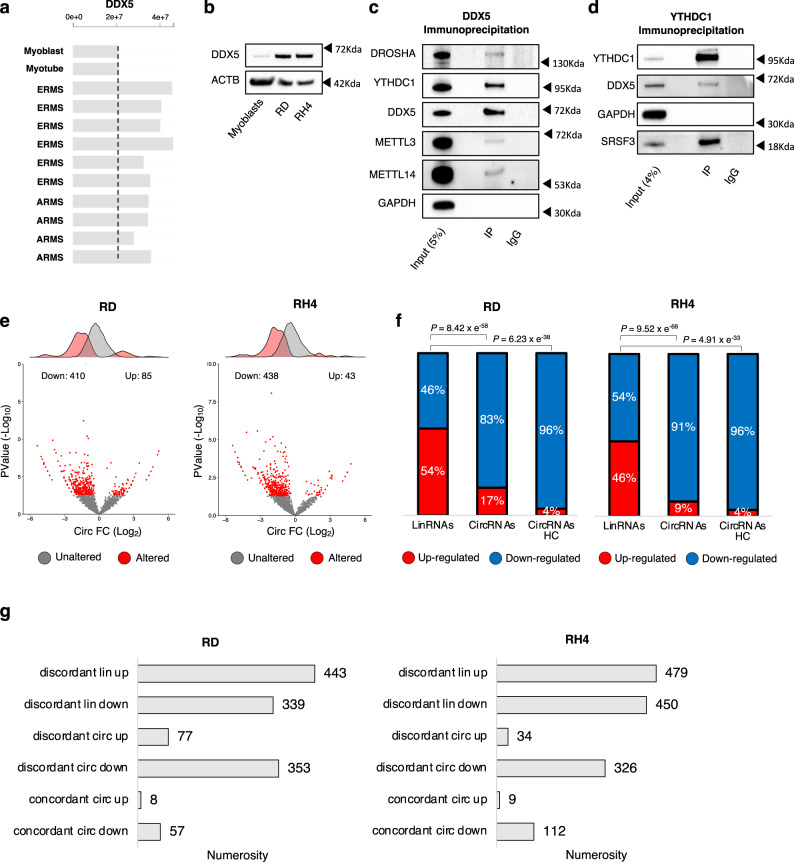
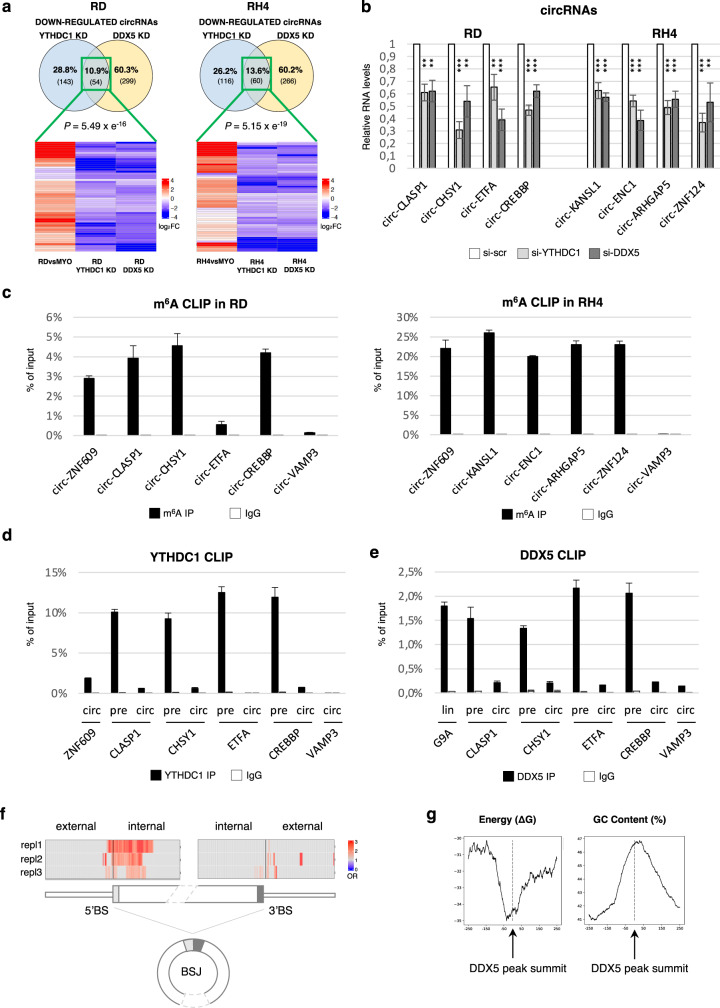
N6-Methyladenosine (m6A) is well-known for controlling different processes of linear RNA metabolism. Conversely, its role in the biogenesis and function of circular RNAs (circRNAs) is still poorly understood. Here, we characterize circRNA expression in the pathological context of rhabdomyosarcoma (RMS), observing a global increase when compared to wild-type myoblasts. For a set of circRNAs, such an increase is due to the raised expression of the m6A machinery, which we also find to control the proliferation activity of RMS cells. Furthermore, we identify the RNA helicase DDX5 as a mediator of the back-splicing reaction and as a co-factor of the m6A regulatory network. DDX5 and the m6A reader YTHDC1 are shown to interact and to promote the production of a common subset of circRNAs in RMS. In line with the observation that YTHDC1/DDX5 depletion reduces RMS proliferation, our results provide proteins and RNA candidates for the study of rhabdomyosarcoma tumorigenicity.


Conflict of interest statement

The authors declare no competing interests.

Figures

Fig. 1
Fig. 1. CircRNA levels increase in RMS.
a Volcano plots showing, for each circRNA identified in the RNA-Seq experiment, the log2 fold change and the −log10 p value either in the comparison between RD (left panel) or RH4 (right panel) cell lines and wild-type myoblasts. The distributions of the fold change values are shown above the volcano plots. Significantly altered circRNAs (p value < 0.05) or unaltered circRNAs are indicated by red or gray dots, respectively. b Stacked bar charts with percentage of down- and upregulated linear (“LinRNAs”), circRNAs (“CircRNAs”), top 20% expressed circRNAs (“CircRNAs TOP”) or “high-confidence” circRNAs (“CircRNAs HC”) in the comparison between RD and wild-type myoblasts (left panel) or between RH4 and wild-type myoblasts (right panel). P values for the differences between proportions were calculated using Fisher exact two-tailed test. c Scatter plots showing, for each circRNA identified in the RNA-seq experiment, the log2 fold change along with that of its cognate linear RNA, in the comparison between RD (left panel) or RH4 (right panel) cell lines and wild-type myoblasts. Significantly deregulated circRNAs are indicated by blue dots when their linear counterpart is deregulated in the same direction (“Concordant”) and by red dots when the linear is either unaltered or deregulated in the opposite direction (“Discordant circ”); significantly deregulated linRNAs are indicated by light gray dots when their circular counterpart is unaltered (“Discordant lin”); unaffected circRNAs are indicated by dark gray dots when their linear counterpart is not altered (“Unaltered”). d Cumulative distribution function of the circular versus the linear isoform expression (“CLR”) in myoblasts (red) and RD (blue, left panel) or RH4 (blue, right panel). P values for the differences between cumulative distribution functions were calculated using Kolmogorov–Smirnov two-tailed test. Source data are provided as a Source Data file.
Fig. 2
Fig. 2. m6A factors are altered in RMS and sustain its proliferation and migration rate.
a Protein levels for several components of the MACOM complex, as well as for the reader YTHDC1, in orthotopic RMS patient-derived xenografts, compared to normal myoblasts and myotubes. Data derive from https://pecan.stjude.cloud/proteinpaint/study/RHB2018. A vertical dashed line indicates the level of protein expression of each gene in normal myoblasts. b Representative western blot to evaluate the levels of METTL3, METTL14, and YTHDC1 in wild-type myoblasts, RD and RH4 cell lines; GAPDH was used as loading control. n = 3 biologically independent replicates. c Relative number of cells upon control treatment (“si-scr”) or METTL3 depletion (“si-METTL3”) in RD or RH4 cell lines 48 hrs post transfection. Data are represented as mean percentage of cells ± SD. n = 4 biologically independent replicates. d Cell cycle analysis by FACS of RD or RH4 cells either upon control treatment (“si-scr”), METTL3 knock-down (“si- METTL3”), or METTL14 knock-down (“si- METTL14”). Data are represented as mean percentage of cells in each cell cycle phase ± SD. n = 4 biologically independent replicates. e Relative number of cells/field measured after transwell-migration assay with DAPI staining upon control treatment (“si-scr”) or METTL3 depletion (“si-METTL3”) in RD and RH4 cells. Data are represented as mean percentage of migrated cells ± SEM. n = 4 biologically independent replicates. Where statistical analysis was performed, the ratio of each sample versus its experimental control was tested by a two-tailed unpaired Student’s t test (c, e) with correction for multiple test comparison (FDR Benjamini–Hochberg) (d). * indicates a test-derived p value < 0.05, ** indicate a p value < 0.01, and *** a p value < 0.001. Source data are provided as a Source Data file.
Fig. 3
Fig. 3. YTHDC1 depletion downregulates circRNAs in RMS.
a Volcano plots showing for each circRNA identified in the RNA-seq experiment the log2 fold change and the −log10 p value upon YTHDC1 knock-down in RD (left panel) or in RH4 (right panel) cells. The distributions of the fold change values are shown above the volcano plots. Significantly altered circRNAs (p value < 0.05) or unaltered circRNAs are indicated by red or gray dots, respectively. See the methods section for statistical analyses details. b Stacked bar charts with percentage of down- and upregulated linear (“LinRNAs”), circRNAs (“CircRNAs”), or “high-confidence” circRNAs (“CircRNAs HC”) upon YTHDC1 knock-down in RD (left panel) or RH4 (right panel) cell lines. P values for the differences between proportions were calculated using Fisher exact two-tailed test. c Bar-plots depicting the numerosity of different scenarios of deregulation in RD (left panel) or in RH4 (right panel) cells upon YTHDC1 knock-down. Source data are provided as a Source Data file.
Fig. 4
Fig. 4. DDX5 helicase controls circRNA expression and interacts with YTHDC1.
a Protein levels for DDX5 in orthotopic RMS patient-derived xenografts, as compared to normal myoblasts and myotubes. Data derive from https://pecan.stjude.cloud/proteinpaint/study/RHB2018. A vertical dashed line indicates the level of protein expression of DDX5 in normal myoblasts. b Representative western blot to evaluate the levels of DDX5 in wild-type myoblasts, RD, and RH4 cell lines; ACTB was used as loading control. n = 3 biologically independent replicates. c Representative western blot analysis of DDX5 immunoprecipitation from whole-cell lysate in RD cells. The percentage of input is indicated. DROSHA and GAPDH were used as a positive and negative control for the co-immunoprecipitation, respectively. n = 2 biologically independent replicates. d Representative western blot analysis of YTHDC1 immunoprecipitation from whole-cell lysate in RD cells. The percentage of input is indicated. SRSF3 and GAPDH were used as a positive and negative control for the co-immunoprecipitation, respectively. n = 2 biologically independent replicates. e Volcano plots showing for each circRNA identified in the RNA-seq experiment the log2 fold change and the −log10 p value upon DDX5 knock-down in RD (left panel) or in RH4 (right panel) cells. The distributions of the fold change values are shown above the volcano plots. Significantly altered circRNAs (p value < 0.05) or unaltered circRNAs are indicated by red or gray dots, respectively. See the methods section for statistical analyses details. f Stacked bar charts with percentage of down- and upregulated linear (“LinRNAs”), circRNAs (“CircRNAs”), or “high-confidence” circRNAs (“CircRNAs HC”) upon DDX5 knock-down in RD (left panel) or RH4 (right panel) cell lines. P-values for the differences between proportions were calculated using Fisher exact two-tailed test. g Bar-plots depicting the numerosity of different scenarios of deregulation in RD (left panel) or in RH4 (right panel) cells upon DDX5 knock-down. Source data are provided as a Source Data file.
Fig. 5
Fig. 5. DDX5 and YTHDC1 directly regulate a subset of circRNAs promoting their upregulation in RMS.
a Venn diagrams (upper panels) showing the overlap between discordant circRNAs downregulated upon YTHDC1 knock-down and those downregulated upon DDX5 knock-down, either in RD (left panel) or in RH4 (right panel). Significance was calculated via Fisher exact two-tailed test. Heatmaps (lower panels) showing log2 fold change of circRNAs at the overlap of the upper Venn diagrams in the comparison between each RMS cell line and wild-type myoblasts as well as in YTHDC1 or DDX5 knock-down in the respective RMS line. b Relative RNA levels of selected circRNAs upon YTHDC1 knock-down (“si-YTHDC1”) or DDX5 knock-down (“si-DDX5”) in RD or RH4. Values are normalized against GAPDH and expressed as relative quantity with respect to scramble siRNA treatment (“si-scr”) set to a value of 1. The relative RNA quantity in the bars is represented as mean of the fold change with standard deviation. n = 3 biologically independent replicates. The ratio of each sample versus its experimental control was tested by two-tailed Student’s t test with correction for multiple test comparison (FDR Benjamini-Hochberg). * indicates a test-derived p value < 0.05, ** indicate a p-value < 0.01, and *** a p value < 0.001. c Levels of selected circRNAs recovered from a representative m6A CLIP in RD (left panel) and RH4 (right panel). CircZNF609 and circVAMP3 were used as positive and negative controls, respectively; immunoprecipitation with IgG was used as control. r, Levels of selected circRNAs recovered from a representative m6A CLIP in RH4 either in control condition (“si-scr”) or upon METTL3 (“si-METTL3”) or DDX5 knock-down (“si-DDX5”); immunoprecipitation with IgG was used as control. The relative RNA quantity in the bars is represented as mean of technical replicates with standard deviation. n = 2 biologically independent replicates. d, e Levels of precursors or mature circRNAs recovered from a representative YTHDC1 (d) or DDX5 (e) CLIP experiment. Values are expressed as percentage of input with standard deviation. CircZNF609 (d) and G9A (e) were used as positive controls. CircVAMP3 was used as negative control. The relative RNA quantity in the bars is represented as mean of technical replicates with standard deviation. n = 3 biologically independent replicates. f Heatmap representing DDX5 binding enrichment in meta-BSJ proximal regions comparing the set of “high-confidence” downregulated circRNAs upon DDX5 depletion in RH4 cells with a set of selected controls from invariant circRNAs. For each DDX5 RIP-seq replicate (“Repl1-2-3”), the odds ratio (“OR”) related to each 100nt window analyzed is depicted. Only bins with significant odds ratio (p value < 0.05) were colored. Statistical significance was assessed using two-sided Fisher exact test. g Line plots representing ∆G (left panel) and GC content (right panel) of 500nt regions centered to DDX5 peak summit of RIP-Seq replicate 1 (see Supplementary Fig. 5 v for replicate 2 and 3). Source data are provided as a Source Data file.

References

    1. Wilusz JE. A 360° view of circular RNAs: from biogenesis to functions. Wiley Interdiscip. Rev. RNA. 2018;9:e1478. doi: 10.1002/wrna.1478. - DOI - PMC - PubMed
    1. Di Timoteo, G., Rossi, F. & Bozzoni, I. Circular RNAs in cell differentiation and development. Development147, dev182725. (2020). - PubMed
    1. Nielsen AF, et al. Best practice standards for circular RNA research. Nat. Methods. 2022;19:1208–1220. doi: 10.1038/s41592-022-01487-2. - DOI - PMC - PubMed
    1. Jeck WR, et al. Circular RNAs are abundant, conserved, and associated with ALU repeats. RNA. 2013;19:141–157. doi: 10.1261/rna.035667.112. - DOI - PMC - PubMed
    1. Westholm JO, et al. Genome-wide analysis of drosophila circular RNAs reveals their structural and sequence properties and age-dependent neural accumulation. Cell Rep. 2014;9:1966–1980. doi: 10.1016/j.celrep.2014.10.062. - DOI - PMC - PubMed

Publication types