. 2023 Apr 5;14(1):1880.
doi: 10.1038/s41467-023-37601-x.

Lateral septum adenosine A2A receptors control stress-induced depressive-like behaviors via signaling to the hypothalamus and habenula

Affiliations

Lateral septum adenosine A2A receptors control stress-induced depressive-like behaviors via signaling to the hypothalamus and habenula

Muran Wang et al. Nat Commun. .

Abstract

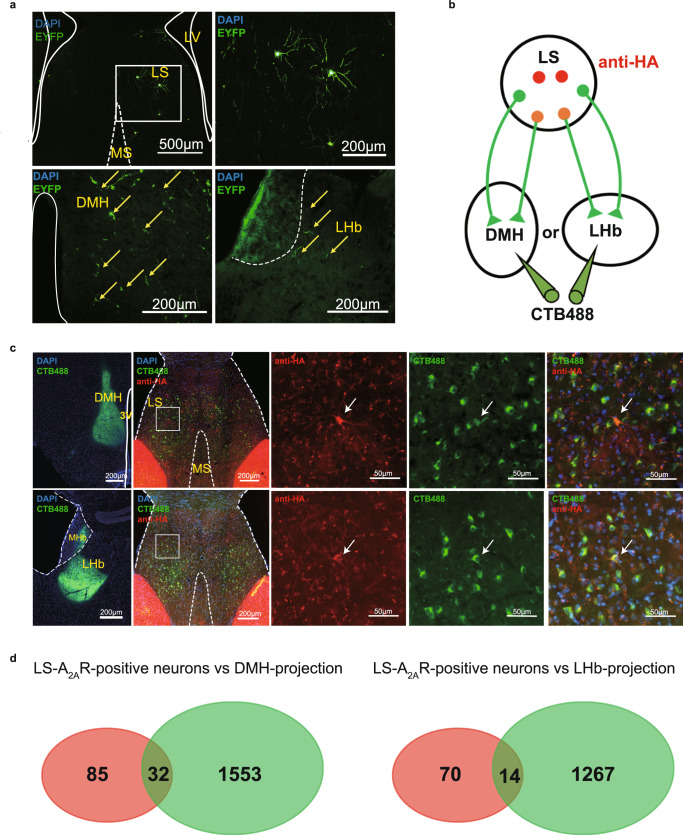
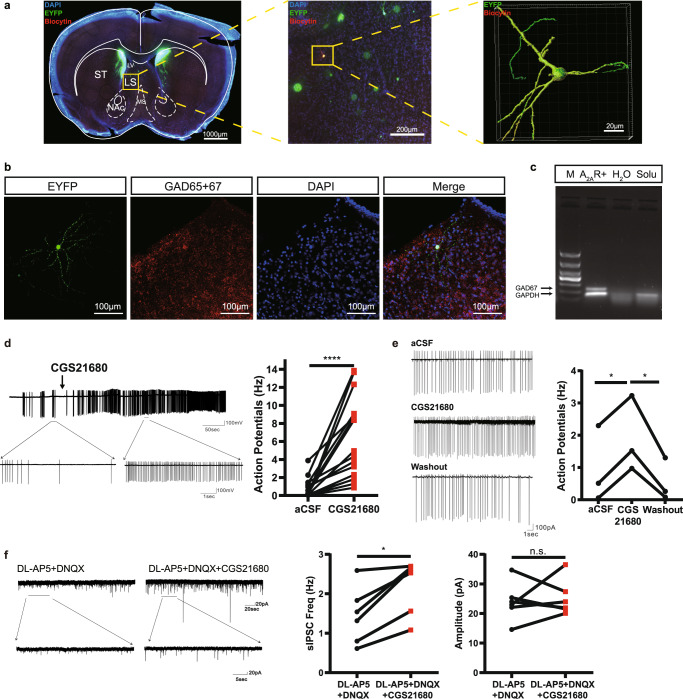
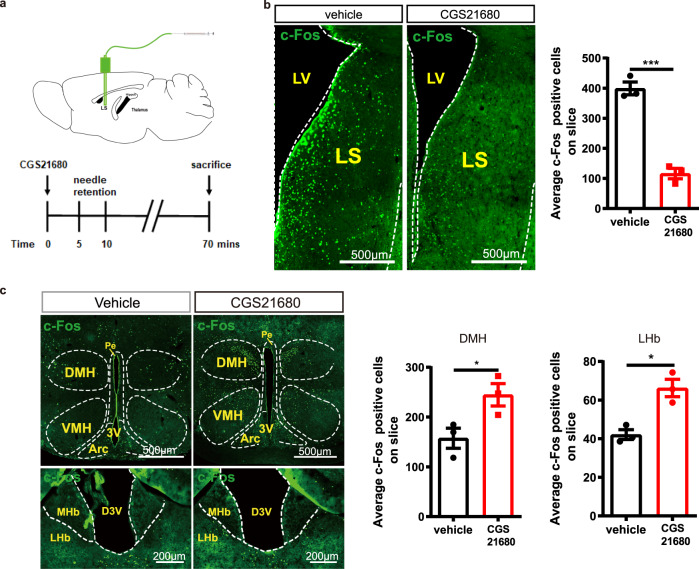
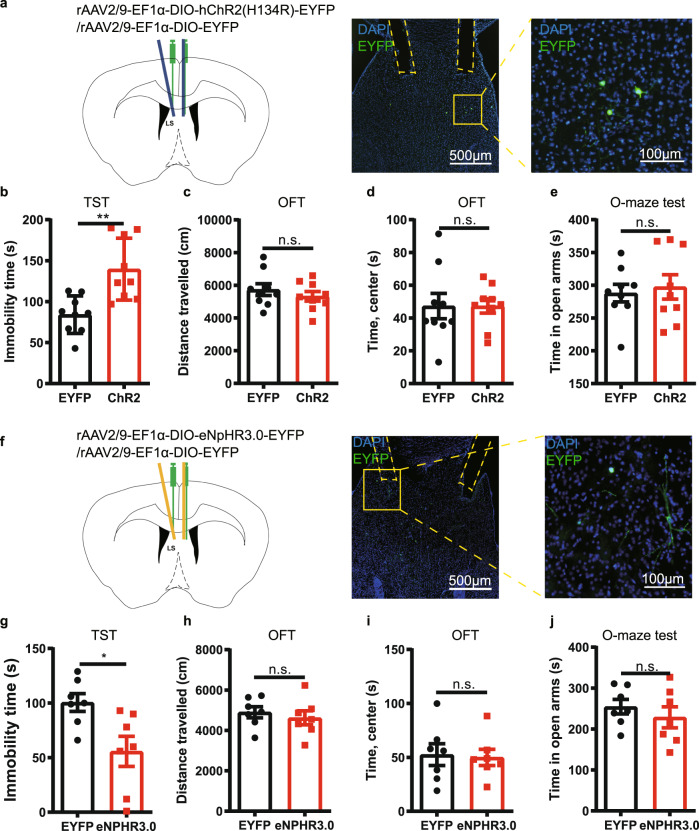
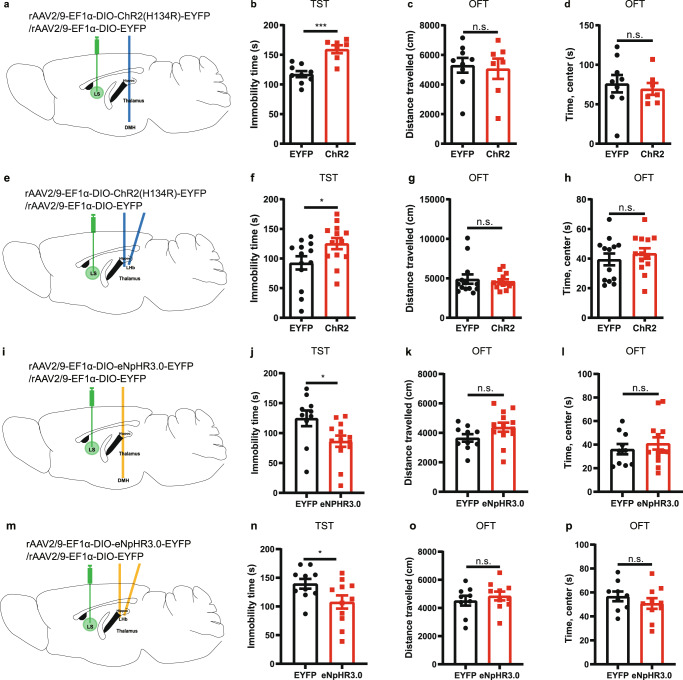
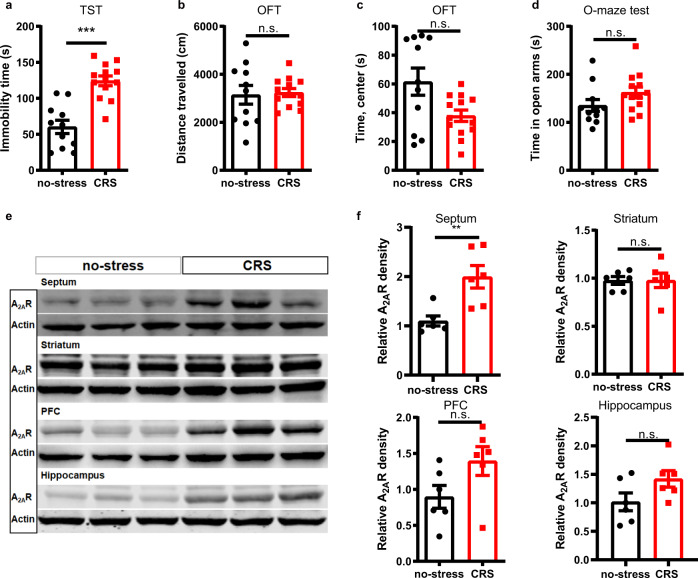
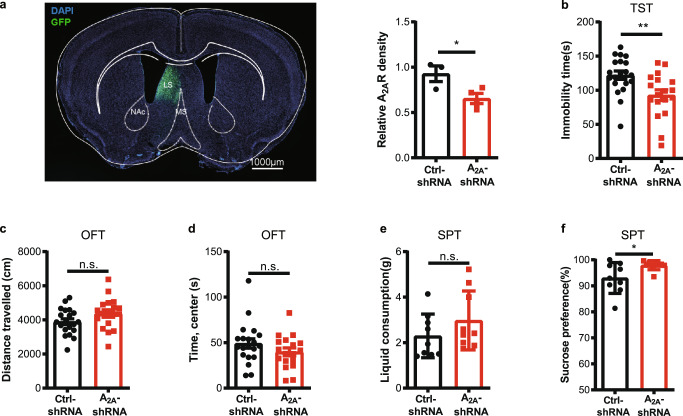
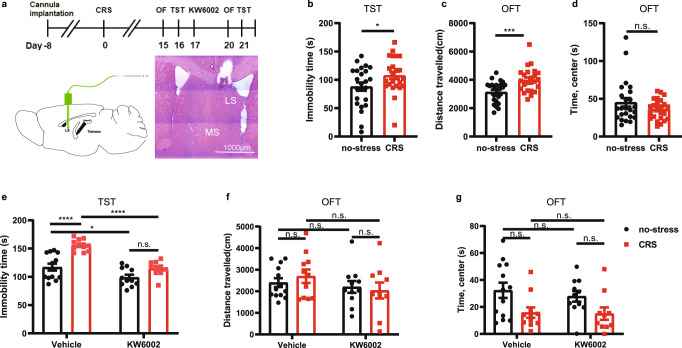
Major depressive disorder ranks as a major burden of disease worldwide, yet the current antidepressant medications are limited by frequent non-responsiveness and significant side effects. The lateral septum (LS) is thought to control of depression, however, the cellular and circuit substrates are largely unknown. Here, we identified a subpopulation of LS GABAergic adenosine A2A receptors (A2AR)-positive neurons mediating depressive symptoms via direct projects to the lateral habenula (LHb) and the dorsomedial hypothalamus (DMH). Activation of A2AR in the LS augmented the spiking frequency of A2AR-positive neurons leading to a decreased activation of surrounding neurons and the bi-directional manipulation of LS-A2AR activity demonstrated that LS-A2ARs are necessary and sufficient to trigger depressive phenotypes. Thus, the optogenetic modulation (stimulation or inhibition) of LS-A2AR-positive neuronal activity or LS-A2AR-positive neurons projection terminals to the LHb or DMH, phenocopied depressive behaviors. Moreover, A2AR are upregulated in the LS in two male mouse models of repeated stress-induced depression. This identification that aberrantly increased A2AR signaling in the LS is a critical upstream regulator of repeated stress-induced depressive-like behaviors provides a neurophysiological and circuit-based justification of the antidepressant potential of A2AR antagonists, prompting their clinical translation.


Conflict of interest statement

The authors declare no competing interests.

Figures

Fig. 1
Fig. 1. Dorsomedial hypothalamus (DMH) and lateral habenula (LHb) are the main outputs of the lateral septum (LS).
a Confocal images of coronal sections showing LS A2AR+ neurons terminals in the DMH and LHb. Three weeks after injecting rAAV2/9-hSyn-DIO-EYFP into the LS of A2AR-Cre mice, EYFP-positive axonal fibers were found in the DMH and LHb. Scale bar: 500/200 μm. LV, lateral ventricle; MS, medial septum. b Experimental scheme showing that CTB488 was injected into DMH or LHb of A2AR-tag mice (to reveal A2AR expression via anti-HA staining). c Fluorescence images illustrating CTB488 (green) targeted to the DMH or LHb of A2AR-tag mice and showing the co-location of DMH or LHb-projection neurons (green) and A2AR (red) in LS. Scale bars: 200/50 μm. 3 V, third Ventricle; MHb, medial habenula. d Average number of LS-A2AR+ neurons labeled with CTB488 from DMH or LHb (n = 3 mice/group, 6 slices/mouse). DMH-projecting LS-A2AR+ neurons, n = 32 ± 3 cells (yellow overlap); LHb-projecting LS-A2AR+ neurons, n = 14 ± 2 cells (yellow overlap). Source data are provided as a Source Data file.
Fig. 2
Fig. 2. Activation of A2AR in the lateral septum (LS) augments spiking frequency of LS-A2AR+ neurons with suppression of surrounding neurons.
a Biocytin (red) in the intracellular solution diffused into the cells on brain slices from A2AR-Cre mice injected with rAAV2/9-hSyn-DIO-EYFP into LS during the in vitro electrophysiological recordings. The recorded A2AR+ neurons (stained yellow) displayed long and numerous branches observed using confocal microscopy combined with 3D surface volume rendering. Scale bars: 1000/200/20 μm. LV, lateral ventricle; MS, medial septum; NAc, Nucleus Accumbens core; ST, striatum. b Representative image from a 300 µm slice after in vitro electrophysiology recording showing A2AR+ neurons (green) co-immunostained with anti-GAD65 + 67 antibody (red) in the LS. Nuclei are stained with DAPI in blue. Scale bar: 100 μm. c Single cell RT-PCR analysis with total mRNA isolated from recorded cells showed that all EYFP-positive cells were GABAergic neurons. M, 1000 bp marker; A2AR+, cell cytoplasm of LS-A2AR+ neuron; H2O, sterile double distilled water; solu, pipette solution. d Representative trace and statistical graph showing that the activation of A2AR by CGS21680 (30 nM) increased the firing frequency of EYFP-positive neurons (n = 16 cells from 8 mice, Wilcoxon test, p = 0.00003, W = 136.0). e Representative trace and statistical graph showing that the effect of CGS21680 on EYFP-positive neurons was reversible after washout (Ctrl: CGS21680, n = 3 cells from 3 mice, Paired t test, p = 0.0309, t(2)=6.663; CGS21680: washout, n = 3 cells, 3 mice, Paired t test, p = 0.0238, t(2) = 6.364). f Left: Representative voltage-clamp recording showing the alterations of spontaneous inhibitory post-synaptic currents (sIPSC, recorded upon blockade of glutamatergic activity with 50 µM DL-AP5 and 20 µM DNQX) in LS non-A2AR+ neurons surrounding A2AR+ neurons before and after the application of CGS21680 (30 nM). Right: Statistical graph showing that CGS21680 increased sIPSCs frequency (n = 6 cells from 4 mice, Paired Wilcoxon test, p = 0.0313, W = 21), without altering their amplitude (n = 6 cells from 4 mice, Paired t test, p = 0.6927, W = 21). DL-AP5, DL-2-amino-5-phosphonopentanoic acid; DNQX, 6,7-dinitroquinoxaline-2,3-dione. *p < 0.05, ****p < 0.0001; n.s., no significant difference. Source data are provided as a Source Data file.
Fig. 3
Fig. 3. The injection of the A2AR agonist CGS21680 into the lateral septum (LS) suppresses c-Fos expression in the LS and increases c-Fos expression in the lateral habenula (LHb) and dorsomedial hypothalamus (DMH).
a Schematic protocol to test the role of the A2AR agonist CGS21680 on LS outputs. b Representative immunofluorescence images and average bar graph illustrating the decreased expression of c-Fos in the LS (n = 3 mice/group, 9 slices/mouse, Unpaired t test, p = 0.0005, t(4) = 10.38). Scale bar: 500 μm. LV, lateral ventricle. c Representative immunofluorescence images and average bar graphs illustrating the increased expression of c-Fos in the DMH (n = 3 mice/group, 9 slices/mouse, Unpaired t test, p = 0.0448, t(4) = 2.884) and LHb (n = 3 mice/group, 9 slices/mouse, Unpaired t test, p = 0.0075, t(4) = 4.648) after focal microinjection of the A2AR agonist CGS21680 into the LS. Scale bars: 500/200 μm. Arc, arcuate hypothalamic nucleus; D3V, dorsal third ventricle; MHb, medial habenula; VMH, ventromedial hypothalamic nucleus; 3V, third Ventricle, Pe, periventricular hypothalamic. Data were shown as mean ± SEM. *p < 0.05, ***p < 0.001; n.s., no significant difference. Source data are provided as a Source Data file.
Fig. 4
Fig. 4. Optogenetic modulation of the activity of A2AR+ neurons in the lateral septum (LS) influences depressive-like phenotype.
a Left: Schematic illustration of the location of virus injection and optic fibers implantation in A2AR-Cre mice. Right: A representative fluorescent image showing the ChR2-positive neurons (green) and the localization of the optic fibers. Nuclei are stained with DAPI in blue. Scale bar: 500/100 μm. (b-e) Optogenetic activation of LS-A2AR+ neurons increased the immobility time in the tail suspension test (TST) (n = 9 mice/group, Unpaired t test, p = 0.0017, t(16) = 3.7710) b without affecting the total distance traveled (n = 9 mice/group, Unpaired t test, p = 0.3980, t(16) = 0.8684) c or the time in the central area in the open field test (OFT) (n = 9 mice/group, Unpaired t test, p = 0.9980, t(16) = 0.002512) d and in the elevated O-maze test (n = 9 mice/group, Unpaired t test, p = 0.6868, t(16) = 0.4106) (e). f Left: Schematic illustration of the location of virus injection and optic fibers implantation in A2AR-Cre mice. Right: A representative fluorescent image shows the eNpHR3.0 positive neurons (green) and the localization of the optic fibers. Nuclei are stained with DAPI in blue. Scale bars: 500/100 μm. Optogenetic suppression of the activity of LS A2AR+ neurons decrease the immobility time in the TST (n = 7 mice/group, Unpaired t test, p = 0.0159, t(12) = 2.804) (g), without affecting the total movement distance in the OFT (n = 7 mice/group, Unpaired t test, p = 0.5465, t(12) = 0.6205) (h), the time spending in the central area in the OFT(n = 7 mice/group, Unpaired t test, p = 0.8404, t(12) = 0.2058) (i), and the duration in the open arm of the elevated O-maze (j) (n = 7 mice/group, Unpaired t test, p = 0.4188, t(12) = 0.8373). Data were shown as mean ± SEM. *p < 0.05, **p < 0.01; n.s., no significant difference. Source data are provided as a Source Data file.
Fig. 5
Fig. 5. Optogenetic modulation of the projection terminals in the dorsomedial hypothalamus (DMH) and lateral habenula (LHb) of A2AR-containing neurons in the lateral septum (LS) influences depressive-like behaviors.
ad Schematic representation of the optogenetic activation of the LS-A2AR+ → DMH terminals (a). Optogenetic activation of LS-DMH projection terminals of A2AR-containing neurons increased immobility in the tail suspension test (TST) (n = 9 and 7 mice per group for EYFP and ChR2, respectively, Unpaired t test, p = 0.0002, t(14)=5.041) (b), without altering the total distance traveled (n = 9 and 7 mice per group for EYFP and ChR2, respectively, Unpaired t test, p = 0.7847, t(14)=0.2785) and the time spent in the center (n = 9 and 7 mice per group for EYFP and ChR2, respectively, Unpaired t test, p = 0.6503, t(14)=0.4633) in the open field test (OFT) (c, d). eh Schematic representation of the optogenetic activation of the LS-A2AR+ →LHb terminals (e). Optogenetic activation of LS-LHb projection terminals increased immobility in TST (n = 13 mice/group, Mann-Whitney test, p = 0.0441, U = 45) (f), without altering the total distance traveled (n = 13 mice/group, Mann–Whitney test, p = 0.5788, U = 73) and the time spent in the center (n = 13 mice/group, Mann–Whitney test, p = 0.4714, U = 70) in the OFT (g, h). il Schematic representation of the optogenetic inhibition of the LS-A2AR-DMH terminals (i). Optogenetic inhibition of the LS-A2AR+ →DMH projections reduced the immobility time in the TST (n = 10 and 13 per group for EYFP and eNpHR3.0, respectively, Unpaired t test, p = 0.0238, t(21) = 2.437) (j), without altering the total distance traveled (n = 10 and 13 per group for EYFP and eNpHR3.0, respectively, Unpaired t test, p = 0.0947, t(21) = 1.750) and the time spent in the center (n = 10 and 13 per group for EYFP and eNpHR3.0, respectively, Unpaired t test, p = 0.5013, t(21) = 0.6843) in the OFT (k, l). mp Schematic representation of the optogenetic inhibition of the LS-A2AR-LHb terminals (m). Optogenetic inhibition of the  LS-A2AR+ →LHb projections reduced the immobility time in the TST (10 and 11 per group for EYFP and eNpHR3.0, respectively, Unpaired t test, p = 0.0418, t(19) = 2.183) (n), without affecting the total distance traveled (n = 10 and 11 per group for EYFP and eNpHR3.0, respectively, Unpaired t test, p = 0.4878, t(17) = 0.7093) or the time spent in the central area of the OFT (n = 10 and 11 per group for EYFP and eNpHR3.0, respectively, Unpaired t test, p = 0.3394, t(17) = 0.9830) (o, p). Data were shown as mean ± SEM. *p < 0.05, ***p < 0.001; n.s., no significant difference. Source data are provided as a Source Data file.
Fig. 6
Fig. 6. A2AR are selectively upregulated in the lateral septum (LS) of mice subject to chronic restraint stress (CRS).
ad Compared with control mice, CRS mice showed an increase in immobility time in a tail suspension test (TST) (n = 11 and 13 mice per group for no-stress and CRS, respectively, Unpaired t test, p = 0.00001, t(22) = 5.674) (a), without changes in the total distance traveled in an open field test (OFT) (n = 11 and 13 mice per group for no-stress and CRS, respectively, Unpaired t test, p = 0.8169, t(22)=0.2343) (b). CRS mice spent similar time in the center area of the OFT (n = 11 and 13 mice per group for no-stress and CRS, respectively, Mann-Whitney test, p = 0.0821, U = 41) (c) and in the open arms of an elevated O-maze test (n = 11 and 13 mice per group for no-stress and CRS, respectively, Unpaired t test, p = 0.1165, t(22) = 1.634) (d). e, f Representative Western blot and quantification of A2AR protein levels in the septum (n = 6 mice/group, Unpaired t test, p = 0.0050, t(10) = 3.584), striatum (n = 6 mice/group, Unpaired t test, p = 0.9898, t(10) = 0.01314), prefrontal cortex (PFC) (n = 6 mice/group, Unpaired t test, p = 0.08, t(10) = 1.948) and hippocampus (n = 6 mice/group, Unpaired t test, p = 0.0886, t(10) = 1.886) of CRS and control mice. CRS mice displayed a selective upregulation of A2AR in the septum without significant changes in the other three brain regions associated with mood processing. Data were shown as mean ± SEM. **p < 0.01, ***p < 0.001; n.s., no significant difference. Source data are provided as a Source Data file.
Fig. 7
Fig. 7. A2AR overexpression in the lateral septum (LS) induces depression-like behaviors.
a Adenovirus expressing A2AR (A2AR-Ad) and ZsGreen (ZsGreen-Ad) in the LS. Nuclei are stained with DAPI in blue. MS, medial septum; NAc, Nucleus Accumbens core. Scale bar: 1000 μm. b Representative Western blots and quantification of A2A receptor protein levels of mice injected with A2AR-Ad and ZsGreen-Ad (n = 6 mice/group, Unpaired t test, p = 0.0106, t(10) = 3.135). ch Compared to control mice, A2AR-Ad mice displayed increased immobility in the tail suspension test (TST) (n = 8 mice/group, Unpaired t test, p = 0.0229, t(14) = 2.554) c, no change of the total distance traveled (n = 8 mice/group, Unpaired t test, p = 0.4639, t(14) = 0.7530) d or the time in the central area in the open field test (OFT) (n = 8 mice/group, Mann-Whitney test, p = 0.6454, U = 27) e and in the elevated O-maze test (n = 8 mice/group, Unpaired t test with Welch’s correction, p = 0.0784, Welch-corrected t(8.9) = 1.988) (f). A2AR-Ad mice displayed similar total liquid consumption (n = 8 mice/group, Mann–Whitney test, p = 0.7033, U = 28) (g) but a decreased consumption of sucrose compared with the control group (n = 8 mice/group, Mann-Whitney test, p = 0.0070, U = 7) (h) in the sucrose preference test (SPT). Data were shown as mean ± SEM. *p < 0.05, **p < 0.01; n.s., no significant difference. Source data are provided as a Source Data file.
Fig. 8
Fig. 8. Focal genetic inactivation of A2AR in the lateral septum (LS) affords an anti-depressant-like phenotype.
a Left: A2AR-specific interference virus (AAV9-syn-A2ARshRNA-GFP, A2AR-shRNA) and control virus (AAV9-syn-A2ARshcontrol-GFP, ctrl-shRNA) were unilaterally injected in the LS of C57BL/6 J mice. Nuclei are stained with DAPI in blue. LS, lateral septum; MS, medial septum; NAc, Nucleus Accumbens core. Scale bar: 1000 μm. Right: The downregulation of A2AR in the LS was verified by qPCR (n = 3 and 4 mice per group for control and A2A-shRNA, respectively. Unpaired t test, p = 0.0383, t(5)=2.794). b The downregulation of A2AR reduced immobility in the tail suspension test (TST) (n = 20 and 18 mice per group for control and A2A-shRNA, respectively, Unpaired t test, p = 0.0049, t(36) = 2.995) without affecting basic motor activity (n = 20 and 18 mice per group for control and A2A-shRNA, respectively. Unpaired t test, p = 0.0860, t(36) = 1.765) and time spent in the central area (n = 20 and 18 mice per group for control and A2A-shRNA, respectively. Mann–Whitney test, p = 0.1645, U = 132) in the open field test (OFT) (c, d). e, f Mice subject to LS-A2AR knockdown displayed a similar total liquid consumption (n = 9 mice/group, Unpaired t test, p = 0.2218, t(16) = 1.271) but increased the consumption of sucrose compared with control mice (n = 9 mice/group, Mann-Whitney test, p = 0.0400, U = 17) in the sucrose preference test (SPT). Data were shown as mean ± SEM. *p < 0.05, **p < 0.01; n.s., no significant difference. Source data are provided as a Source Data file.
Fig. 9
Fig. 9. Focal pharmacological inactivation of A2AR in the lateral septum (LS) affords an anti-depressant-like phenotype.
a Schematic protocol for investigating the role of the A2AR antagonist KW6002 to reverse the CRS-induced depressive phenotypes. Hematoxylin and eosin (HE) staining showing the position of the cannulas. Scale bar: 1000 μm. bd After confirming that the mice subject CRS displayed a depressive-like behaviors in the tail suspension test (TST) (n = 24 mice/group, Unpaired t test, p = 0.0476, t(46) = 2.035) b and in the open field test (OFT) (c: n = 24 mice/group, Unpaired t test, p = 0.0006, t(46) = 3.671; d: n = 24 mice/group, Mann–Whitney test, p = 0.5295, U = 257), eg injection of KW6002 (0.5 µg/µL, 2 µL) into the LS for three consecutive days reversed the increased immobility in the TST caused by CRS (n = 13 (Vehicle: no-stress), 11 (Vehicle: CRS), 11 (KW6002: no-stress) or 10 (KW6002: CRS) mice/group, one-way ANOVA, interaction p = 0.0269, F(1,41) = 5.268; p(Vehicle: no-stress vs. Vehicle: CRS) = 0.0000071, q(41) = 8.037; p(Vehicle: no-stress vs. KW6002: no-stress) = 0.0500, q(41) = 3.787; p(Vehicle: CRS vs. KW6002: CRS) = 0.0000077, q(41) = 8.000; p(KW6002: no-stress vs. KW6002: CRS) = 0.1453, q(41) = 3.086) e, but did not affect the performance of mice in the OFT (n = 13, 11, 11 and 10 samples per group, respectively, one-way ANOVA, interaction p = 0.4239, F(1,41)=0.6524; p(Vehicle: no-stress vs. Vehicle: CRS) = 0.9736, t(41)=0.7555; p(Vehicle: no-stress vs. KW6002: no-stress)=0.9968, t(41) = 0.5051; p(Vehicle: CRS vs. KW6002: CRS) = 0.5406, t(41) = 1.581; p(KW6002: no-stress vs. KW6002: CRS) = 0.9991, t(41) = 0.3989) (f) (n = 13, 11, 11 and 10 samples per group, respectively, one-way ANOVA, interaction p = 0.7041, F(1,41) = 0.1463; p(Vehicle: no-stress vs. Vehicle: CRS) = 0.0674, q(41) = 3.602; p(Vehicle: no-stress vs. KW6002: no-stress) = 0.9034, q(41)=0.9643; p(Vehicle: CRS vs. KW6002: CRS) = 0.9994, q(41) = 0.1627; p(KW6002: no-stress vs. KW6002: CRS) = 0.2594, q(41) = 2.636) (g). Data were shown as mean ± SEM. *p < 0.05, ***p < 0.001, ****p < 0.0001; n.s., no significant difference. Source data are provided as a Source Data file.

Comment in

References

    1. Depression and Other Common Mental Disorders: Global Health Estimates. Geneva:World Health Organization; 2017. Licence: CC BY-NC-SA 3.0 IGO.
    1. Mental health atlas 2017. Geneva: World Health Organization; 2018. Licence: CC BY-NC-SA 3.0 IGO.
    1. Malhi GS, Mann JJ. Depression. Lancet. 2018;392:2299–2312. doi: 10.1016/S0140-6736(18)31948-2. - DOI - PubMed
    1. Chen JF, Eltzschig HK, Fredholm BB. Adenosine receptors as drug targets–what are the challenges? Nat. Rev. Drug Discov. 2013;12:265–286. doi: 10.1038/nrd3955. - DOI - PMC - PubMed
    1. Borea PA, Gessi S, Merighi S, Vincenzi F, Varani K. Pharmacology of adenosine receptors: the state of the art. Physiol. Rev. 2018;98:1591–1625. doi: 10.1152/physrev.00049.2017. - DOI - PubMed

Publication types

LinkOut - more resources