. 2023 Apr 5;13(1):5567.
doi: 10.1038/s41598-023-32154-x.

Interpretable machine learning approach for neuron-centric analysis of human cortical cytoarchitecture

Affiliations

Interpretable machine learning approach for neuron-centric analysis of human cortical cytoarchitecture

Andrija Štajduhar et al. Sci Rep. .

Abstract

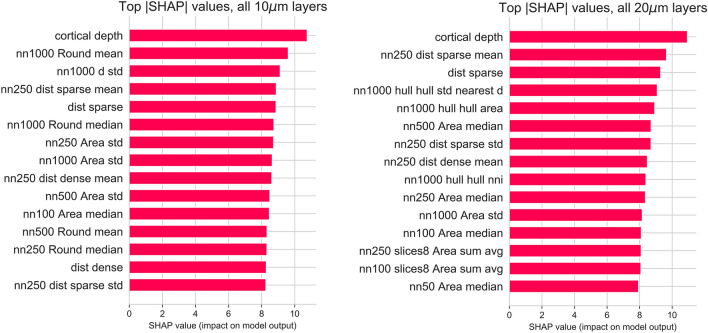
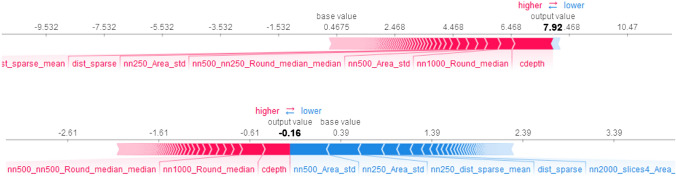
The complexity of the cerebral cortex underlies its function and distinguishes us as humans. Here, we present a principled veridical data science methodology for quantitative histology that shifts focus from image-level investigations towards neuron-level representations of cortical regions, with the neurons in the image as a subject of study, rather than pixel-wise image content. Our methodology relies on the automatic segmentation of neurons across whole histological sections and an extensive set of engineered features, which reflect the neuronal phenotype of individual neurons and the properties of neurons' neighborhoods. The neuron-level representations are used in an interpretable machine learning pipeline for mapping the phenotype to cortical layers. To validate our approach, we created a unique dataset of cortical layers manually annotated by three experts in neuroanatomy and histology. The presented methodology offers high interpretability of the results, providing a deeper understanding of human cortex organization, which may help formulate new scientific hypotheses, as well as to cope with systematic uncertainty in data and model predictions.


Conflict of interest statement

The authors declare no competing interests.

Figures

Figure 1
Figure 1
Histological slices stained with NeuN immunohistochemistry method showing varying neuronal morphology and cellular distribution across the layers of the cortex. The left image is taken from the dorsolateral part of the prefrontal cortex (thickness 10μm) and the right image was taken from the orbital part of the prefrontal cortex (thickness 20μm). Scale bar 100μm.
Figure 2
Figure 2
By visualizing the basic neuronal characteristic, the area, and local density, the laminar structure is revealed, as these features exhibit multimodal distributions. Left: Three types of neurons were distinguished by cell density in their surroundings: very sparse (blue), sparse (red), and dense (green). Middle: Larger (red) and smaller (green) neurons. Right: Average size of neighboring neurons is a feature obtained from the previous two: nearest neighboring neurons and their areas, which can also be used to facilitate layer prediction. Here, thresholds that separate the distributions were obtained using minimization of intraclass variance.
Figure 3
Figure 3
Neuron-centric analysis enables richer statistics. Shown here is the proportion of the top largest (left) and smallest (right) neurons found in the section, distributed per layer. The largest neurons were found in layer III of the cortex and were followed by neurons of layer V and layer VI. Out of the 50 largest neurons, 43(86%) were found in layer III, 5(10%) in layer V, and 2(4%) in layer VI. Out of the 500 largest neurons, 268(54%) were found in layer III, 142(28%) in layer V, 87(17%) in layer VI, and only 3(1%) in layer IV, which follows neuroanatomical observations.
Figure 4
Figure 4
Features based on the local density and convex hull radius are used to obtain tissue features without drawing profiles and sampling perpendicular to the cortex. Left: sparse areas are separated into layer I and white matter. Middle: cortical depth. Right: cortical thickness.
Figure 5
Figure 5
A detail of cortical layers manually delineated by the experts. Significant disagreement is observed on the boundaries of the layers, as well as on positioning the boundary between the cortex and the white matter.
Figure 6
Figure 6
Learning to map neuronal phenotype to cortical layers using a classical machine learning pipeline. The neuron representation, or phenotyping, is based on automatic neuron segmentation and analysis of morphological and textural features. This representation is then used as an input to a machine learning model which learned to solve the multiclass classification task by classifying neurons among the six layers of the cortex. The model learned the variations in neuronal features and was able to generalize, i.e. create consistent and sensible predictions of layers across the whole histological section. The black rectangle frames the portion of the section that was manually labeled by three experts and used as training data.
Figure 7
Figure 7
Importance of top 15 neuron features at the model level using the SHAP feature importance analysis for 10μm (left) and 20μm (right) sections. For the features that use properties of neighboring neurons, the number of the nearest neighbors is indicated at the start of the feature name. Regardless of differences in neuronal density, models on both sections preferred approximately a similar number of neurons in the nearest neighborhoods which were on average 500 neurons. For both sections, the cortical depth of a neuron was the most informative feature for machine learning models. Models in both sections also relied on features related to the size (Area) of neighboring neurons, as well as distances to areas of uniformly lower and higher densities. Individual shape and texture properties of neurons that do not take into account the neurons’ neighborhoods were the least informative and added no predictive value.
Figure 8
Figure 8
Contribution of different features for predicting a neuron’s layer can be analyzed at the instance-level, for each individual neuron. Top: neuron features of a single neuron of layer III that contributed to the increase from the base SHAP value and making the prediction. Bottom: the importance of features that decreased the output value for prediction of the same neuron as a layer II neuron.

References

    1. Brodmann K. Vergleichende Lokalisationslehre der Grosshirnrinde in ihren Prinzipien dargestellt auf Grund des Zellenbaues. Barth; 1909.
    1. Judaš M, Cepanec M, Sedmak G. Brodmann’s map of the human cerebral cortex-or Brodmann’s maps? Transl. Neurosci. 2012;3:67–74. doi: 10.2478/s13380-012-0009-x. - DOI
    1. von Economo CF, Koskinas GN. Die cytoarchitektonik der hirnrinde des erwachsenen menschen. Springer; 1925.
    1. Kaas JH. The functional organization of somatosensory cortex in primates. Ann. Anat. Anatomischer Anzeiger. 1993;175:509–518. doi: 10.1016/S0940-9602(11)80212-8. - DOI - PubMed
    1. Lutnick B, et al. An integrated iterative annotation technique for easing neural network training in medical image analysis. Nat. Mach. Intell. 2019;1:112–119. doi: 10.1038/s42256-019-0018-3. - DOI - PMC - PubMed

Publication types