. 2023 Apr 5;14(1):1739.
doi: 10.1038/s41467-023-37438-4.

Etiology of oncogenic fusions in 5,190 childhood cancers and its clinical and therapeutic implication

Affiliations

Etiology of oncogenic fusions in 5,190 childhood cancers and its clinical and therapeutic implication

Yanling Liu et al. Nat Commun. .

Abstract

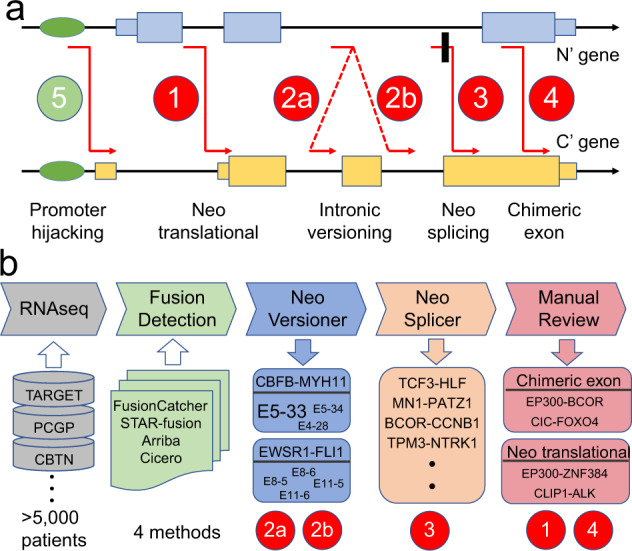
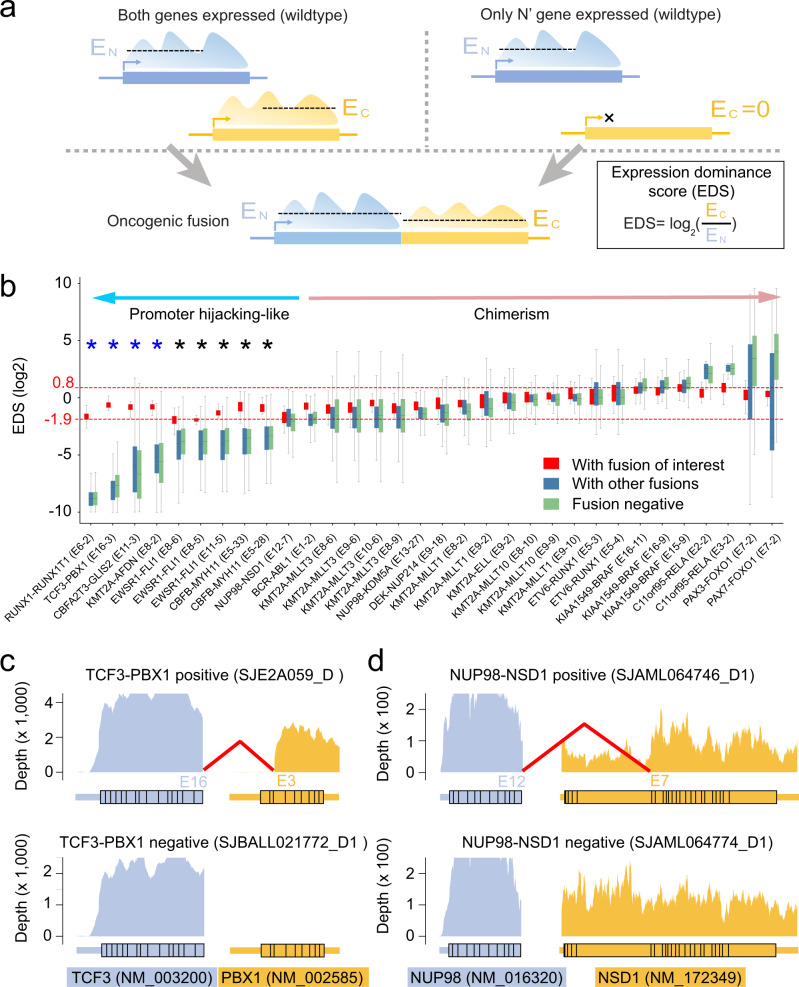
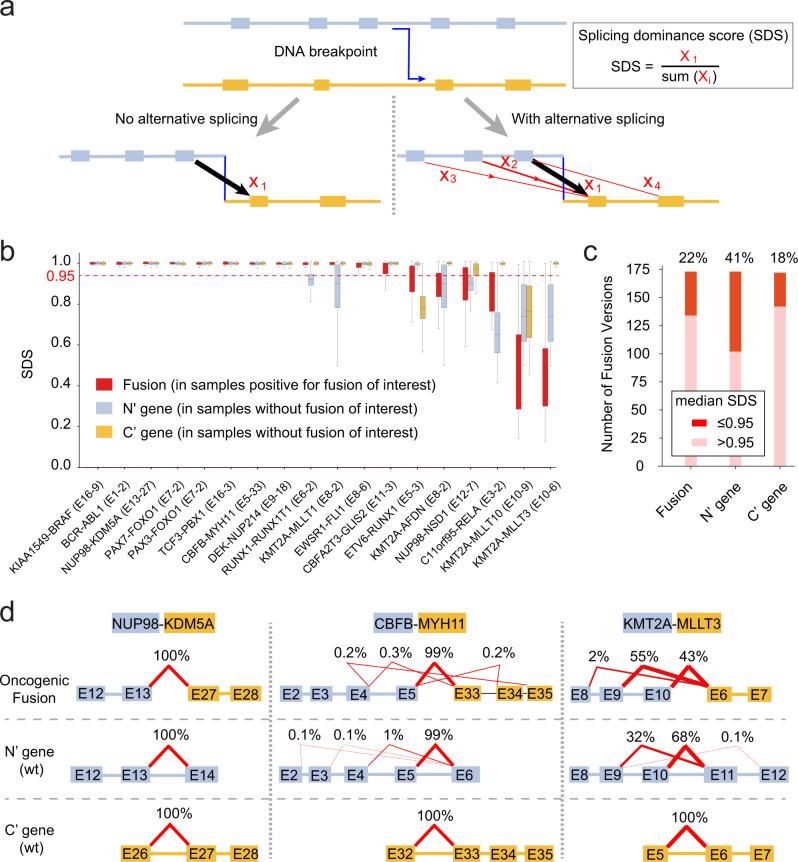
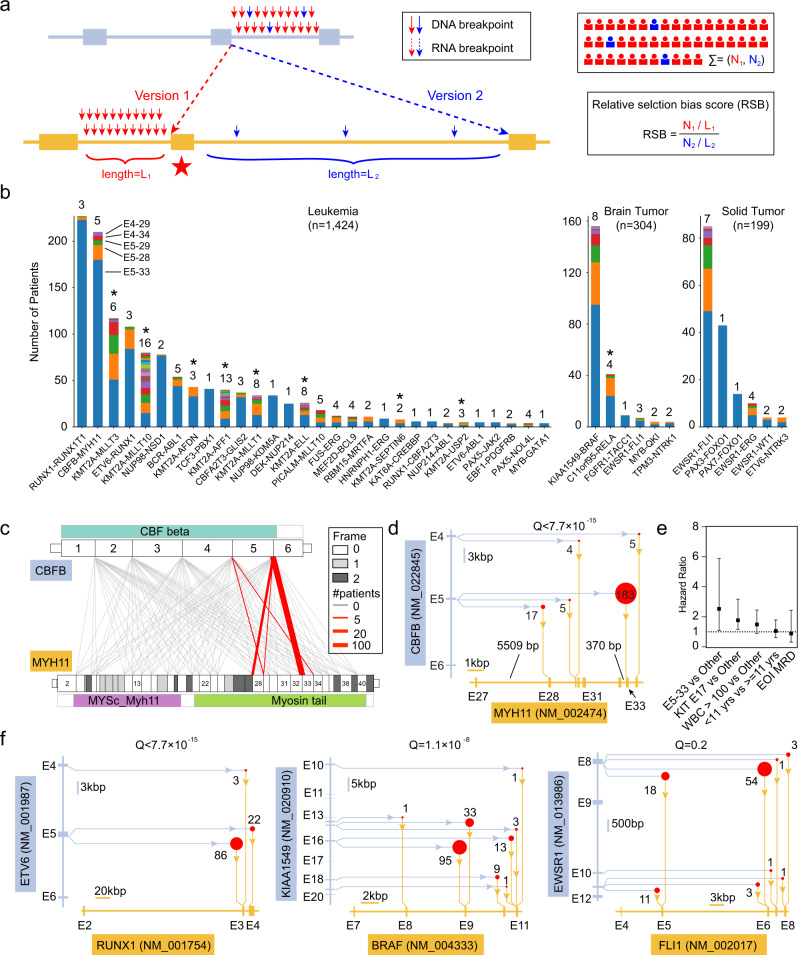
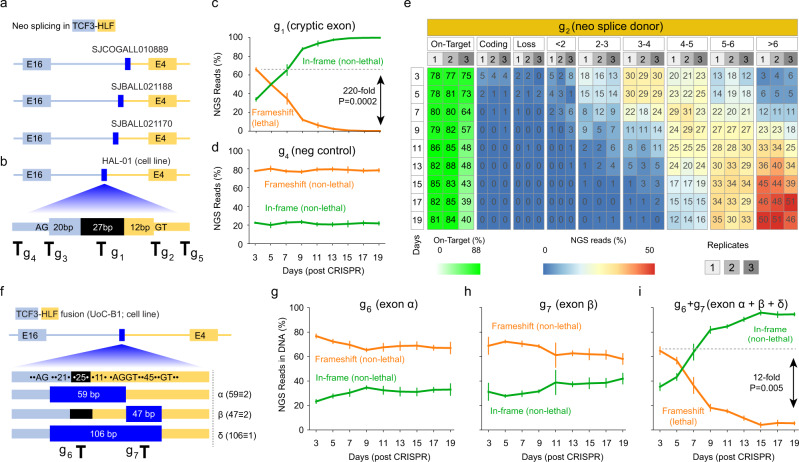
Oncogenic fusions formed through chromosomal rearrangements are hallmarks of childhood cancer that define cancer subtype, predict outcome, persist through treatment, and can be ideal therapeutic targets. However, mechanistic understanding of the etiology of oncogenic fusions remains elusive. Here we report a comprehensive detection of 272 oncogenic fusion gene pairs by using tumor transcriptome sequencing data from 5190 childhood cancer patients. We identify diverse factors, including translation frame, protein domain, splicing, and gene length, that shape the formation of oncogenic fusions. Our mathematical modeling reveals a strong link between differential selection pressure and clinical outcome in CBFB-MYH11. We discover 4 oncogenic fusions, including RUNX1-RUNX1T1, TCF3-PBX1, CBFA2T3-GLIS2, and KMT2A-AFDN, with promoter-hijacking-like features that may offer alternative strategies for therapeutic targeting. We uncover extensive alternative splicing in oncogenic fusions including KMT2A-MLLT3, KMT2A-MLLT10, C11orf95-RELA, NUP98-NSD1, KMT2A-AFDN and ETV6-RUNX1. We discover neo splice sites in 18 oncogenic fusion gene pairs and demonstrate that such splice sites confer therapeutic vulnerability for etiology-based genome editing. Our study reveals general principles on the etiology of oncogenic fusions in childhood cancer and suggests profound clinical implications including etiology-based risk stratification and genome-editing-based therapeutics.


Conflict of interest statement

X.M. is a named inventor on a pending patent application based in part on the research disclosed in this manuscript. The authors declare that they have no competing interests.

Figures

Fig. 1
Fig. 1. Model of fusion etiology and study design.
a Theoretical mechanisms of oncogenic fusion formation. Scenario 1: the DNA breakpoints (red lines) can lead to the fusion of coding exons (thick boxes) from N’ gene to 5’ untranslated region (UTR; thin boxes) of C’ gene and result in the conversion of the corresponding UTR into coding region, hence “neo-translational”. Scenario 2: the DNA breakpoints can lead to the fusion of a coding exon from N’ gene to multiple possible coding exons of C’ gene, hence “intronic versioning”. Scenario 3: the DNA breakpoints falling into a coding exon may disrupt the normal splice sites, and the cancer cell may utilize a neo-splice site to ensure the inclusion of the corresponding exon, hence “neo-splicing”. In this scenario, a cryptic exon (black box) might be created. Scenario 4: the DNA breakpoints may directly fuse two coding exons, hence “chimeric exon”. Scenario 5: a well-known phenomenon is promoter/enhancer hijacking, which is not studied in this work because it does not lead to chimeric protein. b. Study design. We analyzed tumor RNA sequencing data using four fusion detection methods, and classified the detected fusions into intronic versioning, neo-splicing, neo-translational, and chimeric exon (see Methods).
Fig. 2
Fig. 2. Fusion landscape in childhood cancers.
a Cohort composition. We analyzed 2638 leukemia (blue), 1459 brain tumors (yellow), and 1093 solid tumors (magenta), totaling 5190 childhood cancer patients. Percent patient tumors with oncogenic fusion detected are indicated with gray rings. bd Spectrum of neo-splicing (b), neo-translational (c) and chimeric exon (d) fusions. eg Spectrum of canonical fusions in leukemia (e), brain tumor (f) and solid tumor (g). In panels bg, bars are color-coded according to tumor types in panel a. Distribution of DNA breakpoints (light blue dots) for oncogenic fusions is uniformly distributed in corresponding intronic regions for EWSR1-FLI1 (h) and CBFB-MYH11 (i), but not for TCF3-PBX1 (j). P values (and Q values after Bonferroni correction for multiple testing) of the uniformity test (two-sided Kolmogorov–Smirnov test; see Methods) are indicated along with sample size in panels hj. k Prevalence of oncogenic fusions (y-axis) demonstrates a weak but marginally significant (P = 0.058) association with gene length (x-axis) in leukemia. l Statistically significant (P = 0.002) association between prevalence and gene length when the analysis is conditional on KMT2A-rearranged leukemia. Linear model, P value and R2 value are indicated for panels kl. Source data are provided accordingly as files ag, hj and kl in Source Data file.
Fig. 3
Fig. 3. Expression of oncogenic fusions.
a Expression model. For oncogenic fusions, promoters of N’ genes are constitutionally active, while promoters of the C’ gene may or may not be constitutionally active. We propose an expression dominance score (EDS) to measure the ratio of expression level (median sequencing depth) of chimeric portions between C’ gene and N’ gene for each tumor. b Distribution of EDS scores for oncogenic fusions in samples (of matched lineages) with the fusion of interest (red), with other fusions (blue), and negative for fusions (green). In boxplot, the lower, center and upper limits indicate 25th, 50th, and 75th percentile, respectively. Whisker is defined using 1.5 IQR. Dotted horizontal red lines indicate 95% confidence interval of EDS scores determined in fusion-positive samples. Based on EDS scores, oncogenic fusions were classified into promoter-hijacking-like and chimerism groups. Asterisks indicate Q value <0.01 (one-sided Wilcox rank sum test after Bonferroni correction for multiple testing, n = 32), where blue asterisks indicate C’ genes considered non-expressed in fusion-negative samples (FPKM <1; Supplementary Fig. 5c). Also illustrated are example samples from promoter-hijacking-like category where the chimeric portion of C’ gene is only expressed in the fusion-positive (top, E16-E3) samples (c), and from chimerism category where the chimeric portion of C’ gene is expressed in both fusion-positive (top, E12-E7) and fusion-negative (bottom) samples (d). Y-axis indicates RNA sequencing depth in panels c and d. Source data are provided accordingly as sheets b and c and d in Source Data file.
Fig. 4
Fig. 4. Alternative splicing in oncogenic fusions.
a Splicing model. The oncogenic fusion defined by a DNA breakpoint (blue line) may or may not be subject to alternative splicing (red lines). We propose a splicing dominance score (SDS) to measure the alternative splicing as a ratio of the count of splicing reads supporting the canonical splicing pattern (X1) to the count of splicing reads spanning both the N’ gene and the C’ gene (X1X4). A similar score is defined for the wildtype genes (Methods; Supplementary Fig. 6). b SDS score distribution for fusion genes (red) and wildtype N’ (blue) and C’ (orange) genes for 18 intronic versioning with recurrence ≥10, where alternative splicing (SDS <0.95, red dashed line) is observed in 6 (33% of 18) fusions. In boxplot, the lower, center and upper limits indicate 25th, 50th, and 75th percentile, respectively. Whisker is defined using 1.5 IQR. c A similar extent of alternative splicing is observed in 183 intronic versions with recurrence >2. d Example oncogenic fusions and splicing patterns. Splicing patterns for wildtype N’ (blue) and C’ genes (orange) are also presented. Black connections indicate canonical splicing, while red connections indicate alternative splicing. Source data are provided in sheets bd in Source Data file.
Fig. 5
Fig. 5. Selection bias in oncogenic fusions.
a Model of selection. DNA breakpoints from the same intron have equivalent selection pressure because they generate the same fusion proteins. DNA breakpoints from different introns may have different selection pressure when the variable exon (red star) encodes critical protein domains and the corresponding intron may have disproportionally more patients than other introns. We propose a relative selection bias (RSB) score to measure such imbalance by accounting for patient counts (N) and intronic lengths (L) for intronic versions (red vs blue). b Spectrum of intronic versioning (colored bands within bar) across leukemia, brain, and solid tumors. Oncogenic fusions may have a single version (TCF3-PBX1) or multiple versions (number of versions labeled on top of each bar). Colors indicate different versions (exact fusion versions are indicated for CBFB-MYH11). Oncogenic fusions with alternative splicing are indicated by asterisks (*) and excluded from selection bias analysis. c Theoretically possible (gray lines) and observed (red lines) intronic versions in CBFB-MYH11. We define the translation frames (0, 1, 2) for each exon by using the frame position of its first nucleotide. A functional oncogenic fusion can only be generated by connecting translationally compatible exons (gray lines). Due to additional requirement of protein domains (e.g., Myosin Tail domain in MYH11), only a subset of translationally compatible fusions can result in tumorigenesis (red lines), although patient prevalence can be dramatically different (thickness of red lines). d Analysis of selection pressure in CBFB-MYH11. Version E5-33 has a disproportionally high number of patients (n = 183) than version E5-28 (n = 17) although the corresponding intron 32 of MYH11 has a length of 370 bps and intron 27 has a length of 5509 bps, indicating a strong selection bias (RBS = 160.3) between E5-33 and E5-28 (with a χ2 test Q value <7.7 × 10–15). e Intronic versioning (E5-33) better predicts event-free survival (measured as hazard ratio) than known clinical features (KIT mutation status, while blood counts, age, and end of induction (EOI) MRD) for CBFB-MYH11-positive AML patients. Error bars represent hazard ratio ± 95% confidence interval. f Analysis of selection bias in ETV6-RUNX1, KIAA1549-BRAF, and EWSR1-FLI1 fusions. In panels d and f, x-axes are the C’ genes, and y-axes are the N’ genes. Exon/intron lengths are indicated with scale bars in corresponding figures. Sizes of red dots are proportional to the number of patients for corresponding versions, and χ2 test Q values (with Bonferroni correction for multiple testing) are indicated for each panel. Source data are provided accordingly as sheets b and c, and d, f and I in Source Data file.
Fig. 6
Fig. 6. Neo-splicing in oncogenic fusions and genome-editing-based therapeutic targeting.
a In our cohort, all samples with TCF3-HLF fusions harbor neo-splicing events due to incompatible exon frames between TCF3 exon 16 and HLF exon 4 (Supplementary Fig. 7e). b We confirmed B-ALL cell line HAL-01 (DSMZ#: ACC 610) also harbors this pattern and designed guide RNAs to target the cryptic exon (g1) and the neo-splice sites (g2 and g3) as well as negative control guides (g4: 199 bps upstream of g3; g5: 52 bps downstream of g2). Black shading indicates non-template insertion sequence (27 bp). c Cryptic exon is essential to HAL-01 by CRIPSR targeting using guide g1, which leads to a 220-fold decrease of cells with lethal editing (two-sided t-test; P value = 0.0002; n = 3). Shown are percentages (y-axis) of putative lethal (orange) and non-lethal (green) editing measured using NGS reads as a function of time from day 3 to day 19 (x-axis) post editing for three replicates (error bars indicate standard deviation). Indels leading to frameshift of fusion transcripts are called lethal and in-frame indels are called non-lethal. d Negative control guide (g4) that targets the upstream intronic region of the cryptic exon. Similar as panel c, percentage of putative lethal (frameshift; orange) and non-lethal (in-frame; green) editing measured by using NGS reads are shown from day 3 to day 19. e Neo-splice donor is essential to HAL-01 by CRISPR targeting using guide g2. The induced indels that happened to fall into the coding region and lead to frameshift of TCF3-HLF are categorized into “Coding” group. Indels that directly disrupt the splice donor site are categorized into “Loss” group. Most of the induced indels leave a residual GT that may still serve as a splice donor. The binding affinity of these residual donors is calculated using the position weight matrix (PWM) approach (see Methods) and the binding affinity scores are categorized into different bins (<2, 2–3, etc.). The percentage of NGS reads carrying induced indels are calculated for each bin from day 3 to day 19 post editing for three replicates. Also illustrated are on-target editing rate (green heatmap). f CRISPR targeting in the presence of alternative splicing. B-ALL cell line UoC-B1 also harbors TCF3-HLF fusion. However, in this fusion, we detected three neo-splicing patterns, α, β, and δ, where the first two splicing patterns can generate in-frame fusion proteins in the parental cells and δ cannot. We designed two guides (g6 and g7) to test the potential compensatory function of these isoforms. g, h Single guide editing led to marginal depletion of edited cells from day 3 to day 19 for putative lethal indels (orange) that can disrupt corresponding transcripts. i Double guide editing. Indels with putative lethal effect (orange) demonstrated a quick decrease (12-fold; two-sided t-test; P value = 0.005; n = 3) in abundance from day 3 to day 19, while indels with putative non-lethal effect demonstrated an increasing abundance. Data value and error bar at each time point represent mean of putative indels (orange for lethal; green for non-lethal as control) and standard deviation from three replicates in panels c and d and panels gi. Source data are provided accordingly as sheets a, b and ce in Source Data file.

References

    1. Nowell, P. & Hungerford, D. A minute chromosome in human chronic granulocytic leukemia [abstract]. Science132, 1497 (1960).
    1. Rowley JD. Letter: A new consistent chromosomal abnormality in chronic myelogenous leukaemia identified by quinacrine fluorescence and Giemsa staining. Nature. 1973;243:290–293. doi: 10.1038/243290a0. - DOI - PubMed
    1. Kandoth C, et al. Mutational landscape and significance across 12 major cancer types. Nature. 2013;502:333–339. doi: 10.1038/nature12634. - DOI - PMC - PubMed
    1. Lawrence MS, et al. Discovery and saturation analysis of cancer genes across 21 tumour types. Nature. 2014;505:495–501. doi: 10.1038/nature12912. - DOI - PMC - PubMed
    1. Zack TI, et al. Pan-cancer patterns of somatic copy number alteration. Nat. Genet. 2013;45:1134–1140. doi: 10.1038/ng.2760. - DOI - PMC - PubMed

Publication types

Substances