. 2023 Sep;33(5):757-765.
doi: 10.1038/s41370-023-00545-x. Epub 2023 Apr 5.

Associations of perfluoroalkyl substances (PFAS) with lipid and lipoprotein profiles

Affiliations

Associations of perfluoroalkyl substances (PFAS) with lipid and lipoprotein profiles

Marianne Haug et al. J Expo Sci Environ Epidemiol. 2023 Sep.

Abstract

Background: Perfluoroalkyl substances (PFAS) are man-made chemicals with unique properties that are widely distributed in humans and the environment. Recent studies suggest that PFAS are involved in cholesterol metabolism, however, the mechanisms underlying the associations are poorly understood.

Objective: We aimed to evaluate associations of plasma PFAS with detailed lipid and lipoprotein subfractions in an adult population of men and women.

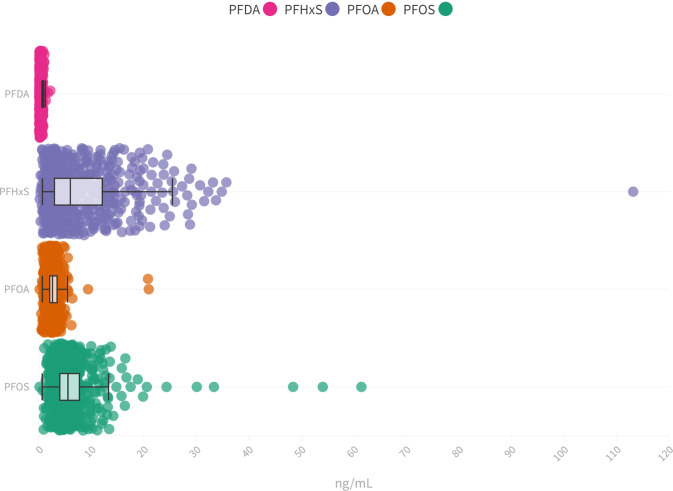
Methods: We measured concentrations of cholesterol and triglycerides in lipoprotein subfractions, apolipoprotein subclasses, as well as fatty acid and different phospholipid measures, using serum proton nuclear magnetic resonance (1H-NMR), and four plasma PFAS using liquid chromatography-mass spectrometry (UHPLC-MS/MS). Measurements were available for 493 participants (all aged 50 years, 50% female). Multivariable linear regression was used to estimate the association of four PFAS with 43 different 1H-NMR measures, with adjustment for body mass index (BMI), smoking, education, and physical activity.

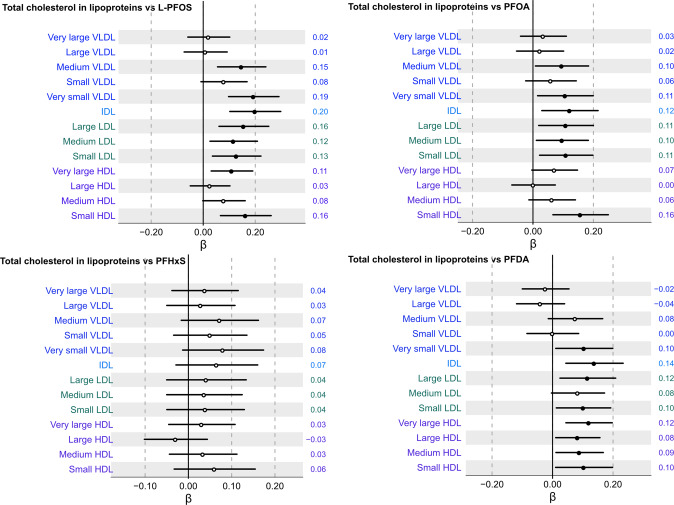
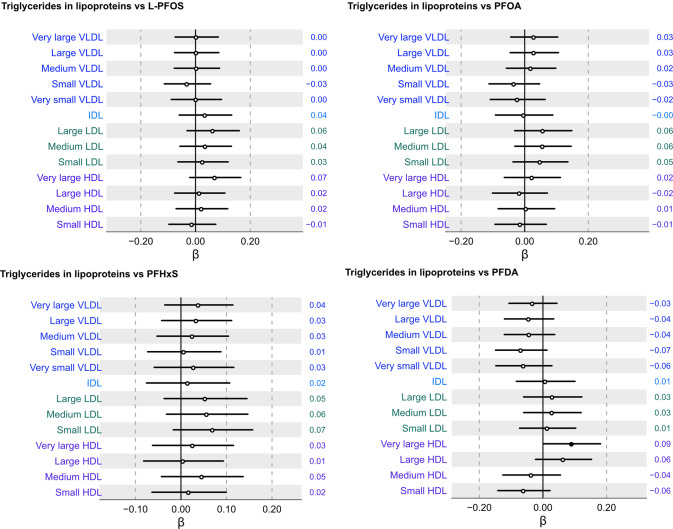
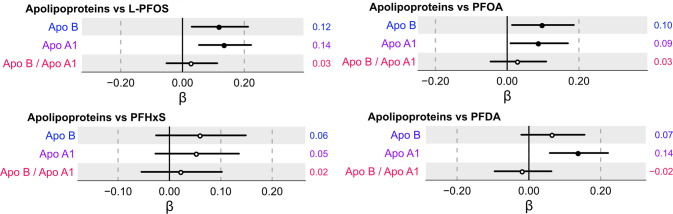
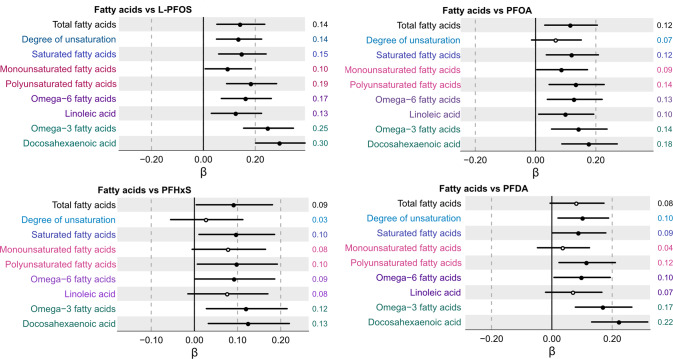
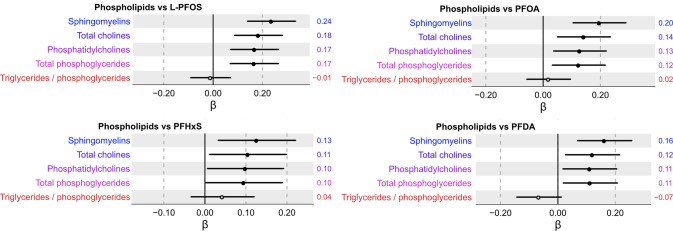
Results: We found that perfluorooctanesulfonic acid (PFOS), perfluorooctanoic acid (PFOA), perfluorodecanoic acid (PFDA), but not perfluorohexanesulfonate (PFHxS), concentrations were consistently positively associated with concentrations of cholesterol in lipoprotein subfractions, apolipoproteins, as well as composite fatty acid- and phospholipid profiles. The most consistent associations were found for the relationship of PFAS with total cholesterol in intermediate-density lipoprotein (IDL), across all low-density lipoprotein (LDL) subfractions and small high-density lipoprotein (HDL). Moreover, we found weak to null evidence for an association of any of the measured 13 triglyceride lipoprotein subfractions with PFAS.

Conclusions: Our results suggest that plasma PFAS concentrations are associated with cholesterol in small HDL, IDL and all LDL subfractions, as well as apolipoproteins and composite fatty acid and phospholipid profiles but to a lesser extent with triglycerides in lipoproteins. Our findings draw attention to the need for more detailed measurements of lipids across various lipoprotein subfractions and subclasses in assessing the role of PFAS in lipid metabolism.

Impact: By performing an in-depth characterization of circulating cholesterol and triglycerides in lipoprotein subfractions, apolipoprotein, fatty acid, and phospholipid concentrations, this study has expanded upon the limited literature available on the associations of plasma PFAS concentrations beyond clinical routine laboratory testing for lipids.

Keywords: Perfluoroalkyl substances; Human health; Lipoproteins; Cholesterol; Apolipoproteins; Protonnuclear magnetic resonance.


Conflict of interest statement

The authors declare no competing interests.

Figures

Fig. 1
Fig. 1. Distribution of investigated PFAS in the study population.
Distribution of L-PFOS (median 5.10 ng/mL, IQR 3.50–7.24 ng/mL), PFOA (median 2.14 ng/mL, IQR 1.60–3.0 ng/mL), PFHxS (median 5.5 ng/mL, IQR 2.50–11.61 ng/mL), and PFDA (median 0.34 ng/mL, IQR 0.25–0.45 ng/mL) plasma concentrations in the POEM cohort.
Fig. 2
Fig. 2. Association between serum concentrations of total cholesterol across thirteen lipoprotein subfractions and L-PFOS, PFOA, PFHxS, and PFDA following multiple adjustment and multiple correction.
Beta coefficient intercepts are shown together with 95% confidence interval lines where the black dots indicate statistically significant associations (PFDR < 0.05) and white dots non-significant associations, respectively. The estimated beta-coefficients (β) are provided to the right of each row in the forest plot.
Fig. 3
Fig. 3. Association between serum concentrations of triglycerides across thirteen lipoprotein subfractions and L-PFOS, PFOA, PFHxS, and PFDA following multiple adjustment and multiple correction.
Beta coefficient intercepts are shown together with 95% confidence interval lines where the black dots indicate statistically significant associations (PFDR < 0.05) and white dots non-significant associations, respectively. The estimated beta-coefficients (β) are provided to the right of each row in the forest plot.
Fig. 4
Fig. 4. Association between serum concentrations of individual apolipoproteins (Apo B and Apo A1) and the ratio of Apo B/Apo A1 with L-PFOS, PFOA, PFHxS, and PFDA following multiple adjustment and multiple correction.
Beta coefficient intercepts are shown together with 95% confidence interval lines where the black dots indicate statistically significant associations (PFDR < 0.05) and white dots non-significant associations, respectively. The estimated beta-coefficients (β) are provided to the right of each row in the forest plot.
Fig. 5
Fig. 5. Association between serum concentrations of individual and composite fatty acid measures and L-PFOS, PFOA, PFHxS, and PFDA following multiple adjustment and multiple correction.
Beta coefficient intercepts are shown together with 95% confidence interval lines where the black dots indicate statistically significant associations (PFDR < 0.05) and white dots non-significant associations, respectively. The estimated beta-coefficients (β) are provided to the right of each row in the forest plot.
Fig. 6
Fig. 6. Association between serum concentrations of composite phospholipid measures and L-PFOS, PFOA, PFHxS, and PFDA following multiple adjustment and multiple correction.
Beta coefficient intercepts are shown together with 95% confidence interval lines where the black dots indicate statistically significant associations (PFDR < 0.05) and white dots non-significant associations, respectively. The estimated beta-coefficients (β) are provided to the right of each row in the forest plot.

References

    1. Schrenk D, Bignami M, Bodin L, Chipman JK, Mazo JD, Grasl-Kraupp B, et al. Risk to human health related to the presence of perfluoroalkyl substances in food. EFSA J. 2020;18:e06223. - PMC - PubMed
    1. Ahrens L, Bundschuh M. Fate and effects of poly- and perfluoroalkyl substances in the aquatic environment: a review. Environ Toxicol Chem. 2014;33:1921–9. doi: 10.1002/etc.2663. - DOI - PubMed
    1. Girardi P, Merler E. A mortality study on male subjects exposed to polyfluoroalkyl acids with high internal dose of perfluorooctanoic acid. Environ Res. 2019;179:108743. doi: 10.1016/j.envres.2019.108743. - DOI - PubMed
    1. Trowbridge J, Gerona RR, Lin T, Rudel RA, Bessonneau V, Buren H, et al. Exposure to perfluoroalkyl substances in a cohort of women firefighters and office workers in San Francisco. Environ Sci Technol. 2020;54:3363–74. doi: 10.1021/acs.est.9b05490. - DOI - PMC - PubMed
    1. Papadopoulou E, Sabaredzovic A, Namork E, Nygaard UC, Granum B, Haug LS. Exposure of Norwegian toddlers to perfluoroalkyl substances (PFAS): The association with breastfeeding and maternal PFAS concentrations. Environ Int. 2016;94:687–94. doi: 10.1016/j.envint.2016.07.006. - DOI - PubMed

Publication types