. 2023 Apr;616(7955):159-167.
doi: 10.1038/s41586-023-05874-3. Epub 2023 Apr 5.

Lung adenocarcinoma promotion by air pollutants

William Hill #  1 Emilia L Lim #  1   2 Clare E Weeden #  1 Claudia Lee  1   2   3 Marcellus Augustine  1   2   3   4 Kezhong Chen  2   5 Feng-Che Kuan  6   7 Fabio Marongiu  8   9 Edward J Evans Jr  8 David A Moore  1   2   10 Felipe S Rodrigues  11 Oriol Pich  1 Bjorn Bakker  1 Hongui Cha  2   12 Renelle Myers  13 Febe van Maldegem  14   15 Jesse Boumelha  14 Selvaraju Veeriah  2 Andrew Rowan  1 Cristina Naceur-Lombardelli  2 Takahiro Karasaki  1   2   16 Monica Sivakumar  2 Swapnanil De  2 Deborah R Caswell  1 Ai Nagano  1   2 James R M Black  2   17 Carlos Martínez-Ruiz  2   17 Min Hyung Ryu  18 Ryan D Huff  18 Shijia Li  18 Marie-Julie Favé  19 Alastair Magness  1   2 Alejandro Suárez-Bonnet  20   21 Simon L Priestnall  20   21 Margreet Lüchtenborg  22   23 Katrina Lavelle  22 Joanna Pethick  22 Steven Hardy  22 Fiona E McRonald  22 Meng-Hung Lin  24 Clara I Troccoli  8   25 Moumita Ghosh  26 York E Miller  26   27 Daniel T Merrick  28 Robert L Keith  26   27 Maise Al Bakir  1   2 Chris Bailey  1 Mark S Hill  1 Lao H Saal  29   30 Yilun Chen  29   30 Anthony M George  29   30 Christopher Abbosh  2 Nnennaya Kanu  2 Se-Hoon Lee  12 Nicholas McGranahan  2   17 Christine D Berg  31 Peter Sasieni  32 Richard Houlston  33 Clare Turnbull  33 Stephen Lam  13 Philip Awadalla  19 Eva Grönroos  1 Julian Downward  14 Tyler Jacks  34   35 Christopher Carlsten  18 Ilaria Malanchi  11 Allan Hackshaw  36 Kevin Litchfield  2   4 TRACERx ConsortiumJames DeGregori  8 Mariam Jamal-Hanjani  2   16   37 Charles Swanton  38   39   40
Collaborators, Affiliations

Lung adenocarcinoma promotion by air pollutants

William Hill et al. Nature. 2023 Apr.

Abstract

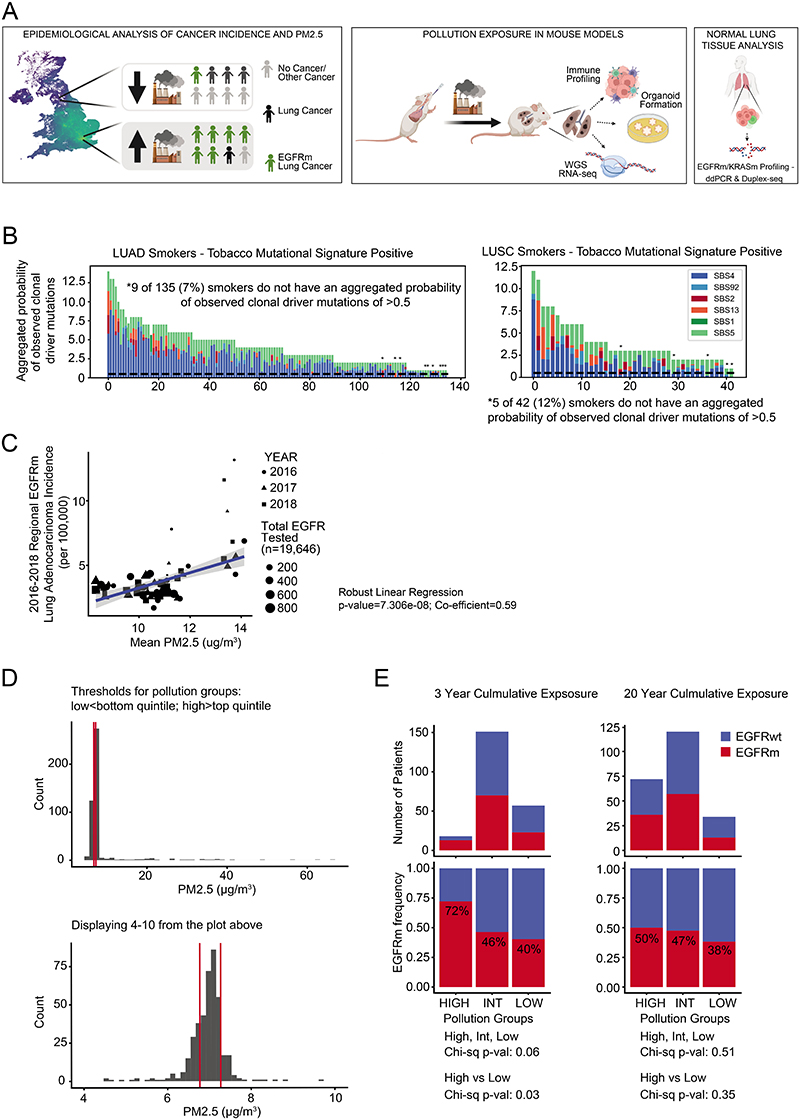
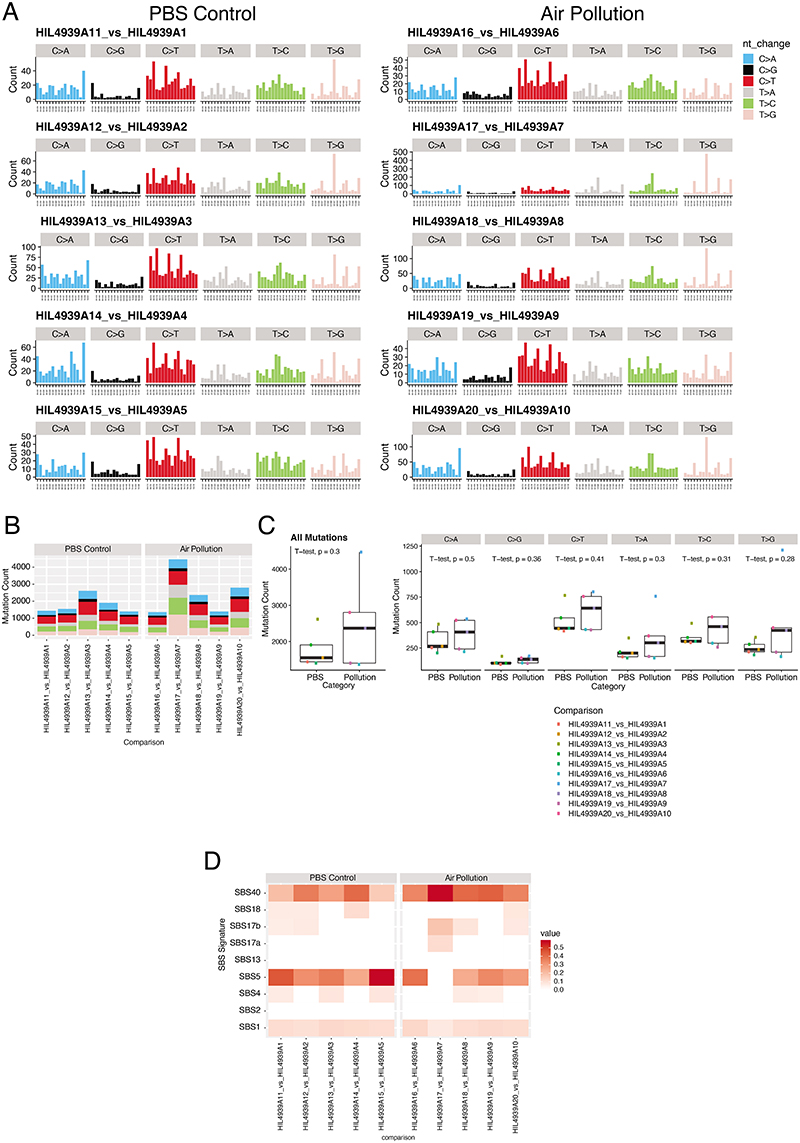
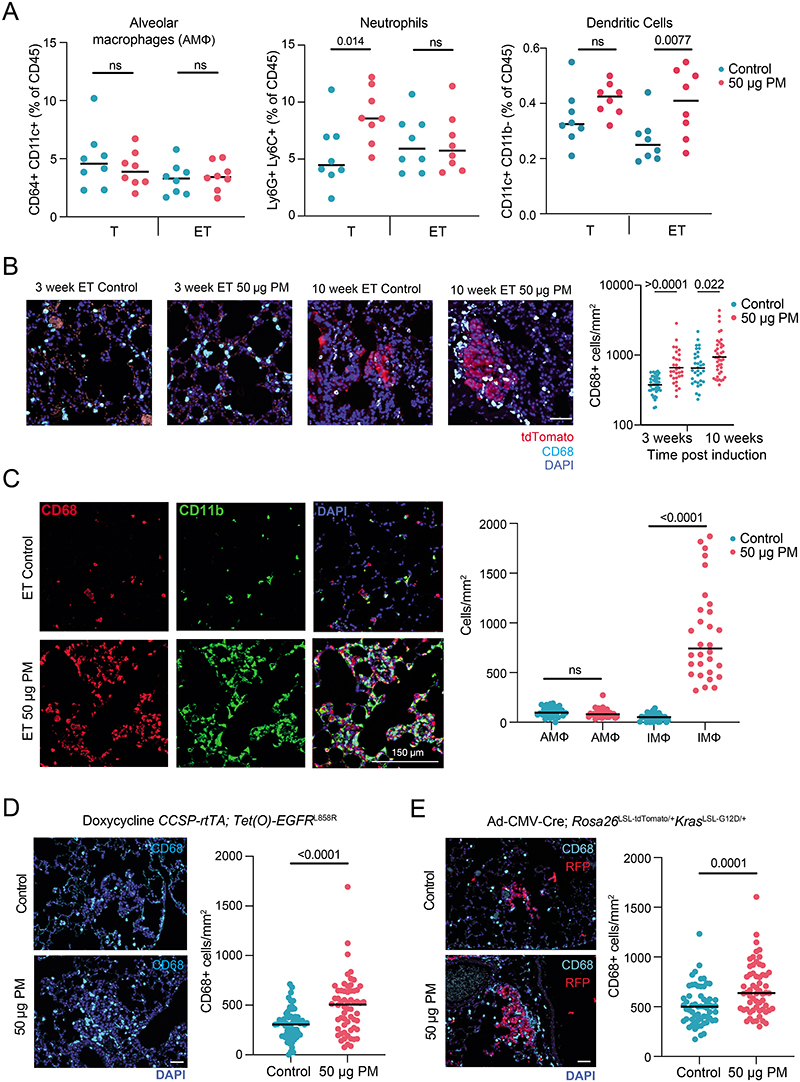
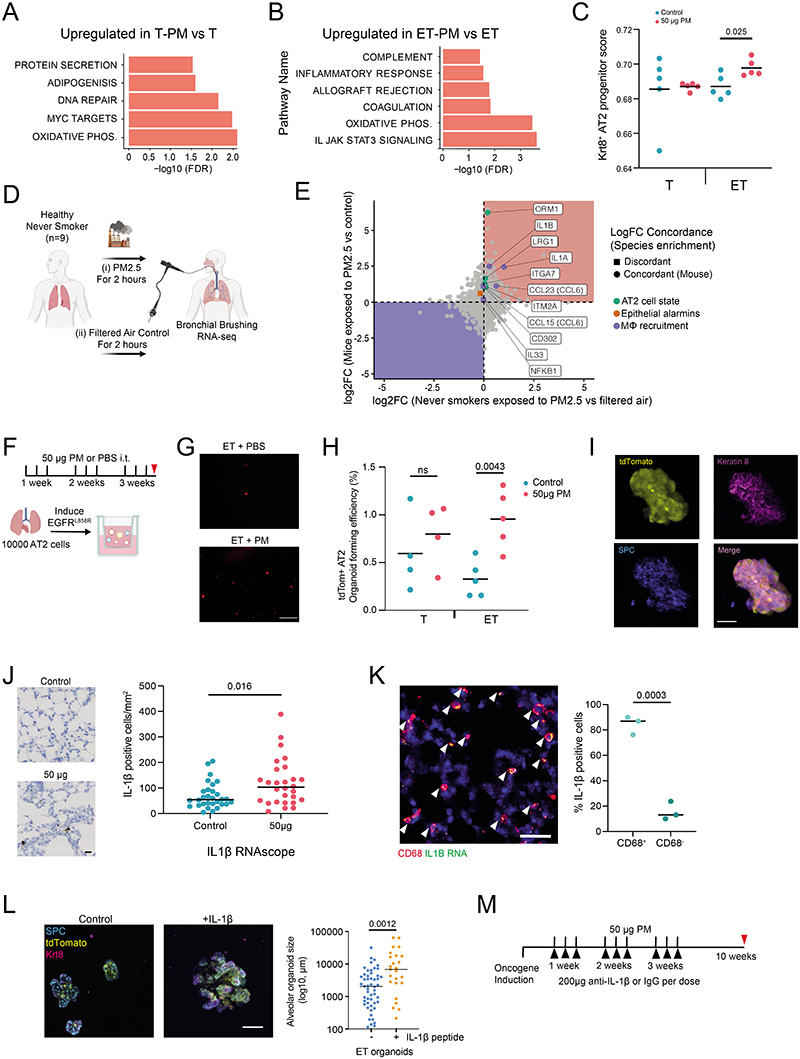
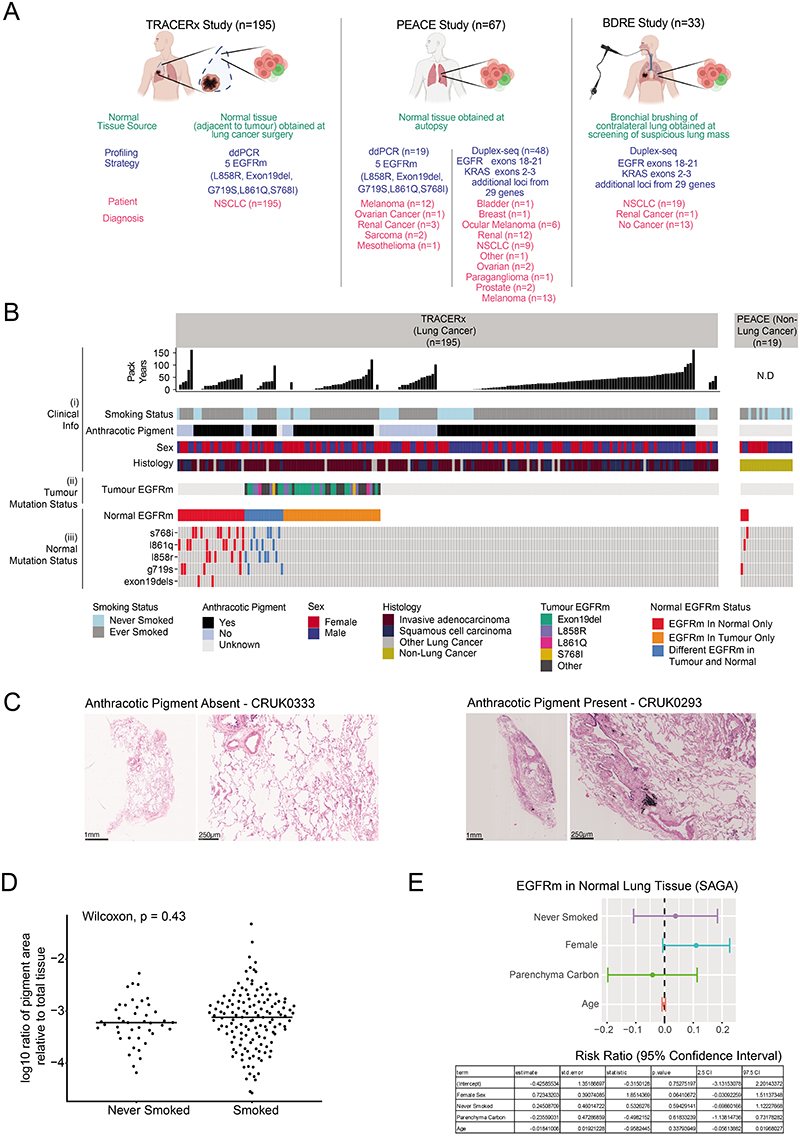
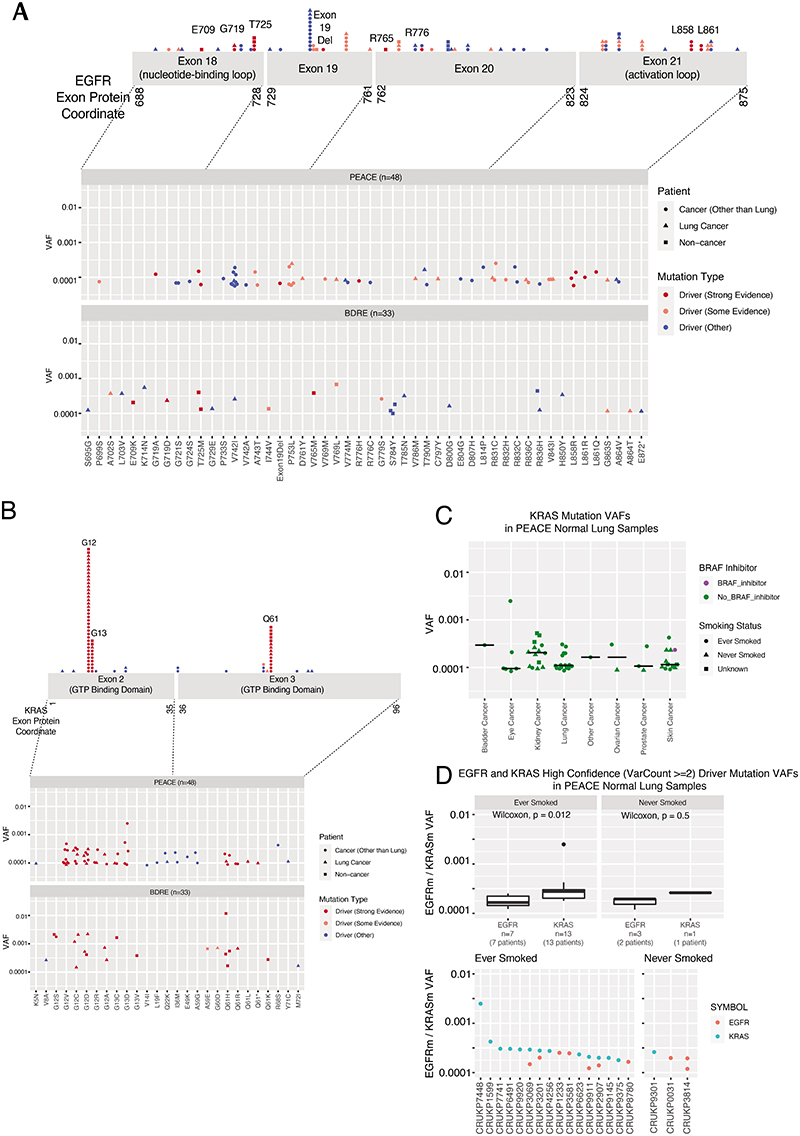
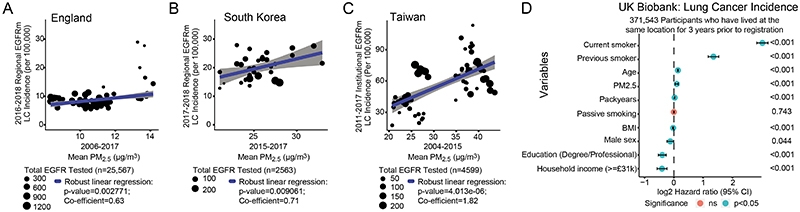
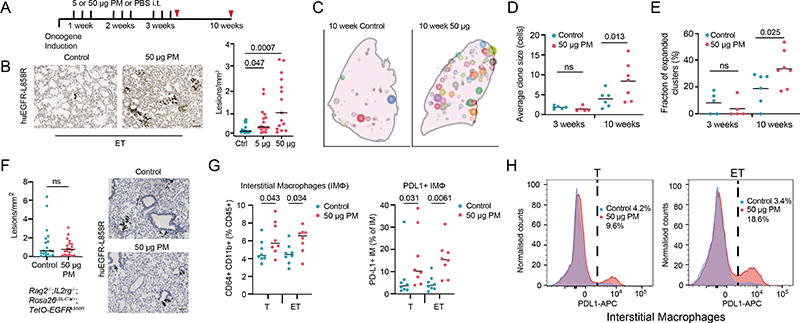
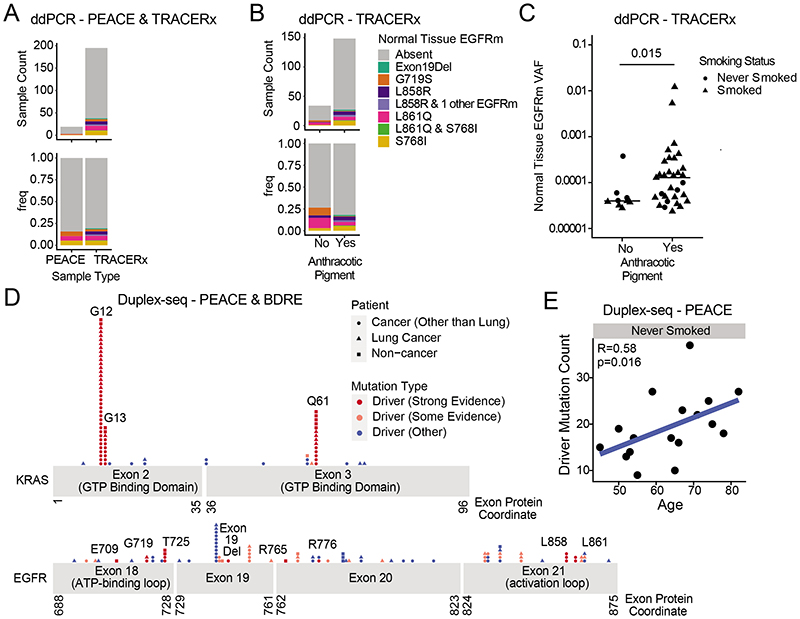
A complete understanding of how exposure to environmental substances promotes cancer formation is lacking. More than 70 years ago, tumorigenesis was proposed to occur in a two-step process: an initiating step that induces mutations in healthy cells, followed by a promoter step that triggers cancer development1. Here we propose that environmental particulate matter measuring ≤2.5 μm (PM2.5), known to be associated with lung cancer risk, promotes lung cancer by acting on cells that harbour pre-existing oncogenic mutations in healthy lung tissue. Focusing on EGFR-driven lung cancer, which is more common in never-smokers or light smokers, we found a significant association between PM2.5 levels and the incidence of lung cancer for 32,957 EGFR-driven lung cancer cases in four within-country cohorts. Functional mouse models revealed that air pollutants cause an influx of macrophages into the lung and release of interleukin-1β. This process results in a progenitor-like cell state within EGFR mutant lung alveolar type II epithelial cells that fuels tumorigenesis. Ultradeep mutational profiling of histologically normal lung tissue from 295 individuals across 3 clinical cohorts revealed oncogenic EGFR and KRAS driver mutations in 18% and 53% of healthy tissue samples, respectively. These findings collectively support a tumour-promoting role for PM2.5 air pollutants and provide impetus for public health policy initiatives to address air pollution to reduce disease burden.


Conflict of interest statement

Competing interests

M.A.B. has consulted for Achilles Therapeutics. L.H.S., Y.C. and A.M.G. have ownership interest in SAGA Diagnostics. S.V. is a co-inventor to a patent to detecting molecules in a sample (US patent 10578620). D.A.M. reports speaker fees from AstraZeneca, Eli Lilly and Takeda, consultancy fees from AstraZeneca, Thermo Fisher, Takeda, Amgen, Janssen, MIM Software, Bristol-Myers Squibb and Eli Lilly, and has received educational support from Takeda and Amgen. C.A. has received speaking honoraria or expenses from Novartis, Roche, AstraZeneca and Bristol-Myers Squibb and reports employment at AstraZeneca. C.A. is an inventor on a European patent application relating to assay technology to detect tumour recurrence (PCT/GB2017/053289). The patent has been licensed to commercial entities and under their terms of employment, C.A is due a revenue share of any revenue generated from such licence(s). C.A. declares a patent application (PCT/US2017/028013) for methods to detect lung cancer. C.A. is a named inventor on a patent application to determine methods and systems for tumour monitoring (PCT/EP2022/077987). T.J. is a member of the Board of Directors of Amgen and Thermo Fisher Scientific, and a co-Founder of Dragonfly Therapeutics and T2 Biosystems. T.J. serves on the Scientific Advisory Board (SAB) of Dragonfly Therapeutics, SQZ Biotech and Skyhawk Therapeutics. T.J. is also President of Break Through Cancer. K. Litchfield has a patent on indel burden and CPI response pending and speaker fees from Roche tissue diagnostics, research funding from CRUK TDL–Ono–LifeArc alliance, Genesis Therapeutics, and consulting roles with Ellipses Pharma, Monopteros and Kynos Therapeutics. N.M. has received consultancy fees and has stock options in Achilles Therapeutics. N.M. holds European patents relating to targeting neoantigens (PCT/EP2016/059401), identifying patient response to immune checkpoint blockade (PCT/EP2016/071471), determining HLA LOH (PCT/GB2018/052004), and predicting survival rates of patients with cancer (PCT/GB2020/050221). C.T. has received honoraria for educational activities and advisory boards from AstraZeneca and Roche (all proceeds donated to registered charity 11511580). C.D.B. has consultantships with GRAIL, LLC, NHS Galleri Trial, IDMC, Mercy BioAnalytics, Lucid DX and Medial EarlySign. J. Downward has acted as a consultant for AstraZeneca, Jubilant, Theras, Roche and Vividion and has funded research agreements with Bristol-Myers Squibb, Revolution Medicines and AstraZeneca. A.H. has received fees for being a member of Independent Data Monitoring Committees for Roche-sponsored clinical trials, and academic projects co-ordinated by Roche. M.J.-H. is a CRUK Career Establishment Awardee and has received funding from CRUK, NIH National Cancer Institute, IASLC International Lung Cancer Foundation, Lung Cancer Research Foundation, Rosetrees Trust, UKI NETs, NIHR, NIHR UCLH Biomedical Research Centre. M.J.-H. has consulted for, and is a member of, the Achilles Therapeutics Scientific Advisory Board and Steering Committee, has received speaker honoraria from Pfizer, Astex Pharmaceuticals, Oslo Cancer Cluster, Bristol Myers Squibb, and is co-inventor on a European patent application relating to methods to detect lung cancer PCT/US2017/028013).M.G., Y.E.M., R.L.K. and D.T.M. acknowledge grant support from Bristol-Myers Squibb. C.S. acknowledges grant support from AstraZeneca, Boehringer-Ingelheim, Bristol-Myers Squibb, Pfizer, Roche-Ventana, Invitae (previously Archer Dx Inc-collaboration in minimal residual disease sequencing technologies), and Ono Pharmaceutical. C.S. is an AstraZeneca Advisory Board member and Chief Investigator for the AZ MeRmaiD 1 and 2 clinical trials and is also Co-Chief Investigator of the NHS Galleri trial funded by GRAIL and a paid member of GRAIL's SAB. He receives consultant fees from Achilles Therapeutics (also SAB member), Bicycle Therapeutics (also a SAB member), Genentech, Medicxi, Roche Innovation Centre–Shanghai, Metabomed (until July 2022), and the Sarah Cannon Research Institute. He had stock options in Apogen Biotechnologies and GRAIL until June 2021, and currently has stock options in Epic Bioscience, Bicycle Therapeutics, and has stock options and is co-founder of Achilles Therapeutics. C.S. is an inventor on a European patent application relating to assay technology to detect tumour recurrence (PCT/GB2017/053289), the patent has been licensed to commercial entities, and under his terms of employment, C.S. is due a revenue share of any revenue generated from such licence(s). C.S. holds patents relating to targeting neoantigens (PCT/EP2016/059401), identifying patient response to immune checkpoint blockade (PCT/EP2016/071471), determining HLA LOH (PCT/GB2018/052004), predicting survival rates of patients with cancer (PCT/GB2020/050221), identifying patients who respond to cancer treatment (PCT/GB2018/051912), a US patent relating to detecting tumour mutations (PCT/US2017/28013), methods for lung cancer detection (US20190106751A1) and both a European and US patent related to identifying insertion/deletion mutation targets (PCT/GB2018/051892) and is co-inventor to a patent application to determine methods and systems for tumour monitoring (PCT/EP2022/077987). C.S has received honoraria from Amgen, AstraZeneca, Pfizer, Novartis, GlaxoSmithKline, MSD, Bristol Myers Squibb, Illumina, and Roche-Ventana.

Figures

Extended Data Figure 1
A) Study design schematic featuring the 3 aspects of the paper. LEFT: Epidemiological analysis of cancer incidence and PM2.5. MIDDLE: Pollution exposure in mouse models. RIGHT: Normal lung tissue analysis. B) TX421 Tumours from Smokers. Barplots indicating proportion of SNVs in each tumour attributed to each SBS mutational signature. The barplots (Top: Lung adenocarcinoma (LUAD), Bottom: Lung sqaumous cell carcinoma (LUSC)) reflect the probability that clonal driver mutations in patients, where smoking-related signatures have been detected, are caused by different mutational processes (SBS4 and SBS92 smoking, SBS2 and SBS13 APOBEC, SBS1 and SBS5 ageing). Each observed driver mutation in each patient is given a mutational-signature-causing probability based on the trinucleotide context and the signatures exposure of the patient (see Methods) and then these probabilities are aggregated. Asterisks represent patients where the smoking-related aggregated probabilities are below 0.5. C) Correlation between PM2.5 levels and EGFR mutant (EGFRm) adenocarcinoma lung cancer incidence in England. The blue line: robust linear regression line; grey shading: 95% confidence interval. D-E) The Canadian Lung Cancer Cohort. D) Distribution of 3 year and 20 year cumulative PM2.5 exposure levels for all patients in the Canadian cohort. Red lines mark the thresholds that were used to determine Low, Intermediate and High groups that are used in (D). These are the 1st (6.77ug/m3) and 5th quintiles (7.27ug/m3) of the distribution. The full distribution is displayed in the top plot, while the bottom plot displays a narrower range of 4-10 ug/m3 (for clarity). E) Counts and frequencies of EGFRm in the Canadian Cohort, where 3 year and 20 year cumulative PM2.5 exposure levels were available. Patients are grouped into high, intermediate and low groups based on thresholds established as described in (D). These groups are defined based on 3 year cumulative PM2.5 exposure data (left) and based on 20 year cumulative PM2.5 exposure data (right). The bar plots display the counts and frequency of EGFRm amongst patients within each group
Extended Data Figure 2
A) Schematic of PM exposure and representative IHC of ET mice induced with AT2-specific Ad5-SPC-Cre exposed to PM or PBS control and quantification of neoplastic lesions (n=14 PBS, n=11 PM). Mann-Whitney test. B) Schematic of PM exposure followed by expression of EGFRL858R and quantification of precancerous lesions/mm2 of lung tissue (n=9 PBS; n=7 5 μg; n=11 50 μg PM). One-way ANOVA. C) Schematic of PM exposure and representative H&E of a lung adenocarcinoma in a 50 μg PM exposed, doxycycline treated CCSP-rtTa; TetO-EGFR858R mice; quantification of number of adenocarcinomas per mouse below (n = 9 per group). One-way ANOVA. D) Schematic of PM exposure and representative IHC for red fluorescent protein (RFP, marks tdTomato+ cells) in Rosa26LSL-tdTomato/+;KrasLSL-G12D/+ mouse model in control or 50 μg PM exposed conditions; quantification of number of hyperplastic lesions per mouse (n= 9 control, n=9 5 μg and n=12 50 μg). One-way ANOVA. Scale bar 50 μm (C main, H), 20 μm (C insert), 100 μm A & D
Extended Data Figure 3
WGS analysis of tumours from ET mice exposed to air pollution (n=5) and those exposed to PBS controls (n=5). Each mouse tumour is compared vs the corresponding germline from the same mouse. A) Mutational profiles for each tumour sample according to the mutation trinucleotide context. LEFT: PBS Controls, RIGHT: 50 μg PM. B) Barplots indicate the counts of mutations in each sample, where bars are colored based on the base change. C) Boxplot comparing the counts of mutations between tumours from pollution exposed mice (50 μg PM) and tumours from PBS exposed mice (PBS Control). All mutations are summarised in one plot on the left, and are then further divided based on the base change of the mutation (n=5 mice per group). Two-sided T-test comparing numbers of mutations between PBS and Air Pollution p-values are displayed. The boxplot line represents the median, the hinges of the box represent the 1st and 3rd quartiles and the limits of the whiskers represent the 1.5 interquartile range. D) Attribution of mutations in each tumour sample to each single base substitution (SBS) mutation signature. The shading indicates the weight of the signature within each sample. Majority of the weights have been assigned to ageing related signatures (SBS40, SBS5, SBS1) Komogolomov-Smirnoff test p-value=0.26-0.68
Extended Data Figure 4
A) Immune cell frequencies in the lungs determined by flow cytometry 24 hours post-exposure from induced tdTomato (T) and EGFR mutant (ET) mice after 50 μg PM (red) or control (blue) (n=8 mice per group). Data are presented as the frequency among live CD45+ immune cells. One-way ANOVA. B) Representative immunofluorescent images of CD68+ macrophages (cyan) and tdTomato+ EGFR mutant cells (red) within ET lungs exposed to control or 50 μg PM. Quantification of CD68+ cells per mm2 of lung tissue (n= 4 mice per group). C) Representative immunofluorescent images of CD68 (red), CD11b (green) and merged images from induced ET mice after 3 weeks of exposure to PBS (top) or 50 μg PM (bottom). Quantification of alveolar macrophages (AMΦ, CD68+CD11b-) and interstitial macrophages (IMΦ, CD68+CD11b+) per mm2 of lung tissue, selecting 10 x random 500 μm2 fields of view per mouse (n= 3 mice per group). One-way ANOVA. D) Representative immunofluorescent images of CD68+ macrophages (cyan) within CCSP-rtTA; TetO-EGFRL858R lungs treated with PBS (top) or 50 μg PM (bottom) 10 weeks post oncogene induction; quantification of CD68+ cells per m2 of lung tissue, selecting 20 x random 500 μm2 fields of view per mouse (n= 3 mice per group). Unpaired t-test. E) Representative immunofluorescent images of CD68+ macrophages (cyan) and tdTomato+ KrasG12D mutant cells (red) within KT lungs treated with PBS (top panel) or 50 μg PM (bottom) 10 weeks post oncogene induction; quantification of CD68+ cells per mm2 of lung tissue, selecting 20 x 500 μm2 fields of view containing RFP+ cells per mouse (n= 3 mice per group). Unpaired t-test. Scale bar 50 μm B & D, 150 μm E. Gating strategies for flow cytometry analysis provided in Extended Data Figure 6. Statistical analysis by one-way ANOVA for B, D, E & G. Scale bars 100 μm (B,F,E)
Extended Data Figure 5
A-B) Significantly enriched GSEA pathways upregulated in T-PM lung epithelial cells compared to T control mice (A), in ET-PM lung epithelial cells compared to ET control mice (B). For each comparison, barplots indicate the -log10(FDR) of the Komogolomov-Smirnoff test p-value for each pathway. C) Krt8+ AT2 progenitor score derived from scRNAseq of bleomycin treated mouse lung used to deconvolute bulk RNA-seq of T and ET mice exposed to 50 μg PM or PBS, (n= 5 mice per group). Welch's t-test between control and PM. D) Schematic displaying experimental set-up of clinical exposure study in never-smoker volunteers, crossover design with (i) and (ii) in random order separated by 4-week washout. E) Fold change (FC) of significantly upregulated genes (identified in mouse) compared to the fold change of genes changed in the clinical exposure study. Common directionality across species indicated by colour (negative: blue background; positive: red background). F) Schematic of AT2 culture from T or ET mice exposed to 50 μg PM or PBS, with induction of tdTomato or oncogene ex vivo. G) Representative fluorescent images of tdTomato+ AT2 organoids at day 14 from ET mice exposed to PBS or 50 μg PM in vivo. Scale bar 100 μm. H) Quantification of tdTom+ AT2 organoid forming efficiency, data represents averages from 2 technical replicates/mouse; n=4 mice from T control and PM; n=5 mice for ET control and PM. One-way ANOVA. I) Representative fluorescent imaging of tdTomato (yellow), Keratin 8 (magenta), SPC (blue) on a wholemount AT2 organoid from an ET mouse treated with 50 μg PM. Scale bar is 20 μm. J) LEFT: Representative IL-1β RNAscope performed on lungs from ET mice treated with PBS or 50 μg PM after 3 weeks of exposure. Scale bar 20 μm. RIGHT: Quantification of IL-1β+ cells per mm2 of lung tissue from 30 random fields of view (control, n = 3 mice) and 28 fields of view (50 μg PM, n = 3 mice). Mann-Whitney test p-value is displayed. K) LEFT: Representative image of IL-1β RNAscope (green) in CD68 positive (red) macrophages, arrows indicate positive macrophages. n=3 mice per group. Scale bar 50 μm. RIGHT: Quantification of IL-1β positive CD68+ cells at 3 weeks post induction in ET mice following exposure to PM. Mann-Whitney test. L) LEFT: Representative fluorescent images of EGFRL858R naive (non-PM exposed) AT2 organoids from ET mice treated with control or IL-1β in vitro. tdTomato (yellow) organoids stained with SPC (blue) and Keratin 8 (magenta). Scale bar 50 μm. RIGHT: Quantification of organoid size with each dot representing an organoid at day 14 of control (blue) or IL-1β treated (orange). Organoids derived from n=2 mice per group. Mann-Whitney test. M) Schematic of anti-IL-1β treatment treatment (black triangles) during PM exposure (black lines) and harvest (red triangle)
Extended Data Figure 6
A, B) Example of flow gating strategy to determine frequency of lung (A) alveolar macrophages, interstitial macrophages, neutrophils, dendritic cells and (B) epithelial cells both tdTomato positive and negative. All samples were first gated to exclude debris and doublets, followed by live cell discrimination. C) Representative picture from a tdTomato mouse treated with control PBS for 3 weeks using sort strategy to enrich for for AT2 cells defined in Major et al., 2020 and both alveolar and interstitial macrophages defined in Choi et al., 2020
Extended Data Figure 7
Extended Data Figure 7. CONSORT Diagrams for the normal lung tissue profiling cohorts
Extended Data Figure 8
A) Schematic indicating normal lung tissue cohorts analysed by ddPCR and Duplex-seq. B) TRACERx and PEACE Cohort for ddPCR of 5 EGFR mutations. (i) Clinical information for each patient, (ii) Tumour EGFR mutation status, (iii) Normal EGFR mutation status. C) Representative H & E images from anthracotic pigment identification in TRACERx normal tissue. D) Comparing area of normal tissue harbouring anthracotic pigment in never smokers (n=43) and smokers (n=138). Each dot represents the ratio of pigmented area respective to total tissue in each anthracosis positive normal lung tissue sample. Two-sided Wilcox test p-value is reported. E) Regression analysis of characteristics influences EGFR mutant (EGFRm) presence in normal lung tissue for ddPCR-TRACERx cohort (n=195)
Extended Data Figure 9
A) Top: EGFR Mutations detected using Duplex-seq across EGFR exons 18-21 on normal lung samples from the BDRE Study. Bottom: VAFs of each EGFR mutation are displayed. B) Top: KRAS Mutations detected using Duplex-seq across KRAS exons 2-3 on normal lung samples from the BDRE Study. Bottom: VAFs of each KRAS mutation are displayed. A-B) Only cancer-related mutations annotated in the cancer gene census are displayed. Mutations with strong evidence of being a lung cancer driver mutation are indicated in red, while mutations with some evidence of being a lung cancer driver mutation are indicated in pink, all other drivers annotated in COSMIC are indicated in blue. C) VAFs of KRAS mutations across samples of different cancer types. The one patient who received BRAF inhibitor treatment is indicated in purple. D) Comparing VAFs of high confidence (var count >=2, strong evidence) driver mutations in EGFR and KRAS. TOP: Boxplots summarise VAFs across samples. The boxplot line represents the median, the hinges of the box represent the 1st and 3rd quartiles and the limits of the whiskers represent the 1.5 interquartile range. Mutations are grouped according to the gene harbouring the mutation and smoking status of the patient. Two-sided Wilcox test p-values are reported. BOTTOM: dot plots show VAFs of mutations in each sample. Where a sample has 2 mutations (n=4), they are both indicated. Dots are coloured by the gene harbouring the mutation (EGFR or KRAS). A paired t-test was performed between the VAFs of EGFR and KRAS mutations in these 4 cases. (Paired t-test p=0.015) (Details of driver mutations can be found in Supplementary Table S8)
Fig. 1
Fig. 1. Exploring the association between cancer and air pollution.
a–c, Scatter plots showing relationships between PM2.5 levels and estimated EGFR-driven (EGFR mutant; EGFRm) lung cancer (LC) incidence (per 100,000 population) at the country level in England (a), South Korea (b) and Taiwan (c). Grey shading indicates 95% confidence intervals. d, Forest plot indicating the relationship between lung cancer risk and various co-variates, including residential PM2.5 exposure levels (range: 8.17–21.31 μg m−3) in the UK Biobank dataset. Only participants who have lived at the same location for 3 years before registration (n = 371,543) are included. Each co-variate is displayed on a different row. Cox regression P values are indicated on the right. BMI, body–mass index; NS, not significant
Fig. 2
Fig. 2. PM promotes lung tumorigenesis.
a, Schematic of the experiment. Induction of the oncogene was followed by exposure (black lines) through intratracheal (i.t.) administration of PM or PBS (control). Timing of tissue collection is indicated by the red triangles. b, Left, representative immunohistochemistry (IHC) images of human EGFRL858R in ET mice exposed to PBS or PM at 10 weeks. Right, quantification of human EGFRL858R-positive neoplasia per mm2 of lung tissue (n = 16 for the PBS and 5 μg PM groups, n = 15 for the 50 μg PM group). One-way analysis of variance (ANOVA). c, Representative diagram of spatially segmented human EGFRL858R-positive clusters in lung lobes, with the size of clusters proportional to EGFRL858R cell number at 10 weeks. d,e, Quantification of average cluster size (d) and fraction of expanded clusters (>5 cells) (e) in mice exposed to PM or PBS over time (n = 5 for 3 week control and 50 μg PM; n = 6, 10 week control; n = 7, 10 week 50 μg PM). One-way ANOVA. f, Left, quantification of lesions in Rag2−/−;Il2rg−/−;Rosa26LSL-tTa/+;TetO-EGFRL858R mice at 10 weeks after EGFR induction. Right, representative IHC images of EGFRL858R (n = 19 for control, n =20 for 50 μg PM). Mann–Whitney test. g, Proportion of interstitial macrophages (IMs) and PD-L1+IMs within lung tissue in Rosa26LSL-tdTomato/+ mice and ET mice determined by flow cytometry 24 h after final PBS (control) or PM exposure (n = 8 per group). One-way ANOVA. h, Representative histogram showing PD-L1 expression within lung IMs in Rosa26LSL-tdTomato/+ (left) and ET (right) mice exposed to control or PM conditions. Scale bar, 100 .m (b, f). Specific P values are indicated on the charts
Fig. 3
Fig. 3. Increased progenitor-like ability of EGFR mutant cells following PM exposure.
a, PC analysis plot of RNA-seq data from epithelia samples taken from recombined Rosa26LSL-tdTomato/+ mice (T) and ET mice exposed to 50 μg PM or PBS. b, Heatmap of progenitor AT2 cell state (AT2), macrophage recruitment and epithelial alarmin (Alarm) gene expression in all mouse tumour samples. The colour scale in the heatmap represents high (red) to low (blue) transcript per million (TPM) expression z-scores. Asterisks indicate significantly different (FDR < 0.05) gene expression between ET and ET + PM (Methods). c, Schematic of the epithelial organoid assay. Lungs were taken from mice exposed to PM or PBS, followed by isolation and culture of epithelial (positive for epithelial cellular adhesion molecule (EpCAM+)) cells. d, Left, representative fluorescent images of tdTomato+ organoids at day 14 from ET mice exposed to PBS (control) or PM in vivo. Right, OFE within unrecombined (tdTomato) or recombined (tdTomato+) EpCAM+ lung cells from ET mice exposed to PBS or PM. Two mice were pooled for each biological replicate for sufficient tdTomato+ cells. Data represent mean from tdTomato-, n = 8 (16 mice); tdTomato+EGFRL858R, n = 9 (18 mice). One-way ANOVA. e, Schematic of macrophage isolation from mice exposed to PM or PBS and co-cultured with naive (non-PM exposed) EGFRL858R AT2 cells. f, Left, representative fluorescent images of tdTomato+EGFRL858R AT2-cell-derived organoids from ET mice, co-cultured with IMs exposed to PM or PBS. Right, quantification of OFE of EGFRL858R AT2 cells alone and compared with AT2 cells from the same mouse co-cultured with alveolar macrophages (AMs) exposed to PBS or PM (n = 5 mice, data are average of 2 technical replicates per mouse). Paired-t test. g, Left, representative haematoxylin and eosin images of PM-exposed mice treated with IgG control antibody or anti-IL-1β throughout exposure duration. Right, quantification of tumours (n = 8 mice per group). Mann–Whitney test. Scale bar, 500 μm (d,f). The illustrations in c and e were created using BioRender (https://biorender.com)
Fig. 4
Fig. 4. Mutational landscapes of healthy lung tissue.
a, Counts and proportions of non-cancerous lung samples from PEACE (n = 19) and TRACERx (n = 195) patients that harbour EGFR mutations (EGFRm) identified using ddPCR. The EGFR mutation type is indicated by the colour of the bars (key in b). b, Count and proportion of healthy lung samples from the TRACERx dataset (organized according to anthracotic pigment content: yes (n = 149); no (n = 34)) that harbour EGFR mutations identified by ddPCR. The EGFR mutation type is indicated by the colour of the bars. c, Proportion test Beeswarm plot of ddPCR TRACERx data indicating the VAFs of EGFR mutations. Samples organized according to presence (yes; n = 31) or absence (no; n = 9) of anthracotic pigment. Shapes of dots indicate smoking status. Two-sided t-test. d, Gene models of KRAS (top) and EGFR (bottom), where dots represent mutations identified in the Duplex-seq PEACE and Duplex-seq BDRE cohorts. The position of the dots correspond to the loci of the mutations, whereas the height of the stack indicates the count of the number of mutations at a particular protein coordinate. The shape of the dot indicates the disease diagnosis of the patient, whereas the colour of the dot indicates the mutation type. e, Scatter plot displaying the correlation between age and the number of driver mutations identified in samples from never-smoker individuals (n = 17) in the Duplex-seq PEACE cohort, for which the panel comprised genomic loci in 31 genes, including EGFR and KRAS. Spearman correlation coefficient and P value are indicated in the plot

Comment in

Similar articles

Cited by

References

    1. Berenblum I, Shubik P. A new, quantitative, approach to the study of the stages of chemical carcinogenesis in the mouse's skin. Br J Cancer. 1947;1:383–391. - PMC - PubMed
    1. Cogliano VJ, et al. Preventable exposures associated with human cancers. J Nat Cancer Inst. 2011;103:1827–1839. - PMC - PubMed
    1. Sun S, Schiller JH, Gazdar AF. Lung cancer in never smokers—a different disease. Nat Rev Cancer. 2007;7:778–790. - PubMed
    1. Midha A, Dearden S, McCormack R. EGFR mutation incidence in non-small-cell lung cancer of adenocarcinoma histology: a systematic review and global map by ethnicity (mutMapII) Am J Cancer Res. 2015;5:2892–2911. - PMC - PubMed
    1. Carrot-Zhang J, et al. Genetic ancestry contributes to somatic mutations in lung cancers from admixed Latin American populations. Cancer Discov. 2021;11:591–598. - PMC - PubMed

Publication types

MeSH terms