

Net greenhouse gas balance of fibre wood plantation on peat in Indonesia
- PMID: 37020018
- PMCID: PMC10132972
- DOI: 10.1038/s41586-023-05860-9
Net greenhouse gas balance of fibre wood plantation on peat in Indonesia
Abstract
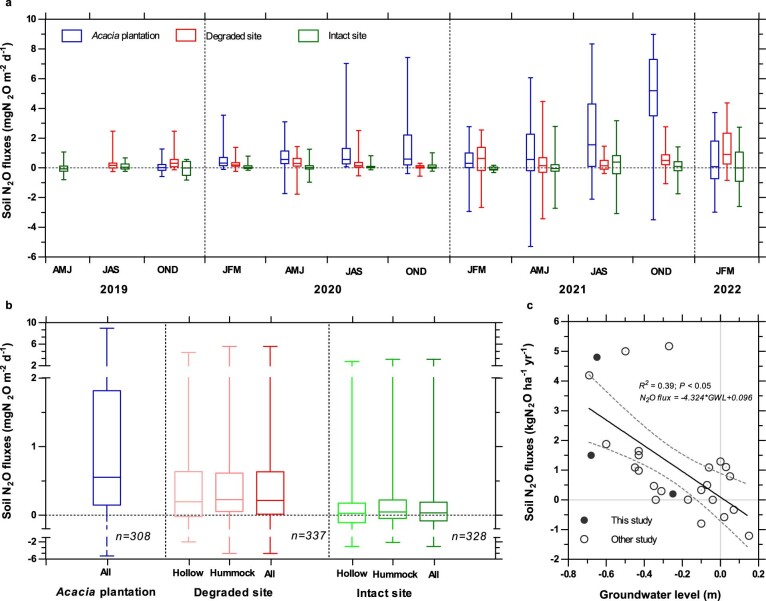
Tropical peatlands cycle and store large amounts of carbon in their soil and biomass1-5. Climate and land-use change alters greenhouse gas (GHG) fluxes of tropical peatlands, but the magnitude of these changes remains highly uncertain6-19. Here we measure net ecosystem exchanges of carbon dioxide, methane and soil nitrous oxide fluxes between October 2016 and May 2022 from Acacia crassicarpa plantation, degraded forest and intact forest within the same peat landscape, representing land-cover-change trajectories in Sumatra, Indonesia. This allows us to present a full plantation rotation GHG flux balance in a fibre wood plantation on peatland. We find that the Acacia plantation has lower GHG emissions than the degraded site with a similar average groundwater level (GWL), despite more intensive land use. The GHG emissions from the Acacia plantation over a full plantation rotation (35.2 ± 4.7 tCO2-eq ha-1 year-1, average ± standard deviation) were around two times higher than those from the intact forest (20.3 ± 3.7 tCO2-eq ha-1 year-1), but only half of the current Intergovernmental Panel on Climate Change (IPCC) Tier 1 emission factor (EF)20 for this land use. Our results can help to reduce the uncertainty in GHG emissions estimates, provide an estimate of the impact of land-use change on tropical peat and develop science-based peatland management practices as nature-based climate solutions.
© 2023. The Author(s).
Conflict of interest statement
C.D.E., S.E.P., S.S., F.A. and D.A. contributed to this paper as part of their role in the Independent Peat Expert Working Group (IPEWG), which was set up by Asia Pacific Resources International Ltd. (APRIL) to provide objective science-based advice on peatland management. The contribution of A.R.D. was also supported by APRIL to provide technical guidance on the eddy covariance data processing, including quality controls and gap-filling protocols. C.S.D., Nardi, A.P.S., Nurholis, M.H., A.R., R.E.M., S.K. and Y.S. are employed by APRIL to conduct field measurements, including eddy covariance instruments maintenance and calibration. The funders had no role in the interpretation of data, in the writing of the manuscript or in the decision to publish the results. The authors declare that all views expressed are their own.
Figures


Similar articles
-
Temporal dynamics of soil microbial C and N cycles with GHG fluxes in the transition from tropical peatland forest to oil palm plantation.Appl Environ Microbiol. 2025 Jan 31;91(1):e0198624. doi: 10.1128/aem.01986-24. Epub 2024 Dec 23. Appl Environ Microbiol. 2025. PMID: 39714193 Free PMC article.
-
Drainage increases CO2 and N2 O emissions from tropical peat soils.Glob Chang Biol. 2020 Aug;26(8):4583-4600. doi: 10.1111/gcb.15147. Epub 2020 Jun 20. Glob Chang Biol. 2020. PMID: 32391633
-
Impact of forest plantation on methane emissions from tropical peatland.Glob Chang Biol. 2020 Apr;26(4):2477-2495. doi: 10.1111/gcb.15019. Epub 2020 Feb 20. Glob Chang Biol. 2020. PMID: 31991028 Free PMC article.
-
Effects of converting cropland to grassland on greenhouse gas emissions from peat and organic-rich soils in temperate and boreal climates: a systematic review.Environ Evid. 2025 Jan 19;14(1):1. doi: 10.1186/s13750-024-00354-1. Environ Evid. 2025. PMID: 39828798 Free PMC article.
-
Mitigation of global greenhouse gas emissions from waste: conclusions and strategies from the Intergovernmental Panel on Climate Change (IPCC) Fourth Assessment Report. Working Group III (Mitigation).Waste Manag Res. 2008 Feb;26(1):11-32. doi: 10.1177/0734242X07088433. Waste Manag Res. 2008. PMID: 18338699 Review.
Cited by
-
Modulated ringdown comb interferometry for sensing of highly complex gases.Nature. 2025 Feb;638(8052):941-948. doi: 10.1038/s41586-024-08534-2. Epub 2025 Feb 19. Nature. 2025. PMID: 39972145
-
Benefits of tropical peatland rewetting for subsidence reduction and forest regrowth: results from a large-scale restoration trial.Sci Rep. 2024 May 10;14(1):10721. doi: 10.1038/s41598-024-60462-3. Sci Rep. 2024. PMID: 38729962 Free PMC article.
-
Comprehensive environmental assessment of typical Chinese industrial metal production processes.iScience. 2025 Jun 26;28(8):113011. doi: 10.1016/j.isci.2025.113011. eCollection 2025 Aug 15. iScience. 2025. PMID: 40740491 Free PMC article.
-
Global observation gaps of peatland greenhouse gas balances: needs and obstacles.Biogeochemistry. 2024;167(4):427-442. doi: 10.1007/s10533-023-01091-2. Epub 2023 Oct 15. Biogeochemistry. 2024. PMID: 40092475 Free PMC article.
References
-
- Lähteenoja O, et al. The large Amazonian peatland carbon sink in the subsiding Pastaza-Marañón foreland basin, Peru. Glob. Change Biol. 2012;18:164–178. doi: 10.1111/j.1365-2486.2011.02504.x. - DOI
-
- Gumbricht T, et al. An expert system model for mapping tropical wetlands and peatlands reveals South America as the largest contributor. Glob. Change Biol. 2017;36:335. - PubMed
MeSH terms
Substances
LinkOut - more resources
Full Text Sources
Research Materials
