. 2023 Apr;616(7958):828-835.
doi: 10.1038/s41586-023-05904-0. Epub 2023 Apr 5.

mRNA recognition and packaging by the human transcription-export complex

Affiliations

mRNA recognition and packaging by the human transcription-export complex

Belén Pacheco-Fiallos et al. Nature. 2023 Apr.

Abstract

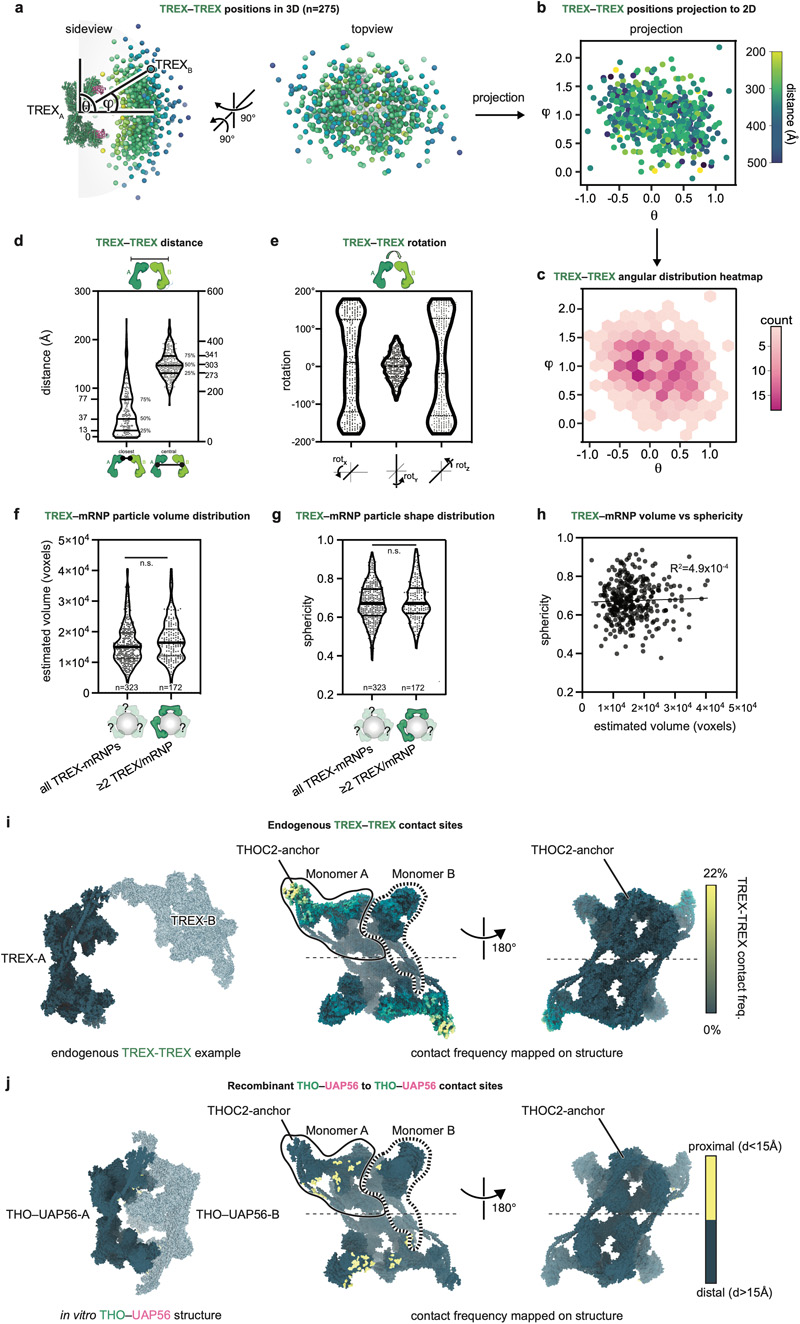
Newly made mRNAs are processed and packaged into mature ribonucleoprotein complexes (mRNPs) and are recognized by the essential transcription-export complex (TREX) for nuclear export1,2. However, the mechanisms of mRNP recognition and three-dimensional mRNP organization are poorly understood3. Here we report cryo-electron microscopy and tomography structures of reconstituted and endogenous human mRNPs bound to the 2-MDa TREX complex. We show that mRNPs are recognized through multivalent interactions between the TREX subunit ALYREF and mRNP-bound exon junction complexes. Exon junction complexes can multimerize through ALYREF, which suggests a mechanism for mRNP organization. Endogenous mRNPs form compact globules that are coated by multiple TREX complexes. These results reveal how TREX may simultaneously recognize, compact and protect mRNAs to promote their packaging for nuclear export. The organization of mRNP globules provides a framework to understand how mRNP architecture facilitates mRNA biogenesis and export.


Conflict of interest statement

Competing interests

The authors declare no competing interests.

Figures

Extended Data Figure 1
Extended Data Figure 1. Biochemical characterization of TREX–EJC–RNA and ALYREF–EJC–RNA complexes.
a. Domain architecture of ALYREF constructs and their nomenclature used throughout. N- and C-UBM, N- and C-terminal UAP56-binding motif; RBD1 and RBD2, RNA-binding domain 1 and 2; RRM, RNA-recognition motif; MBP, Maltose Binding Protein; 3C, PreScission protease cleavage site; His, Histidine-tag. b. ALYREFN reconstitutes the EJC in vitro. Pulldown assay with MBP-ALYREFN (bait) incubated with EIF4A3, MAGOH–Y14 (residues 66-154), or both, with or without a 15 nucleotide long single stranded (ss) RNAs and/or AMP-PNP. Complex formation was determined by SDS-PAGE analysis with Coomassie blue staining. This exact experiment was done once, but similar results were obtained in two additional experiments either without AMP-PNP or without RNA. c. ALYREFN–EJC–RNA complexes form multimers. ALYREFN–EJC–RNA was assembled on 50 (top) or 15 nucleotides (nt) long single stranded RNAs (ssRNAs) (bottom) and analyzed in sucrose density gradients. SDS-PAGE analysis with Coomassie blue staining of gradient fractions indicates multiple oligomeric states. The sucrose gradient sedimentation profile (bottom) is based on quantification of MAGOH band intensities. The sedimentation coefficients were estimated in CowSuite based on the predicted molecular weights of the different oligomeric states (an ALYREFN–EJC–RNA monomer is ~150 kDa). The sedimentation range of one to six ALYREFN–EJC–RNA complexes is indicated. We analyzed even fraction numbers and included fractions 7 and 15 to better resolve monomer and hexamer peaks using SDS-PAGE. Gradient conditions are specified on top. This exact experiment was done once, but ALYREFN–EJC–RNA multimerization was similarly observed in an experiment with different gradient ultracentrifugation parameters. d. The ALYREF WxHD domain is sufficient for EJC reconstitution. Pulldown assay with different MBP-ALYREF truncation constructs (see panel a) or MBP-CASC3SELOR as a bait and EIF4A3 and MAGOH–Y14 (residues 66-154) to probe EJC-reconstitution efficiency. Complex formation was determined by SDS-PAGE analysis with Coomassie blue staining. This experiment was done twice. For gel source data, see Supplementary Figure 3. e. ALYREF55-182–EJC–RNA oligomers form in vitro, are resistant to RNase treatment, and do not require the ALYREF RED1 and UBM domains. The ALYREF55-182–EJC– RNA complex was assembled on 15 nt ssRNA and treated (bottom) or not treated (top) with 20 μg benzonase mL-1 to digest protein-unbound RNA. The complexes were then analyzed in sucrose density gradients. SDS-PAGE analysis with Coomassie blue staining of gradient fractions indicates indistinguishable oligomeric sedimentation profiles of the ALYREF55-182–EJC–RNA complex, with or without benzonase digestion. The sucrose gradient sedimentation profile (bottom) is based on quantification of MAGOH band intensities. The hexamer peak (confirmed by negative staining, see panel f) is indicated with a grey box. Gradient conditions are specified. This experiment was done twice, the second time with 2 μg benzonase mL-1. f. Negative stain 2D class averages show that MBP-ALYREF55-182–EJC–RNA (15nt) complexes form trimeric (top) and hexameric (bottom) complexes. Cartoon interpretations are shown on the right. Scale bar, 250 Å. g. Ribbon model showing the location of mutated residues in ALYREF in the ALYREF-EJC interface. Mutated residues are shown as sticks and Cα-spheres colored by the ALYREF–EJC interface. h. ALYREF–EJC interface mutations in the ALYREF55-182 constructs reduce the efficiency of EJC reconstitution. The pulldown assay was carried out as in panel d. Mutated residues are indicated in panel g. Complex formation was determined by SDS-PAGE analysis with Coomassie blue staining. This experiment was done twice. i. Mutation of ALYREF in the ALYREF–EJC interfaces impairs ALYREF–EJC–RNA complex oligomerization in vitro. ALYREFM-b and ALYREFM-cd mutants were made in the ALYREF55-182 construct (see panel g for mutant details). Wild-type or mutant ALYREF55-182 or the isolated CASC3SELOR were used to assemble EJC–RNA complexes on a 15 nt long RNA and analyzed in sucrose density gradients for their multimerization. SDS-PAGE analysis with Coomassie blue staining of gradient fractions indicates loss of high-order oligomers in the sedimentation profiles of ALYREF mutants, which resemble the pattern of the monomeric CASC3SELOR. The sucrose gradient sedimentation profile (bottom) is based on quantification of MAGOH band intensities. The hexamer peak is indicated with a grey rectangle. Gradient conditions are specified on top. This exact experiment was done once. j. The in vivo mutation of ALYREF in the ALYREF–EJC interface (mutant ALYREFM-c+Δ d; see panel g for details) impairs its interaction with mRNP components. Wild-type FLAG-tagged ALYREFWT or the FLAG-ALYREFM-c+Δ d mutant were ectopically overexpressed in K562 cells, which also ectopically overexpressed THOC1-GFP. The two cell lines were used to prepare nuclear extract (NE), which were then treated with benzonase for 16 h at 4°C, including a final concentration of 5 mM MgCl2. The benzonase-treated extracts were then applied to anti-FLAG M2 resin for purification. Western blot analysis shows wild-type ALYREF or the mutant ALYREFM-c+Δ d (via their FLAG-tag), NCBP1, and EIF4A3. This experiment was done twice. k. The THO–UAP56 complex does not form a complex with ALYREFN in sucrose density gradients, suggesting that UAP56 binds the ALYREF UBM with low affinity as observed in yeast. SDS-PAGE stained with Coomassie blue. The sucrose gradient sedimentation profile (bottom) is based on quantification of THOC2 and ALYREF band intensities. Gradient conditions are specified on top. This experiment was done twice. For gel source data, see Supplementary Figure 4. l. In vitro reconstitution of TREX–EJC–RNA. The recombinant proteins or subcomplexes were mixed as shown in Fig. 1d and applied to sucrose density gradient ultracentrifugation. SDS-PAGE analysis with Coomassie blue staining confirms the formation of a complex containing all eleven proteins subunits and a sedimentation coefficient of ~75 S. Gradient conditions are specified on top. This experiment was done four times. m. The ALYREF-UBM–UAP56 interaction is required to form the TREX–EJC–RNA complex in vitro. Sucrose gradient sedimentation profiles of (from top to bottom): ALYREFN–EJC–RNA, ALYREF55-182–EJC–RNA, THO–UAP56, THO–UAP56 with ALYREFN–EJC–RNA, and THO–UAP56 with ALYREF55-182–EJC–RNA. Gradient fractions were analyzed by SDS-PAGE and Coomassie staining. Bellow, sucrose gradient sedimentation profiles are based on quantifications of the EJC subunit MAGOH and THO complex subunit THOC2 band intensities. MAGOH intensities were multiplied by a factor of 3 for better visualization. Gradient fractions containing ALYREF–EJC–RNA (light grey), THO–UAP56 (light grey), or TREX–EJC–RNA (grey) are shown with rectangles. Gradient conditions are specified on top. This experiment was done five times. n. A monomeric THO complex (THOMonomer) does not form TREX–EJC–RNA complexes in vitro. Sucrose gradient sedimentation profiles of THOMonomer–UAP56 (see Methods for details) alone or in presence of ALYREFN–EJC–RNA, assembled on a 15nt ssRNA. Gradient fractions were analyzed by SDS-PAGE and Coomassie staining. THOMonomer–UAP56 did not form TREX–EJC–RNA complexes (compare to panel m). Below, sucrose gradient sedimentation profiles are based on quantifications of the EJC subunit MAGOH and THO complex subunit THOC2 band intensities. MAGOH intensities were multiplied by a factor of 3 for better visualization. Gradient conditions are specified on top. This experiment was done twice.
Extended Data Figure 2
Extended Data Figure 2. ALYREF–EJC–RNA and TREX–EJC–RNA complex cryo-EM image processing and structural details.
a. Denoised cryo-EM micrographs of ALYREF55-182–EJC–RNA (left) and TREX–EJC– RNA (right) complexes (see Methods). Scale bar, 500 Å. The ALYREF55-182–EJC–RNA dataset contained 7,891 micrographs and the TREX–EJC–RNA dataset 12,938 micrographs, respectively. b. TREX–EJC–RNA complexes contain multiple THO–UAP56 complexes, caging in a central ALYREFN–EJC–RNA complex. Single TREX–EJC–RNA particles from a denoised cryo-EM micrograph can contain two (left) or three (right) THO–UAP56 complexes. In 2D class averages, the THO–UAP56 complexes blur out, because the central ALYREFN–EJC–RNA complex is aligned (bottom). c. Three-dimensional image classification tree of ALYREF55-182–EJC–RNA (left) and TREX–EJC–RNA (right) cryo-EM data. The ALYREF55-182–EJC–RNA dataset contained 7,891 micrographs from which 2,139,936 particles were picked and extracted. Three initial volumes were generated from 100,000 particles in cryoSPARC using the ab-initio reconstruction algorithm, which served as reference volumes to classify the entire dataset using three rounds of heterogenous classification (see Methods). The final particle stack contained 1,564,602 particles and was refined to 2.4 Å using D3 symmetry. The TREX–EJC–RNA dataset contained 1,050,740 particles, which were classified using initial volumes obtained from the ALYREF55-182–EJC–RNA dataset and from ab initio reconstructions. After 3D classification, 3D refinement and application of D3 symmetry in cryoSPARC yielded a 3.0 Å resolution map from 383,520 particles. The type of mask is indicated for each 3D refinement. Please refer to Methods for further details. d. ALYREF55-182–EJC–RNA and TREX–EJC–RNA give rise to indistinguishable 2D classes and reconstructions (top left and right), apart from the higher resolution of the ALYREF55-182–EJC–RNA dataset (bottom left), which contains more particles. e. Representative protein (MAGOH, top) and RNA (bottom) densities from the 2.4 Å resolution ALYREF55-182–EJC–RNA map. f. Orientation distribution plots for all particles contributing to the ALYREF55-182–EJC– RNA and TREX–EJC–RNA cryo-EM map, visualized in cryoSPARC. g. Gold-standard Fourier shell correlation (FSC = 0.143) of the ALYREF55-182–EJC–RNA and TREX–EJC–RNA cryo-EM maps. h. Cryo-EM densities for ALYREF–EJC interface residues from the 2.4 Å ALYREF55-182–EJC–RNA map. i. Multiple sequence alignment showing the conservation of ALYREF–EJC interface residues in ALYREF, EIF4A3, and MAGOH using human (H.s.), Danio rerio (D.r.), Drosophila melanogaster (D.m.), Caenorhabditis elegans (C.e.), Arabidopsis thaliana (A.t.), and Schizosaccharomycespombe (S.p) sequences. A different type of arrow is used to indicate residues of interfaces b, c, and d.
Extended Data Figure 3
Extended Data Figure 3. Comparisons of ALYREF–EJC interaction details with a viral ALYREF-ORF57 complex, the cytoplasmic CASC3–EJC–RNA complex, and the EJC-bound P-complex spliceosome.
a. Organization of ALYREF. Top: Structural model of full-length ALYREF predicted with AlphaFold,. Annotated domains (N-UBM, WxHD motif, RRM and C-UBM) are colored in darker shades of purple. Spheres represent backbone atoms of glycine and arginine residues in the RBD domains. Middle: ALYREF domain diagram. Black bars indicate residues that are included as an atomic model in this study. Bottom: AlphaFold per residues confidence score (pLDDT) plot. High values are indicative of high confidence predictions, whereas low values represent residues that are likely disordered in solution. b. Comparison of the ALYREF RRM domain interaction with the EJC subunit MAGOH (interface c, left) and the Herpes simplex virus ORF57 (right). ALYREF binds viral ORF57 differently compared to the overlapping ALYREF–EJC interface c. This supports a general model that ALYREF can use multiple interfaces to engage either viral proteins, such as ORF57, or mRNP maturation marks, such as the CBC or EJCs, and may enable ALYREF to broadly select its RNA targets. c. Details of the WxHD motifs binding to the EJC. Left: Modelling of apo EIF4A3 bound to the WxHD motif indicates a clash with EIF4A3 residue Y202, suggesting that ALYREF can only bind to RNA-bound EJC (see Supplementary Video 2). Middle: the same view, showing the ALYREF WxHD motif bound to RNA-bound EJC (this study). Right: the same view, showing the CASC3 WxHD motif bound to RNA-bound EJC, revealing conserved binding modes of ALYREF and CASC3. d. The ALYREF WxHD and RRM domains binds the same interfaces between EIF4A3 and MAGOH as the CASC3SELOR domain. Top: Overview image of the ALYREF–EJC–RNA structure (left) and comparison of the binding modes of ALYREF and CASC3 (middle and right, respectively). Bottom: Sequence alignment of ALYREF (top) and CASC3 (bottom), showing the conserved WxHD motif and an additional short conserved motif (QEL[F/I]Ax[F/Y]G), which is however not contacting the EJC in the ALYREF–EJC–RNA structure. Conserved (dark blue) and partially conserved (light blue) residues are indicated with boxes. Residues in ALYREF and CASC3 contacting the EJC are indicated. e. Superposition of the ALYREF–EJC–RNA complex (this study) onto the human P-complex spliceosome cryo-EM structure (PDB ID 6QDV), via their EJC EIF4A3 subunits. This model reveals that higher order ALYREF–EJC complexes such as the ALYREF–EJC dimer are not possible when the EJC is still bound by the spliceosomes, as the P-complex subunit SNU114 clashes with the RRM in an ALYREF–EJC dimer. In addition, SNU114 likely disfavors binding of a single molecule of ALYREF to the EJC, as there is a steric clash with the N-terminal ordered ALYREF residue (Asp 85) in the ALYREF–EJC structure.
Extended Data Figure 4
Extended Data Figure 4. Endogenous TREX–mRNP complex purification strategies, biochemical characterization, and negative stain EM.
a. Endogenous TREX–mRNP complexes were obtained via affinity purification of ectopically overexpressed THOC1-GFP in K562 cell nuclear extract (NE), which underwent a mild nuclease treatment. Purified TREX–mRNPs sediment ~90-100 S in a sucrose density gradient. Individual fractions were analyzed by SDS-PAGE and S-values were estimated using CowSuite. This experiment was done more than ten times. b. Mass spectrometry analysis of endogenous TREX–mRNP complexes shows the 11 members of TREX and EJC within the top 12 hits. The relative abundance of each protein was estimated by summing up the peak areas of the top three peptides. Asterisks indicate tubulin proteins, which are abundant cellular proteins that are common purification contaminants. See Supplementary Table 1 for a complete list of identified proteins. c. TREX–mRNP purification yields the same protein composition using different strategies: (i) two different cell lines, ectopic THOC1-GFP overexpression (Lenti O/E) versus endogenous GFP-THOC5 CRISPR/Cas9-tagging (Endo), (ii) nuclear extract preparation methods, rapid cell fractionation (RCF) versus the standard nuclear extract preparation protocol (see Methods for details) or (iii) without and with mild nuclease digestion with benzonase. SDS-PAGE gels after affinity purification using GFP-trap resin and elution with 3C protease are shown. The experiment comparing RCF versus standard nuclear extract preparation protocols was done once. The comparison between THOC1-3C-GFP Lenti O/E and GFP-3C-THOC5 Endo nuclear extracts was carried out twice. The comparison between benzonase and non-benzonase treatments was done eight times. For gel source data, see Supplementary Figure 5. d. SRSF1 is phosphorylated in endogenous TREX–mRNP complexes. Western blot analysis of SRSF1 in purified TREX–mRNPs before (lane 1) and after (lane 2) treatment with lambda phosphatase. Phosphorylated SRSF1 migrates slower during SDS-PAGE-PAGE and is less efficiently recognized by the anti-SRSF1 antibody. This experiment was done four times. For gel source data, see Supplementary Figure 6. e. NXF1 is absent from purified TREX-mRNPs. Western blot showing protein levels of THOC1, NXF1, EIF4A3 and the proteasome subunit PSMA7 control in input (standard nuclear extract) and affinity purified TREX–mRNPs. While THOC1 and EIF4A3 are enriched in TREX–mRNPs, NXF1 and the proteasome are not. NXF1–NXT1 may be absent from TREX–mRNPs either due to a low affinity interaction with TREX–mRNPs or because it associates after an additional mRNP remodelling step. The experiment was done twice. For gel source data, see Supplementary Figure 7. f. Mild nuclease treatment is required to obtain well-separated TREX–mRNP particles for electron microscopy. The nuclease activity of benzonase was reduced by omitting Magnesium from the buffer. Negative stain EM micrographs of TREX–mRNPs purified from nuclear extract either without (left) or with (right) mild nuclease treatment show that non-treated TREX–mRNP particles more frequently clump together. This experiment was done once. Scale bar, 200 Å. g. Purified TREX–mRNPs without (top) or with (bottom) mild nuclease treatment show identical negative stain EM 2D class averages. TREX complexes are indicated on the 2D classes using green arrow heads, showing that in both conditions single and multiple TREX complexes bound to a globular mRNP density. Scale bar, 200 Å. h. Purified TREX–mRNPs without (left) or with (right) mild nuclease treatment show identical negative stain EM 3D reconstructions. Scale bar, 200 Å. i. Nuclease treatment does not affect TREX–mRNP particle diameter or shape when visualized with negative stain EM. Left: Violin plot of TREX–mRNP particle diameters measured on negative stain electron micrographs. Horizontal bars indicate 25th (grey), 50th (black) and 75th (grey) percentiles. Nuclease-treated (n=259) or untreated (n=245) particles are not significantly different (Welch’s t-test, p=0.91). Right: Particle roundness, calculated by dividing the length of the shortest axis of each particle by the length of the longest axis, is also not significantly different (Welch’s t-test, p=0.82).
Extended Data Figure 5
Extended Data Figure 5. Endogenous TREX–mRNP complex cryo-EM image processing, reconstructions, and biochemistry of UAP56–ALYREF.
a. Three-dimensional image classification tree of endogenous TREX–mRNP complex cryo-EM data,. The complete data set contained 840,469 TREX-mRNP particles, which were classified in multiple rounds of 3D classification (with regularization parameter T=4 for all RELION classifications) and focused refinement in RELION,. The best particles were used to extract symmetry related dimers, separately, yielding 415,848 dimer particles, which were further classified and refined in cryoSPARC. This yielded maps A (cyan), B (light green), and C (slate blue) (see Methods for details). The percentage of TREX–mRNP particles (black) or TREX dimer units (orange) contributing to each class are provided. The type of mask and overall resolution is indicated for each 3D refinement. b. Gold-standard Fourier shell correlation (FSC = 0.143) of the TREX–mRNA cryo-EM maps A, B, and C. c. Orientation distribution plots for all particles contributing to the TREX–mRNA cryo-EM maps A, B, and C, visualized in cryoSPARC. d. The composite TREX–mRNA cryo-EM density is shown from front and left side views (maps A, B, and C), and colored by local resolution as determined by cryoSPARC. e. The composite TREX–mRNA cryo-EM density (maps A, B, and C) is shown opposite of the refined TREX–mRNA coordinate model, which is shown as ribbons and colored as in Fig. 2d. f. Gallery of TREX–mRNA complex subunits THOC1, THOC5 (tRWD domain), and THOC6 are shown superimposed on their respective cryo-EM densities. Below each protein a representative segment of the protein is superimposed on the respective cryo-EM density. g. The TREX monomer A is mobile in the TREX–mRNA complex data. Two densities obtained from 3D variability analysis (class 3 in grey and class 8 in green) are overlayed, revealing that monomer A can shift globally by ~25 Å. This mobility can explain why monomer A, and the associated UAP56 molecule, have a low local resolution. h. The TREX–mRNA map reveals density for the UAP56 RecA1 lobe, the ALYREF UBM, and putatively assigned mRNA, which were fitted as a single rigid body of a yeast Yra1–Sub2–RNA homology model (5SUP). The ALYREF UBM, which could be either N- or C-terminal, is visible at lower density threshold, and was modelled as the C-UBM based on its position in the yeast Yra1 (C-UBM)–Sub2–RNA crystal structure and an AlphaFold2 mulitmer model of the ALYREF C-UBM bound to human UAP56. i. Mutation of human UAP56 residues at the ALYREF-UBM to UAP56 interface, supports the ALYREF-UBM density assignment. Top: Interface mutations are mapped onto the UAP56 coordinate model and labelled. Bottom: In vitro, a fluorescently labeled ALYREF C-UBM peptide binds to wildtype UAP56 but not mutated UAP56. This experiment was done once. For gel source data, see Supplementary Figure 8. j. Comparison of human ALYREF-UBM–UAP56–RNA (this study) and yeast Yra1-UBM–UAP56–RNA–ATP-analog (5SUP) structures. k. An RNA filter-binding assay suggests that the ALYREF RNA binding domains 1 and 2 (RBD1 and RBD2) might assist RNA delivery to UAP56, but not the isolated ALYREF55-182 construct that forms EJC contacts (see Fig. 1, Extended Data Fig. 1). Left: Boundaries of protein constructs used for RNA affinity measurements using filter binding assays. Middle: Binding curves of the tested constructs. The plot shows mean values from n=6 measurements, error bars indicate the standard deviation of each measurement, and solid or dotted lines show the fit of a “Specific binding with Hill-slope”-function to the data, with the Bmax constrained to 1 as implemented in GraphPad Prism (see Methods). Right: Measured dissociation constants (KD) of the tested constructs as determined by the fits in the middle panel; spheres indicate the KD determined form the fit and error bars indicate the 95% confidence interval determined from the fit. UAP56-RNA binding is not detectable with isolated UAP56 in absence of ATPγS, but does bind RNA with KD of ~900 nM (95% confidence interval: 810-1,014 nM) in presence of 1 mM ATPγS. The ALYREF-RNA binding activity is contained in its RBD1 and RBD2 domains, but not in the WQHD or RRM domains. These experiments were done twice, with three technical replicates each.
Extended Data Figure 6
Extended Data Figure 6. Recombinant THO–UAP56 complex cryo-EM image processing and reconstructions.
a. Three-dimensional image classification tree of the in vitro reconstituted THO–UAP56 cryo-EM data set. The symmetry-expanded data set contained 314,583 high-quality particles. Classification and focused refinements in cryoSPARC yielded maps D (pink) and E (green) (see Methods for details). The percentage of THO–UAP56 dimer units contributing to each class is provided. The type of mask and overall resolution is indicated for each 3D refinement. b. Gold-standard Fourier shell correlation (FSC = 0.143) of the cryo-EM maps D and E. c. Orientation distribution plots for all particles contributing to cryo-EM maps D and E, visualized in cryoSPARC. d. THO–UAP56 complex monomer A composite cryo-EM densities from front and left side views (maps D and E), colored by local resolution as determined by RELION 3.1,. e. Representative regions of the newly determined THO–UAP56 cryo-EM densities (top) in comparison to previous data (bottom). The new densities are superimposed on the updated and refined THO–UAP56 coordinate model. Segments of THOC2 residues 316-330, residues 576-590, and THOC3 residues 163-170 are shown. f. A new model of the human THO–UAP56 complex. Newly modelled regions are shown in yellow, and contain segments of THOC1, THOC2, and THOC3. Regions with newly modelled sidechains are colored orange and are built on the previously available backbone models of THOC2 and THOC3. This updated model reveals new contacts among THOC1, -2, and, -3 subunits. The newly built THOC1 C-terminus meanders along the length of the THOC2 subunit ‘bow’, ‘MIF4G’, and ‘stern’ domains (Fig. 2e). The THOC1 C-terminal residues (458-528) were initially modelled using AlphaFold (Methods),. The THOC2 ‘anchor’ forms a 5-helix bundle that packs against THOC5 helix α2 and THOC7 helices α2 and α3, and the THOC3 β-propeller blades 3 and 4 make a stabilizing contact with THOC2 ‘bow’ loop α17-α18 (Fig. 2e). Unchanged regions are colored grey and green and contain modelled backbones or sidechain, respectively.
Extended Data Figure 7
Extended Data Figure 7. Crosslinking MS of endogenous TREX–mRNPs.
a. Crosslinks mapped onto TREX monomers 1A and 1B. Monomer 1A and 1B are shown as transparent surfaces and crosslinks are colored according to the Cα-Cα distance of crosslinked residues. Symmetry related monomers 2A and 2B are shown in ribbon representation and colored as in Fig. 2d. Crosslinks that span more than 30 Å may be explained through proximity between TREX complexes on mRNPs, as observed in our cryo-ET data. The data was generated from two purification and crosslinking experiments, which were merged for data analysis (see methods). b. Crosslinks mapped onto the ALYREF–EJC–RNA protomer structure. c. Crosslinks mapped onto the ALYREF–EJC–RNA dimer structure are similarly compatible both with inter EJC-EJC (dimer) as well as with intra–EJC crosslink distances (protomer, panel b). Crosslinks spanning less than 30 Å are shown. d. The ALYREF–MAGOH crosslinks mapped onto a model generated by superposing the ALYREF AlphaFold model onto the ALYREF-RRM. ALYREF residues in the AlphaFold model that are absent from the ALYREF–EJC–RNA structure are shown as transparent ribbons. e. Histograms and pie charts of Cα-Cα distances of crosslinked residues in the TREX (e) structure. f. As panel e, but for the ALYREF–EJC–RNA structure. g. Protein-protein interaction network based on crosslinks of TREX–mRNPs after a one-step purification without nuclease digestion. Note that ribosomal proteins are common contaminants. The thickness of the grey lines connecting proteins scales with the number of unique crosslinked residue pairs.
Extended Data Figure 8
Extended Data Figure 8. TREX–mRNP cryo-tomography analysis.
a. Tilt-series pre-processing, tomogram reconstruction, template matching and particle classification. Tilt series movie frames were pre-processed using Warp, and aligned in imod and tomograms were reconstructed in Warp with a pixel size of 10 Å/px (see methods for details). Template matching and subtomogram reconstruction were performed in Warp. Two independent rounds of template matching and particle classification were performed; for the first round (left hand side), template matching was performed against raw tomograms using a reference volume from our single particle analysis of the endogenous TREX complex (this study). 242,237 subtomograms were extracted and classified into four classes using RELION,, and the regularization parameter was set to T=4 for all classification runs. The best class (12% of extracted subtomograms) was denoised and used to perform template matching with denoised tomograms as search targets (right branch). This yielded 59,275 subtomograms, and particle classification was performed as before. In the next step, the overlap of good particles from both branches was taken as a high-confidence set and these particles were used to generate a reference-free volume to exclude potential reference bias in the final reconstruction. The obtained volume was used to further classify the combined particles from both picking strategies using three subsequent rounds of 3D classification. In the last round, a combined 10,105 sub-tomograms in classes 2, 3, and 4 contained the TREX complex and less then 1% of particles (class 1) gave rise to ‘junk’ particles, showing that classification had converged. The insets show zoom-ins of two classes that reveal unambiguous, low-resolution density for the UAP56 RecA1 lobe (monomer B or monomer A, respectively). b. Subtomogram average (STA) map of endogenous TREX–mRNPs with TREX density in green and mRNP density in grey. Insets show zoom-ins on the THO complex scaffold subunits (THOC5, -6, and -7), revealing an excellent fit of the TREX structure to the STA map and density features consistent with the resolution estimate (13 Å), such as the “hole” in the THOC6 WD40 density. c. Example of a reconstructed tomogram before denoising. d. The same tomogram as shown in panel c after denoising. e. The same tomogram as in panel d, but with TREX positions (green densities) obtained from STA overlayed. f. Gold-standard Fourier shell correlation (FSC = 0.143) curve for the STA reconstruction with three different masks: (1) either a wide mask encompassing the C2 symmetric entire TREX complex (dotted line, 17 Å), (2) a tight mask encompassing the “scaffold” made from THOC5, -6, and -7 (15 Å), or (3) a tight mask around monomer B (THOC 1/2/3) (13 Å). g. Size comparison between a representative TREX–mRNP and the dilated human nuclear pore complex (PDB 7R5J). Visually identified TREX density in the TREX–mRNP particle is colored green, and mRNP density is colored grey.
Extended Data Figure 9
Extended Data Figure 9. Analysis of TREX-pairs on mRNPs.
a. Real-space representation of aligned TREX pairs (n=275) shown from two views. The reference TREX (TREX-A) is shown as a ribbon representation, and all TREX-Bs are shown as a sphere placed at the TREX-B center. Spheres are colored by TREX-A to -B distances. b. Projection of TREX-B coordinates onto a 2D plane, colored as in A. θ and φ describe the angular component of a vector connecting TREX-A with TREX-B. c. Heatmap of TREX–TREX positions (expressed as θ and φ). d. Violin plot of TREX-A–TREX-B distances, measured from center-to-center or between the two closest atoms. e. Violin plot of rotation angles around the X, Y and Z axis that would align TREX-A with TREX-B. f. Violin plot of TREX mRNP particle volumes measured for particles with more than two TREX complexes per mRNP in our stringently classified dataset or of random TREX–mRNP particles. No significant difference was found (Welch’s t-test, p=0.0874). g. Violin plot of TREX mRNP particle sphericity measured for particles with more than two TREX complexes per mRNP in our stringently classified dataset or of random TREX–mRNP particles. No significant difference was found (Welch’s t-test, p=0.3162) h. Scatter plot of TREX–mRNP volume vs sphericity (n=323). i. Analysis of TREX-A to -B contacts (defined as atoms of TREX-A within 10Å to TREX-B) as observed for TREX pairs on endogenous mRNPs. TREX residues are colored by their proximity frequency, with atoms never in proximity to TREX-B in bluegreen and atoms frequently in bright yellow. j. Analysis of THO–UAP56 contact sites (defined as atoms of THO–UAP56-A within 10 Å to THO–UAP56-B) as observed for the in vitro THO–UAP56 structure. Atoms within 15 Å to the second copy are colored bright yellow.
Extended Data Figure 10
Extended Data Figure 10. Probing protein accessibility in endogenous mRNP complexes.
a. Schematic of the experiment to probe protein accessibility in mRNP complexes. The nuclear or cytoplasmic extract from K562 cells, tagged homozygously and endogenously with either GFP-3C-THOC5 or GFP-3C-EIF4A3, was incubated with a fluorescently labelled (AF647) 15 kDa anti-GFP nanobody. The extracts were then applied to a sucrose density gradient to separate free proteins from mRNPs, which migrate in heavy (later) sucrose gradient fractions. The gradient fractions were analyzed by SDS–PAGE. Due to high affinity of the anti-GFP nanobody to GFP (~1 pM), the nanobody stays bound to the GFP fusion during gel electrophoresis (see Methods for details). Fluorescence imaging allows quantification of the respective sedimentation profiles for the GFP fusion proteins (GFP-THOC5 or GFP-EI4A3, green channel) and the anti-GFP nanobody-bound fusion proteins (red channel, colored in magenta). When the GFP-tagged protein is accessible in mRNPs, then the anti-GFP nanobody signal closely follows the profile of the GFP-tagged protein. In contrast, when a GFP-tagged protein is inaccessible in mRNPs, the anti-GFP nanobody signal follows the GFP signal in early (light) sucrose gradient fractions that contain free proteins but shows reduced intensity in later (heavy) fractions. b. The anti-GFP nanobody signal closely follows the GFP-THOC5 signal, showing that GFP-THOC5 is accessible in mRNP complexes. Shown is the fluorescence signal from SDS-PAGE gels of GFP-THOC5 nuclear extract incubated with the AF647-labeled anti-GFP nanobody (top) and normalized sedimentation profiles (bottom). Sedimentation plots show mean normalized intensity values determined from three gels (solid lines) and standard deviations (transparent areas). The grey box indicates the peak gradient fractions of purified TREX–mRNPs (see Extended Data Fig. 4). This experiment was done four times. For gel source data, see Supplementary Figure 9. c. As for panel b, but for GFP-EIF4A3 in nuclear extract. In the high molecular weight fractions of the sucrose density gradient, GFP-3C-EIF4A3 is poorly accessible to the anti-GFP nanobody. This experiment was done four times. For gel source data, see Supplementary Figure 10. d. As for panel b, but for GFP-EIF4A3 in cytoplasmic extract. In the high molecular weight fractions of the sucrose density gradient, GFP-EIF4A3 remains accessible to the anti-GFP nanobody, in contrast to GFP-EIF4A3 in nuclear extract, which is shown in panel c. This experiment was done twice. For gel source data, see Supplementary Figure 11. e. Western blot experiment that shows the different depletion efficiencies of THOC1-GFP (ectopically overexpressed; Lenti O/E), GFP-THOC5 (endogenously tagged; endo), or GFP-EIF4A3 (endogenously tagged; endo) from nuclear extract using GFP-Trap resin (containing an anti-GFP nanobody coupled to 90 μm agarose beads) after three rounds of depletion. While THOC1-GFP and GFP-THOC5 are completely depleted in the supernatant, GFP-EIF4A3 is very inefficiently depleted. Anti-PSMA7 blots (a proteasome subunit) serve as loading controls. These experiments were done three times. For gel source data, see Supplementary Figure 12. f. Cartoon model showing the position and nanobody-accessibility of GFP-tagged THOC5 or EIF4A3 in TREX–mRNPs, based on the accessibility to the anti-GFP nanobody and anti-GFP resin in panels e and f.
Figure 1
Figure 1. Structure of an ALYREF-exon-junction complex oligomer.
a. Assembly scheme (left) and domain organization (right) of ALYREF–EJC–RNA complex components (see Extended Data Fig. 1 and Methods for details). Solid lines indicate regions included in the atomic model, dotted lines indicate protein construct boundaries. N- and C-terminal UAP56-binding motifs (N- and C-UBM); RNA-binding domains 1 and 2 (RBD1 and RBD2); RNA-recognition motif (RRM). The protein color code is used throughout. b. ALYREF55-182–EJC–RNA complex structure shown from top and side views. The structure shows an ALYREF55-182–EJC–RNA hexamer, one of the various oligomers observed in vitro (Extended Data Fig. 1c, f). In the top view (left), every second protomer is rendered transparent for clarity. In the side view (right) protomers 3 to 6 are transparent for clarity. In the cartoon inset ALYREF55-182–EJC–RNA protomers are labelled, 1 to 6, and the dimer is outlined in black. c. One ALYREF molecule bridges three EJCs, labelled 1, 2, and 3, through its WxHD (interface b) and RRM domains (interfaces c and d), suggesting mechanisms for mRNP recognition and packaging. The conserved ALYREF R144 arginine-finger (R-finger) of interface d wedges in between EIF4A3 and MAGOH of protomer 3. See Extended Data Fig. 2 for details. d. Assembly scheme (left), SDS-PAGE analysis (center), and cryo-EM (right) of the in vitro reconstituted TREX–EJC–RNA complex. Addition of recombinant THO–UAP56 to ALYREFN–EJC–RNA yields the TREX–EJC–RNA complex (center) (see also Extended Data Fig. 1l). Representative cryo-EM particles and their cartoon interpretations are shown on the right. Below, 2D averages of the ALYREF–EJC–RNA complex bound to THO–UAP56 or in isolation show an indistinguishable complex organization (see Extended Data Fig. 2d). THO complex (green), UAP56 (pink), all other protein colors as in panel a. For gel source data, see Supplementary Figure 1.
Figure 2
Figure 2. Endogenous TREX–mRNP complex structure.
a. Purification scheme (left) and SDS-PAGE analysis (right) of endogenous TREX-mRNP complexes from human K562 cells (see Methods, Extended Data Fig. 4). For gel source data, see Supplementary Figure 2. b. Denoised cryo-EM micrograph of TREX–mRNPs (see Methods). TREX complexes are indicated with arrows heads. Scale bar, 500 Å. c. Single cryo-EM particles of TREX complexes on TREX–mRNPs are shown (left) next to corresponding 2D averages (right). A curved dashed line (white) separates TREX from mRNP densities in the 2D averages. A schematic of the 2D averages is shown underneath with protein colors as in panel a. d. TREX–mRNA structure shown from front and left side views. The UAP56 RecA1 (light pink) and RecA2 (pink) domains are observed in TREX monomer B, while monomer A is more mobile, precluding structural modelling of the UAP56 RecA1 lobe (see Extended Data Fig. 5d, g, h). Since ALYREF N- or C-terminal UAP56-binding motifs (UBMs) cannot be distinguished at low resolution, we label these peptides as ‘UBM’, and modelled them based on the C-UBM in the homologous yeast Sub2–Yra1–RNA crystal structure and AlphaFold2 multimer. In the inset (top center) TREX–mRNA complex dimers are labelled 1 and 2, and the constituent monomers A and B. THOC1 (green), -2 (light green), -3 (dark green), -5 (light blue), -6 (blue), -7 (light blue), UAP56 RecA1, -2 (light pink, pink), ALYREF (purple), putative mRNA (black). e. Details of the TREX–mRNA structure. THOC2 is colored in shades of green, other subunits and mRNA colored as in d. THOC6, and THOC5 and -7 C-terminal regions were omitted for clarity (see also Extended Data Fig. 5d, g, h). Domain organization (bottom) of THOC1, THOC2, and UAP56. Solid and dashed black lines indicate atomic and backbone regions, respectively. CD, charged domain; Death, death domain.
Figure 3
Figure 3. TREX–mRNP model and protein crosslinking.
a. The TREX–mRNP complex model in a left side view shows how ALYREF could simultaneously (i) recognize the mature mRNP through its WxHD and RRM domains, (ii) bind adjacent UAP56 helicases through its N- and C-UBMs, and (iii) guide mRNA to UAP56 through its RBD1 and -2 domains. Note that N- and C-UBM assignments show one of many possible arrangements and in native complexes not all ALYREF UBMs would need to be engaged with THO–UAP56. The shown model illustrates the concept of multivalent ALYREF UBM to UAP56 interactions (see Supplementary Video 5). To obtain this model, we superimposed the UAP56–ALYREF-mRNA model from TREX monomer B on monomer A. The THO complex is shown as a transparent cartoon. An ALYREF–EJC–RNA dimer was placed into the mRNP density. b. TREX–mRNP protein-protein crosslinks agree with the model. 3,125 crosslinked residues were detected using the UV-activatable crosslinker sulfo-SDA (2% protein-protein interaction-level false discovery rate). Inter- and intra-protein crosslinks are shown for selected TREX–mRNP proteins (see Extended Data Fig. 7, Supplementary Table 3). Crosslinks within TREX are shown in dark green lines, crosslinks from ALYREF to mRNP proteins in light green, within the EJC in orange, and within mRNP proteins in grey. Protein colors as in panel a.
Figure 4
Figure 4. TREX–mRNP complex architectures.
a. Isosurface representation of a denoised TREX–mRNP cryo-EM tomogram with annotated TREX complexes colored in green (see Methods and Extended Data Fig. 8). mRNP densities contain one, two, three, or no high-confidence TREX complexes and are colored in yellow, orange, pink, and grey, respectively. Scale bar, 500 Å. b. Gallery of TREX–mRNPs containing two TREX complexes. Examples I-VI show selected TREX–mRNPs with TREX complexes A (dark green) and B (light green) at various distances, d(A,B), and in various relative orientations, rotX,Y,z(A,B). The configuration of the in vitro (‘in’) reconstituted THO–UAP56 complex pair was not observed in endogenous TREX–mRNPs, due to the absence of an mRNA or mRNP substrate (see also panel d). c. Central atom distances and positions from TREX-A to -B (n=275) describe the surface of mRNP globules. The TREX-B central atom (THOC6 Glu 514 Χζ) is shown as a sphere and colored by its distance from the equivalent TREX-A atom. The dashed line indicates the pseudo-two-fold axis in TREX-A. The TREX-A (green) and its UAP56 (pink) is shown as ribbons. d. A t-SNE plot of TREX–mRNP pair distances and relative orientations revealed a lack of preferred TREX–TREX interaction modes (see Methods). Each TREX–mRNP pair is shown as a point, colored by the TREX-A to -B distance. We did not observe the in vitro THO–UAP56 pair (‘in’) or a parallel orientation of TREX pairs (‘p*’), which are both incompatible with TREX binding an mRNP. e. Examples of TREX–mRNPs containing three TREX complexes (A, B, and C) illustra how TREX can coat mRNP surfaces.
Figure 5
Figure 5. Model for mRNA packaging.
a. The TREX subunit ALYREF recognizes and may compact mature mRNPs by bringin neighboring EJCs together through multivalent protein-protein and protein-mRNA interactions. b. Compacted ALYREF-mRNPs may form mRNP globules containing a high concentration of ALYREF UBMs at the mRNP surface, where TREX complexes subsequently assemble. TREX licenses loading of the mRNA export factor, NXF1–NXT1, onto mRNPs and this may require an ATP-dependent step (see main text for details). mRNA export factor loading may occur in the nucleoplasm or at the nuclear pore complex, and thereby license mRNPs for nuclear export.

Similar articles

Cited by

References

    1. Köhler A, Hurt E. Exporting RNA from the nucleus to the cytoplasm. Nat Rev Mol Cell Biol. 2007;8:761–773. - PubMed
    1. Singh G, Pratt G, Yeo GW, Moore MJ. The Clothes Make the mRNA: Past and Present Trends in mRNP Fashion. Annu Rev Biochem. 2015;84:325–354. - PMC - PubMed
    1. Khong A, Parker R. The landscape of eukaryotic mRNPs. RNA. 2020;26:229–239. - PMC - PubMed
    1. Heath CG, Viphakone N, Wilson SA. The role of TREX in gene expression and disease. Biochemical Journal. 2016;473:2911–2935. - PMC - PubMed
    1. Xie Y, et al. Cryo-EM structure of the yeast TREX complex and coordination with the SR-like protein Gbp2. eLife. 2021 doi: 10.7554/eLife.65699. - DOI - PMC - PubMed

Publication types