. 2023 Apr;616(7956):348-356.
doi: 10.1038/s41586-023-05912-0. Epub 2023 Apr 5.

The NK cell receptor NKp46 recognizes ecto-calreticulin on ER-stressed cells

Affiliations

The NK cell receptor NKp46 recognizes ecto-calreticulin on ER-stressed cells

Sumit Sen Santara et al. Nature. 2023 Apr.

Erratum in

Abstract

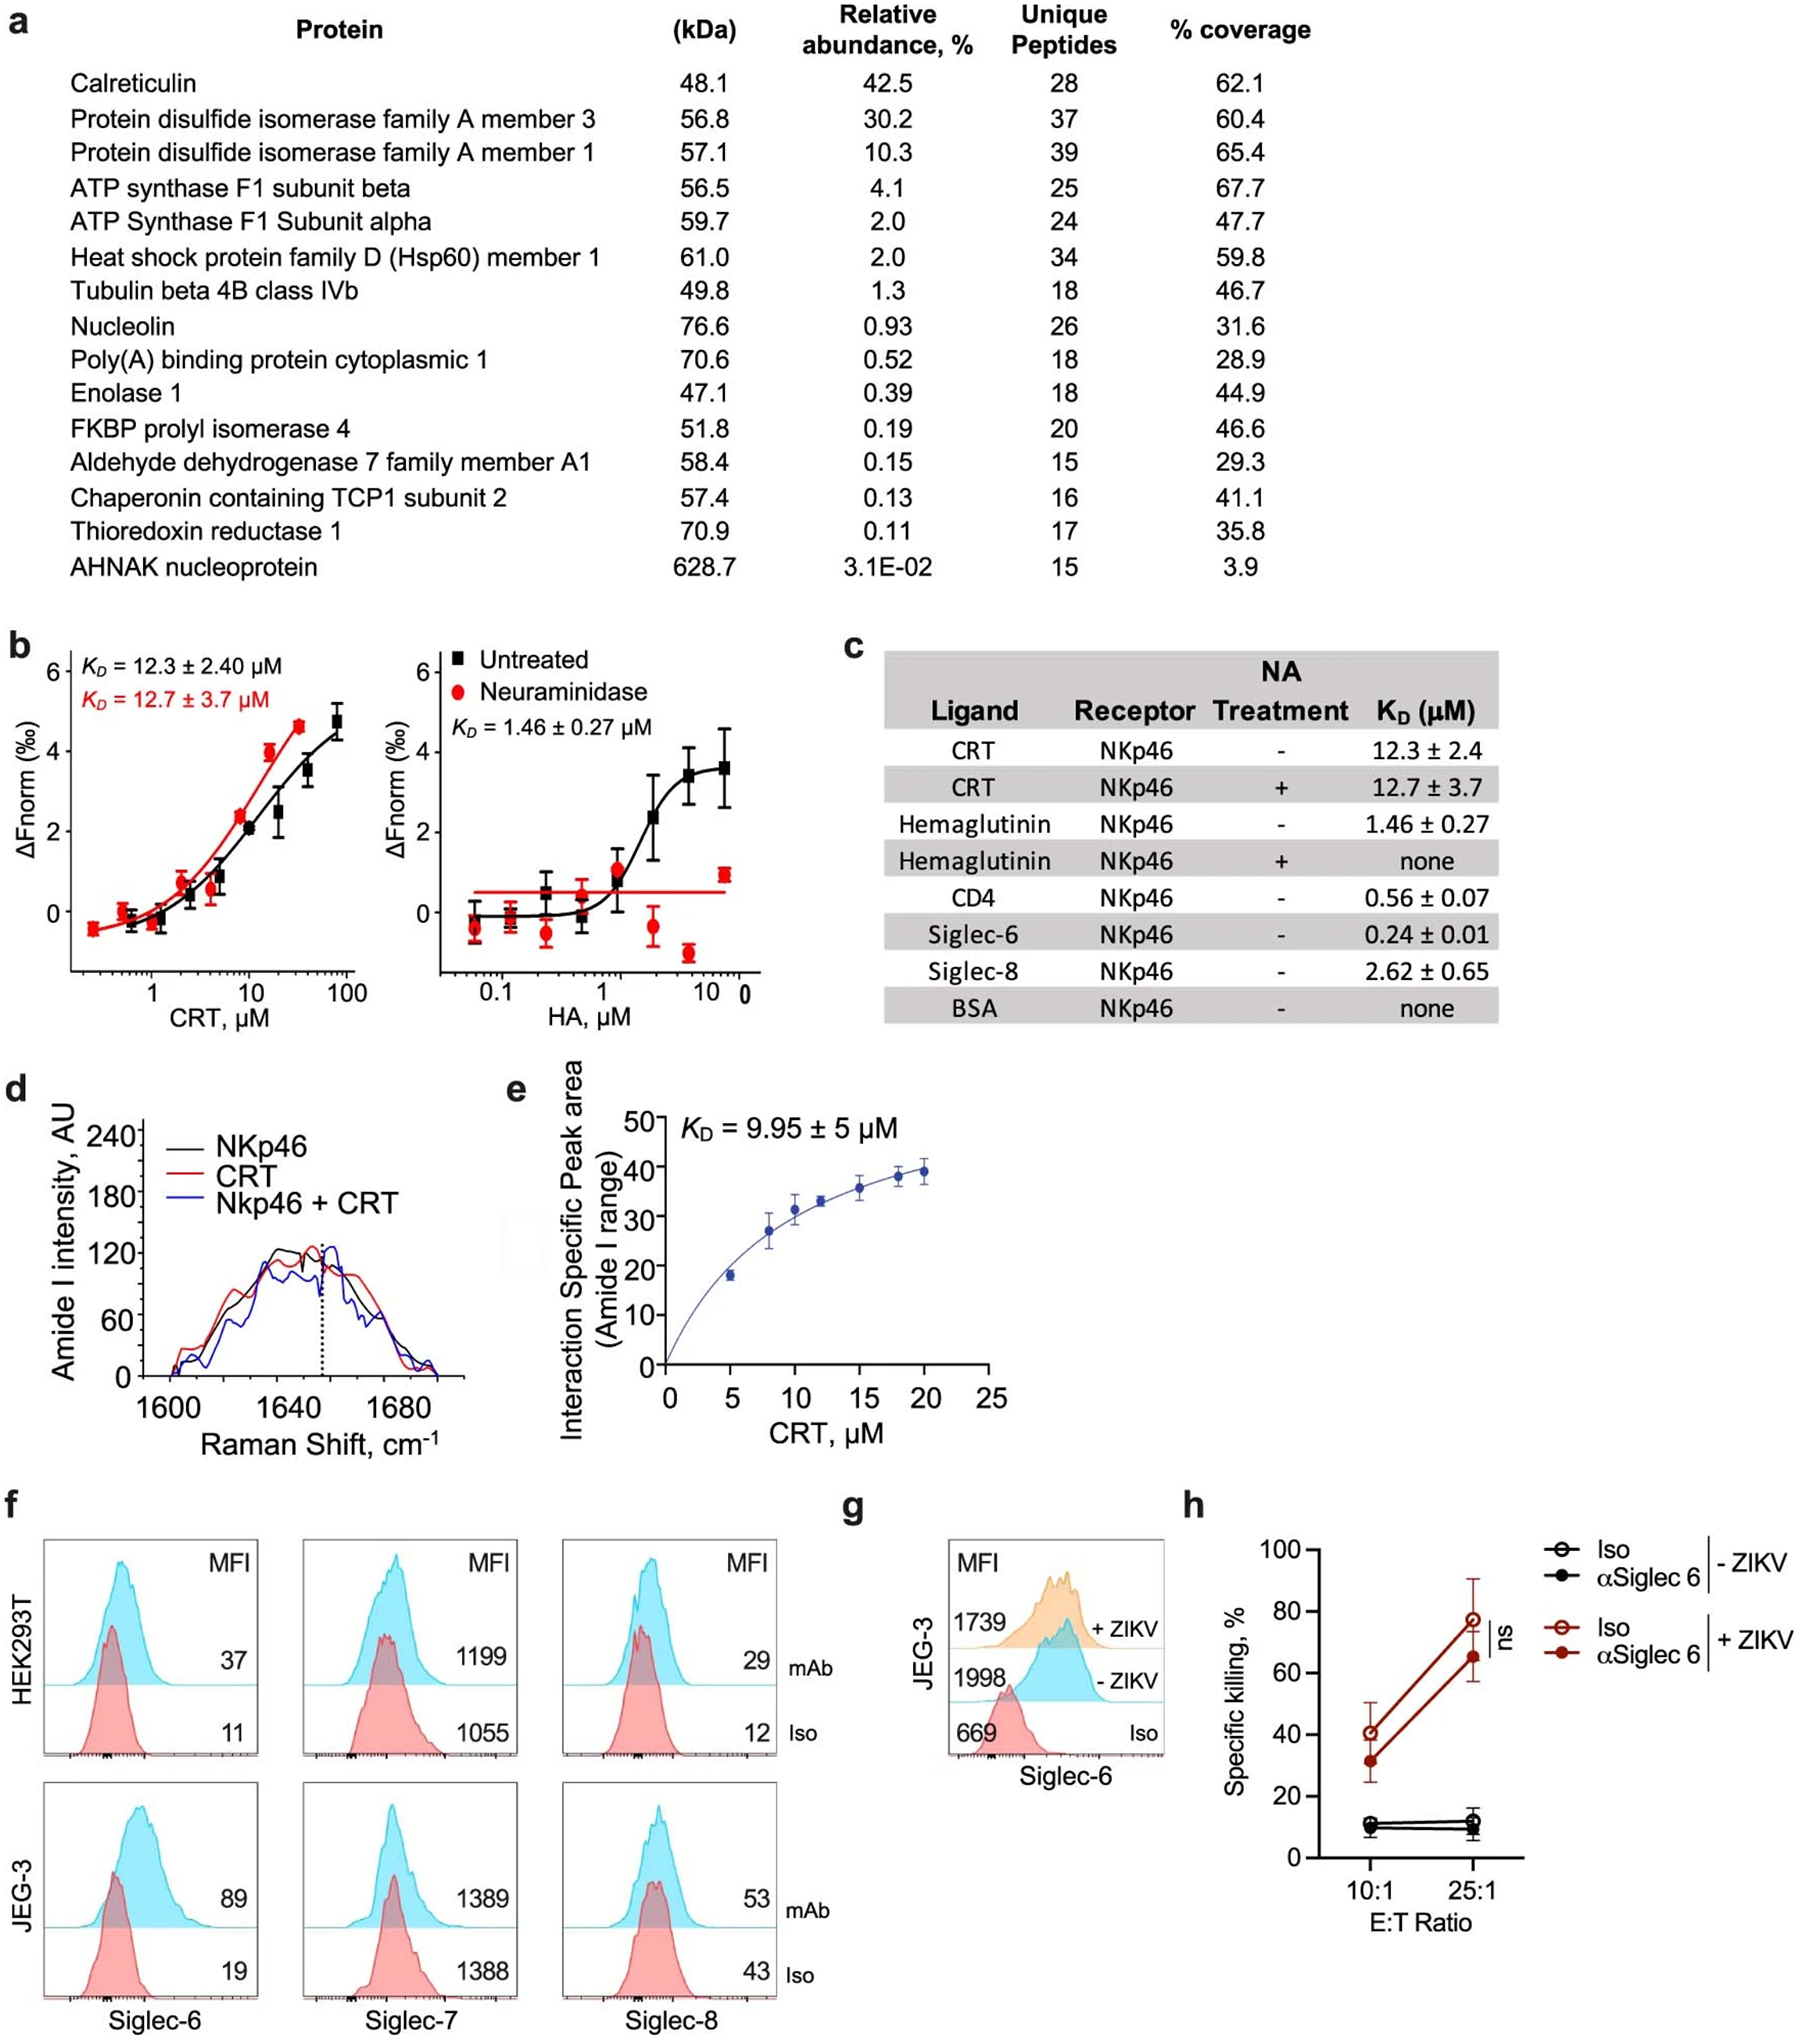
Natural killer (NK) cell kill infected, transformed and stressed cells when an activating NK cell receptor is triggered1. Most NK cells and some innate lymphoid cells express the activating receptor NKp46, encoded by NCR1, the most evolutionarily ancient NK cell receptor2,3. Blockage of NKp46 inhibits NK killing of many cancer targets4. Although a few infectious NKp46 ligands have been identified, the endogenous NKp46 cell surface ligand is unknown. Here we show that NKp46 recognizes externalized calreticulin (ecto-CRT), which translocates from the endoplasmic reticulum (ER) to the cell membrane during ER stress. ER stress and ecto-CRT are hallmarks of chemotherapy-induced immunogenic cell death5,6, flavivirus infection and senescence. NKp46 recognition of the P domain of ecto-CRT triggers NK cell signalling and NKp46 caps with ecto-CRT in NK immune synapses. NKp46-mediated killing is inhibited by knockout or knockdown of CALR, the gene encoding CRT, or CRT antibodies, and is enhanced by ectopic expression of glycosylphosphatidylinositol-anchored CRT. NCR1)-deficient human (and Nrc1-deficient mouse) NK cells are impaired in the killing of ZIKV-infected, ER-stressed and senescent cells and ecto-CRT-expressing cancer cells. Importantly, NKp46 recognition of ecto-CRT controls mouse B16 melanoma and RAS-driven lung cancers and enhances tumour-infiltrating NK cell degranulation and cytokine secretion. Thus, NKp46 recognition of ecto-CRT as a danger-associated molecular pattern eliminates ER-stressed cells.


Conflict of interest statement

Competing interests The authors declare no competing interests.

Figures

Extended Data Fig. 1:
NKp46 as an ER stress sensor. a, Effect of ER stress inhibitors on human peripheral blood NK cell killing of ZIKV-infected JEG-3 assessed by 8 h 51Cr release assay using an E:T ratio of 10:1 (n = 3 samples). UT, untreated. b,c Representative flow cytometry histograms of NKp46 (b) and NKp30 (c) surface expression on WT or NCR1 or NCR3 knockout clones of human YT. MFI is indicated. Iso, isotype control antibody. d, Gel filtration analysis of NKp46-Ig and protein standards separated on a Superdex 2000 Tricorn 10/600 column showing that NKp46-Ig migrates predominantly as a dimer and is not aggregated. Data in (a) are mean ± SEM of three technical replicates. Statistics by one-way ANOVA (a) P: *<0.05, **<0.01, ***<0.001.
Extended Data Fig. 2:
NKp46 binds to calreticulin. a, Proteins identified by mass spectrometry analysis of the cross-linked high molecular band in the NKp46-Ig pulldown of the membrane fraction of ZIKV-infected JEG-3, listed in order of ion abundance. b, Binding of neuraminidase treated (red) or untreated (black) Alexa647-labeled NKp46-Ig to His-tagged CRT (left) or His-tagged hemagglutinin (HA) (right) analyzed by microscale thermophoresis (MST, dissociation constant (KD)). c, MST measurement of NKp46 (pretreated or not with neuraminidase (NA) as indicated) binding to CRT and other reported ligands13. Data are mean±s.d. of three technical replicates. d,e, Raman spectra of normalized intensities (arbitrary units, AU) for recombinant NKp46 and CRT in the amide I range (1600–1700 cm−1) recorded individually and then after mixing. The mixture shows a new spectral feature (peak at dotted line) potentially indicating NKp46-CRT binding (d). Change in the peak area at 1658 cm-1 plotted vs CRT concentration (e). The peak areas were obtained by deconvolution of the spectral read-outs and the plotted data were subjected to hyperbolic fitting to derive the NKp46-CRT KD. f, Representative flow cytometry histograms of Siglec-6, −7, and −8 expression on HEK293T (top) and JEG3 (bottom). Iso, isotype control antibody (n = 3 samples). g, Representative flow cytometry histograms of the effect of ZIKV on JEG-3 Siglec-6 expression (n = 3 samples). h, Specific killing of ZIKV-infected or uninfected JEG-3 by peripheral blood NK cells in the presence or absence of anti-Siglec-6 (8 h 51Cr release, n = 3 donors). Data are representative of independent experiments (ae). Statistics were calculated by non-parametric one-way ANOVA followed by Tukey’s post-hoc test for area under curves (h). Graphs show mean ± SEM. ns, not significant.
Extended Data Fig. 3:
Modeling of the interaction of the calreticulin P-domain with NKp46. a, Molecular surface representation of NKp46 (accession no. O76036) and CRT (accession no. P27797) based on sequence derived 3D structure generated by I-TASSER. b, Sequence alignment of human NKp46 (top) and CRT (middle) proteins (accession nos. O76036, P27797), and monkey (Q8MIZ9, Q4R6K8) and chimpanzee (Q08I01, H2QFH8) CRT, respectively. Conserved residues important in binding are labeled with a red box. Sequence alignment of the tip module of P domains of the CRT/CNX family (bottom). The Asp258 residue required for binding is labeled with a red box. c, Docked complex of NKp46 and CRT represented as a surface assembly; surface charge is shown for the entire complex (scale bar representing the charge gradient from negative (red) to positive surface charge (blue)). Circled regions represent the binding pocket, which are further magnified in (d). d, Magnified interaction of NKp46 (surface charge representation) and CRT P-domain (in stick and ribbon representation) showing specific P-domain Asp residues in the positively charged cleft of NKp46. NKp46 R160 is marked in the positively charged region of the NKp46 cleft. e, Magnification of the circled regions at the top and bottom of the binding cleft in (d) showing salt bridges and hydrogen bonds (dashed black lines) between NKp46 residues (blue sticks and black labels) and CRT (green sticks and red labels). f, Sequence alignment of the P domain of mouse and human CRT. The Asp and Glu residues implicated in binding are boxed in red. g, Representative flow cytometry histograms of mouse ecto-CRT and NKp46-Ig binding (left) and mean fluorescence intensity (MFI, right) of 2 samples of B16 stably transfected with empty vector (EV) or WT or mutated GPI-CRT. Untransfected B16 display little ecto-CRT. h, Killing by splenic NK cells from 3 WT mice of B16 stably transfected with EV or WT or mutated mouse GPI-CRT (8 h 51Cr release assay, E:T ratio 10:1). Data are representative of 3 experiments, mean ± SEM. Statistics by one-way ANOVA (g,h). P: **<0.01; ***<0.001.
Extended Data Fig. 4:
Knockout and knockdown of CALR and PDIA3. a, CRT immunoblot in WT or CALR knockout HEK293T clones compared to tubulin loading control. b, Flow cytometry of externalized CRT (Ecto-CRT) or NKp46-Ig binding on untreated HEK293T CALR−/− cells reconstituted with CALR constructs (representative histograms (left), MFI of n = 3 samples (right)). c, qRT-PCR of CALR and PDI after knockdown of indicated genes in JEG-3, normalized to 18S rRNA (n = 3 samples). d, Representative flow cytometry histograms of MHC class I surface expression (W6/32 antibody) on JEG-3, knocked down for CALR, PDI3 or with nontargeting (Ctl) siRNAs (left); MFI of 3 samples (right). e, JEG-3, knocked down for CALR and/or PDIA3 or with nontargeting (Ctl) siRNAs, were infected or not with ZIKV and analyzed for ecto-CRT by flow cytometry. Representative histograms (left); MFI of 3 samples (right). f, JEG-3, knocked down for CALR and/or PDI3 or with nontargeting (Ctl) siRNAs were infected or not with ZIKV and analyzed for NKp46-Ig binding by flow cytometry; representative histograms of NKp46-Ig binding (left) and MFI of 3 samples (right). g, Peripheral blood NK killing (n = 6 donors) of knocked down JEG-3. h, Effect of anti-CRT and/or anti-PDI on NKp46-Ig binding to JEG-3 that were infected or not with ZIKV. Representative flow histograms (left) and MFI of 3 samples (right). i, Effect of anti-CRT, anti-PDI and anti-NKp46 on peripheral blood NK killing of uninfected or ZIKV-infected JEG-3. (g,i, 4 h 51Cr release assay, E:T ratio 10:1, n = 3 donors). Data are representative of three independent experiments (a). Graphs shown mean ± SEM. Statistics were performed using one-way ANOVA (b,di), or two-tailed non-parametric unpaired t-test (c). P: *<0.05; **<0.01; ****<0.0001.
Extended Data Fig. 5:
Ectopic expression of GPI-linked CRT in B16 does not alter in vitro cell proliferation but increases colony formation, invasivity and migration across a membrane. Untransfected B16 cell line (UT) or clones of B16 stably transfected with empty vector (EV) or with an expression plasmid for GPI-CRT were analyzed for Ecto-CRT (a) and H-2Kb (b) by flow cytometry, cell proliferation (c), colony formation (d), invasion through a Transwell (e) and migration through a Transwell membrane in response to serum (f) (cf, n = 4 samples). In a,b, representative flow cytometry histograms (left); MFI of 3 samples (right). Shown are mean ± SEM of at least 3 replicates. Statistics by two-tailed non-parametric unpaired t-test (a,b), area under the curve, followed by one-way ANOVA (c) and one-way ANOVA (df). P: *<0.05, **<0.01; ***<0.001, ****<0.0001.
Extended Data Fig. 6:
Ectopic expression of ecto-CRT in B16 does not significantly change numbers of tumour-infiltrating cells but suppresses tumour growth in an Ncr1-dependent manner. ac, Empty vector (EV) or GPI-CRT-expressing B16 tumour clones were implanted sc in WT (filled bars) and Ncr1−/− (unfilled bars) mice (n = 7/group) and mice were sacrificed 24 d later (Extended Data related to Fig. 4a). Shown are numbers of tumour-infiltrating cells (a) and functional markers (b,c) of NK (top) and CD8+ (bottom) TIL assessed at time of sacrifice 24 days after tumour implantation. b, GzmB (left) and PFN (right) expression. c, PMA + ionomycin stimulated IFNγ (left) and TNF (right) production. d, Schema (left) of experiment in Fig. 4b and representative flow cytometry plots (right) of mouse blood mononuclear cells, obtained on day 3 after tumour implantation, showing CD8+ T depletion with cell type-specific antibody compared to isotype control antibody. e, Schema of adoptive transfer experiment in Fig. 4c. f, Schema of metastasis experiment in Fig. 4d and representative flow cytometry of NK (αNK.1.1) and macrophage (αCSF1R) depletion compared to isotype control antibody. The integrin CD49b is a pan-NK marker. Graphs in (ac) show mean ± SEM of 5 biological samples representative of 2 independent experiments; graphs are mean ± SEM. Statistics calculated by non-parametric one-way ANOVA followed by Tukey’s post-hoc test for areas under curves (ac).
Extended Data Fig. 7:
Ncr1 enhances doxorubicin suppression of B16 tumours. a, Representative flow cytometry histograms of ecto-CRT (left) and mean ± SEM ecto-CRT MFI (right) of B16 treated or not in vitro for 24 h with doxorubicin (DOX) (n = 3 samples). Iso, isotype control antibody staining; UT, untreated. b, Representative flow cytometry histograms of ecto-CRT expression on untreated (UT) and DOX-treated B16 that were pretreated or not with indicated ER stress inhibitors. cg, B16 were injected sc into WT or Ncr1−/− mice (n = 7 group). and animals were treated with DOX iv 12 and 20 d after tumour implantation (red arrows). Tumour growth (c), numbers of tumour-infiltrating immune cells (d) and functional markers of NK (top) and CD8+ (bottom) TIL were assessed at time of sacrifice for cytotoxic granule protein expression (e), cytokine secretion (f) and degranulation (g) after PMA + ionomycin stimulation ex vivo. Graphs show mean ± SEM of at least 5 biological samples and are representative of 2 independent experiments. Statistics calculated by two-tailed non-parametric unpaired t-test (a), areas under curves followed by two-tailed parametric unpaired t-test (c), and non-parametric one-way ANOVA followed by Tukey’s post-hoc test (b,dg). P: *<0.05; ***<0.001; ****<0.0001; ns, not significant.
Extended Data Fig. 8:
Trame3nib and palbociclib induces senescence in human A549 lung cancer cells and activates NK through NKp46 and NKG2D. a, Representative flow cytometry histograms of β-galactosidase activity (SA-βgal) in A549 that were untreated (UT) or treated with trametinib and palbociclib (T+P) (left) and MFI (right) of 3 samples. b, ER stress, assessed by qRT-PCR assay of XBP1 splicing and BIP and CHOP mRNA, in untreated and T+P-treated A549 (n = 3 samples). c, Representative flow cytometry histograms of CRT, ICAM1 and MICA/B expression on untreated and T+P-treated A549 (left) and mean±SEM MFI (right) (n = 2 cell line samples). Iso, IgG1 isotype control antibody staining. d, Effect of NKR blocking antibodies (NKp46, NKG2D and NKp30) or anti-CRT compared to isotype control antibody (Iso) on YT killing of untreated or T+P-treated A549 (8 h 51Cr release, E:T ratio 25:1, n = 3 samples). The same isotype control IgG1 antibody was used in all panels. e, Specific killing of untreated or T+P-treated A549 by YT, knocked out or not for NCR1, in the presence or absence of CRT blocking Ab (8 h 51Cr release, E:T ratio 25:1; n = 3 samples). Graphs show mean ± SEM of at least 3 independent experiments. Statistics were calculated by two-tailed non-parametric unpaired t-test (a), unpaired two-way ANOVA (ad) and non-parametric one-way ANOVA followed by Tukey’s post-hoc test for area under curves (e). P: *<0.05; ***<0.001; ****<0.0001.
Extended Data Fig. 9:
Trametinib and palbociclib treatment of WT and Ncr1 or Klrk1 deficient mice bearing subcutaneous KP tumours does not affect the numbers of tumour-infiltrating immune cells or the functional phenotype of tumour-infiltrating CD8+ T cells. KP cells were injected sc into WT, Ncr1−/− or Klrk1−/− mice (n = 5–7/group) and animals were treated with trametinib and palbociclib (T+P) by oral gavage 13–18 d after tumour implantation (Extended data linked to Fig. 4i, k). Tumour-infiltrating cells were analyzed at the time of sacrifice (23 d post tumour implantation). a, Number of tumour-infiltrating immune cells. b,c, CD8+ TIL expression of cytotoxic granule proteins (b) and cytokine production (c). Bar graphs show mean ± SEM of at least 3 independent experiments and statistics by unpaired one-way ANOVA.
Extended Data Fig. 10
Senescence inducer CuSO4, which causes ER stress, activates NKp46- and NKG2D-dependent NK killing, but 4-PBA, which induces senescence without ER stress, does not. a, Representative flow cytometry histograms of β-galactosidase activity (SA-βgal) (left) and MFI of 3 samples (right) of KP that were untreated (UT) or treated with CuSO4 or 4-PBA. b, ER stress, assessed by qRT-PCR of Xbp1 splicing and Bip and Chop mRNA, in untreated and CuSO4 or 4-PBA treated KP (3 samples). c, Representative flow cytometry histograms of CRT and RAE1 expression on KP treated or not with CuSO4 or 4-PBA (left); MFI of 3 samples (right). d, Killing of KP that were UT or treated with CuSO4 or 4-PBA by splenic NK from WT, Ncr1−/− or Klrk1−/− mice (4 h 51Cr release, E:T ratio 20:1). Bar graphs show mean ± SEM of at least 3 independent experiments. Statistics by unpaired one-way ANOVA. P: *<0.05; **<0.01; ***<0.001, ****<0.0001.
Fig. 1:
Fig. 1:
NK cells recognize ZIKV-infected and ER-stressed target cells. a, Representative flow cytometry plots (leD) and percentage of degranulating NK cells isolated from the blood of ten healthy donors (right), as measured by surface CD107a, in response to uninfected and ZIKV-infected JEG-3 cells (8 h coculture, E:T ratio 1:3). b, NK cell-specific killing of uninfected and ZIKV-infected JEG-3 cells. c, ER stress, as assessed by XBP1 splicing (leD) and increases in BIP (middle) and CHOP (right) mRNA, in JEG-3 cells that were uninfected or infected with ZIKV, HSV-2 or human cytomegalovirus (HCMV) for 1–2 days or treated with tunicamycin (Tu) for 1 day. Indicated samples were pretreated with the ER stress inhibitor salubrinal (n = 3 samples). mRNA levels, as assayed by quantitative PCR with reverse transcription (RT–qPCR), were normalized to ACTB. d, Effect of salubrinal pretreatment of target cells on NK cell killing of ZIKV-infected (top) and tunicamycin-treated (bobom) JEG-3 cells (n = 6 samples). e, Effect of NKR-blocking antibodies (Ab) on NK cell killing of uninfected or ZIKV-infected JEG-3 cells (n = 3–7 samples). Ctrl, control. f, Specific killing of the classical NK cell target 722.221 cells, or of uninfected or ZIKV-infected JEG-3 cells by human NK cell line YT cells knocked out for NCR1 or NCR3 or treated with control single-guide RNAs (n = 3–6 samples). g, Representative flow cytometry histogram (leD) and mean fluorescence intensity (MFI) of NKR–Ig fusion protein (NKp46–Ig and NKG2D–Ig) binding to uninfected or ZIKV-infected JEG-3 cells (right) (n = 3 samples). b,df, Specific killing assessed by 8 h 51Cr release assay using an E:T ratio of 10:1 unless otherwise indicated. Data are mean ± s.e.m. of at least three independent experiments or technical replicates. Statistics were performed using two-tailed, nonparametric, unpaired t-test (a,b), one-way analysis of variance (ANOVA) (c), two-way ANOVA (eg) or area under the curve followed by one-way ANOVA (d). *P < 0.05, **P < 0.01, ***P < 0.001, ****P < 0.0001.
Fig. 2:
Fig. 2:
NKp46 recognizes the P domain of ecto-CRT. a, Immunoblot of proteins pulled down and chemically crosslinked with NKG2D–Ig or NKp46–Ig. The high-molecular-mass band in ZIKV-infected cells (red arrowhead) was analysed by mass spectrometry for candidate NKp46 ligands. Proteins with the highest peptide coverage are indicated. The ZIKV-specific NKp46–Ig pulldown low-molecular-mass bands contained contaminating BSA and protein A, but not NKp46–Ig, peptides. b, Representative flow cytometry histograms of surface CRT, PDI and HSP70 on untreated (UT), tunicamycin or ZIKV-infected JEG-3 cells (left) and percentage of cells staining in three independent samples (right). Iso, isotype control antibody staining. c, Flow cytometry histograms of ecto-CRT on untreated or oxaliplatin-treated JEG-3 cells (left) and percentage of ecto-CRT+ cells staining (right, n = 3 samples). d, CRT immunoblot of NKp46–Ig, NKp44–Ig or NKp30–Ig pulldown of the membrane-enriched fraction of untreated or oxaliplatin-treated JEG-3 cells. HLA-G was probed as control. e, Phosphoflow cytometry of CD56+ WT or NCR1−/− YT cells incubated for 15 min with untreated or oxaliplatin-treated JEG-3 cells in the presence of anti-CRT or control antibody stained for p-CD3ξ (left), p-Syk (middle) and p-Tyr (right). YT cells were preincubated with anti-NKG2D to reduce NKG2D signalling. n = 2 independent samples; statistics compare untreated or oxaliplatin-treated samples and those preincubated with anti-CRT or Iso. f, Schematic of CRT domains: signal peptide, black; N domain, red; P domain, white; C domain, grey. FL or CRT domains were fused with a C-terminal Fc-tag (green) (left). CRT-Fc proteins incubated with MYC tagged NKp46 were pulled down with anti-MYC and immunoblot was probed with anti-Fc. g, Alexa:647-labelled NKp46-MYC binding to Fc-tagged CRT domains analysed by MST; dissociation constants (Kd) of NKp46 binding to FL and P domain are shown. h, BLI kinetic binding of NKp46–Ig to His-tagged CRT. Binding of NKp46–Ig, captured on anti-human IgG-Fc biosensors, was recorded for three CRT concentrations. Mean Kd of three independent experiments, each with two replicates, is indicated. ik, WT and CALR−/− HEK293T and CALR−/− HEK293T rescued with EV or CALR were untreated or tunicamycin- or oxaliplatin-treated and analysed by flow cytometry for ecto-CRT (n = 2 samples) (i), NKp46–Ig binding (n = 2 samples) (j) and human peripheral blood NK cell killing (n = 3 samples) (k). l, Representative flow cytometry histograms of ecto-CRT and NKp46–Ig binding (left) and MFI (right) of two individual samples of oxaliplatin-treated CALR−/− HEK293T cells transfected with EV or to express WT or mutated CALR. m, Human peripheral blood NK cell killing of untreated or oxaliplatin-treated CALR−/− HEK293T transfected as in l (n = 5 samples). k,m, Killing by 4 h 51Cr release assay. m, E:T ratio 10:1. a,d,fh, Data representative of three independent experiment. Data are mean ± s.e.m. Statistics were performed using either one-way ANOVA (b,e,i,j,l,m), two-tailed parametric unpaired t-test (c) or two-way ANOVA (k). *P < 0.05, **P < 0.01, ***P < 0.001, ****P < 0.0001.
Fig. 3:
Fig. 3:
NKp46 recognition of ecto-CRT enhances immune synapse formation and NK cell killing of tumour cell lines. a, Representative flow cytometry histograms of ecto-CRT (left) and MFI (right) of UT, cisplatin (CP)- and oxaliplatin (OP)-treated B16 (n = 3 samples). Iso, isotype control antibody staining. b, Effect of anti-CRT, anti-NKp46 and control antibody (Iso) on mouse splenic NK cell killing of untreated, cisplatin- and oxaliplatin-treated B16 (n = 3 or 5 samples). c, Killing of B16 by splenic NK cells from WT, Ncr1−/− and Klrk1−/− mice that were either untreated or treated with cisplatin or oxaliplatin (n = 3 or 5 samples). d, Representative flow cytometry histograms of CRT surface expression (left) and ecto-CRT MFI of three samples (right) of a polyclonal B16 cell line stably transfected with EV or to express GPI-linked CRT. e, Effect of ectopic ecto-CRT on mouse NKp46–Ig binding to B16. f, WT or Ncr1−/− splenic NK cell killing of EV or GPI-CRT-B16 (n = 3 samples). b,c,f, Killing assessed by 4 h 51Cr release, E:T ratio 10:1. g,h, Imaging flow cytometry of conjugates of splenic WT or Ncr1−/− NK cells with B16 that were untreated or oxaliplatin-treated (g) or transfected with EV or GPI-CRT plasmid (h). Shown are representative images of conjugates (left) and the percentage of cells forming NK–target cell conjugates (right). Cells were stained with CellTracker Red CMTPX (blue), anti-NKp46 (red), anti-CD49b (violet) or anti-CRT (green). Data shown are representative of around 1,000 individual images and of at least three independent experiments. Data are mean ± s.e.m. Statistics by unpaired one-way ANOVA (ac), two-tailed parametric unpaired t-test (d,e), two-way ANOVA (f) or two-sided Chi-squared test (g,h). *P < 0.05, **P < 0.01, ***P < 0.001, ****P < 0.0001.
Fig. 4:
Fig. 4:
NKp46 recognition of ecto-CRT suppresses tumour growth and is activated during senescence. ac, Tumour growth monitored in WT (a), Iso (b) and Ncr1−/− mice (c) injected subcutaneously with EV or GPI-CRT-B16 clones. b, Mice were treated with Iso or anti-CD8a. c, Splenic WT NK cells were adoptively transferred weekly (magenta arrowheads) beginning 4 d after tumour inoculation. a,b, n = 6 mice per group; c, n = 5 mice per group. d, EV or GPI-CRT-B16 was injected intravenously into WT and Ncr1−/− mice (n = 4 mice per group) treated with either anti-NK1.1, anti-CSF1R or Iso before and during tumour growth to deplete NK cells or macrophages. Visible lung metastases were counted on day 20. eg, Effect of in vitro trametinib and palbociclib (T + P) on senescence, ER stress and expression of NK-activating ligands on mouse KP. Shown are representative flow cytometry histograms of SA-βgal (left) and MFI of three cell samples (right) (e), RT–qPCR of Xbp1 splicing and Bip and Chop mRNA (f) and CRT and RAE1 expression (g) (n = 3 samples). h, In vitro killing by splenic WT, Ncr1−/− or Klrk1−/− NK cells of KP that were either untreated or treated with T + P (4 h 51Cr release, E:T ratio 20:1, n = 3 samples). ik, Effect of oral T + P on KP scubcutaneous tumours implanted in WT, Ncr1−/− and Klrk1−/− mice (n = 5–7 mice per group). Shown are tumour growth (i) and NK cell TIL GzmB and PFN (j) and cytokine production (k) at euthanization. i, Statistical differences in growth of T + P-treated KP tumours in different mouse strains were: WT versus Ncr1−/−, P < 0.0001); WT versus Klrk1−/−, not significant (NS)) and Ncr1−/− versus Klrk1−/−, P = 0.005). Data are mean ± s.e.m. of at least three independent experiments. Statistics calculated by area under the curve followed by two-tailed nonparametric unpaired t-test (ac,i), one-way ANOVA (d,j,k), two-tailed nonparametric unpaired t-test (e) or two-way ANOVA (fh). *P < 0.05, **P < 0.01, ***P < 0.001, ****P < 0.0001.

Comment in

References

    1. Raulet DH & Guerra N Oncogenic stress sensed by the immune system: role of natural killer cell receptors. Nat. Rev. Immunol 9, 568–580 (2009). - PMC - PubMed
    1. Sivori S et al. p46, a novel natural killer cell-specific surface molecule that mediates cell activation. J. Exp. Med 186, 1129–1136 (1997). - PMC - PubMed
    1. Barrow AD, Martin CJ & Colonna M The natural cytotoxicity receptors in health and disease. Front. Immunol 10, 909 (2019). - PMC - PubMed
    1. Sivori S et al. NKp46 is the major triggering receptor involved in the natural cytotoxicity of fresh or cultured human NK cells. Correlation between surface density of NKp46 and natural cytotoxicity against autologous, allogeneic or xenogeneic target cells. Eur. J. Immunol 29, 1656–1666 (1999). - PubMed
    1. Obeid M et al. Calreticulin exposure dictates the immunogenicity of cancer cell death. Nat. Med 13, 54–61 (2007). - PubMed

Publication types