. 2023 May;42(20):1661-1671.
doi: 10.1038/s41388-023-02681-y. Epub 2023 Apr 5.

Atypical teratoid/rhabdoid tumoroids reveal subgroup-specific drug vulnerabilities

Affiliations

Atypical teratoid/rhabdoid tumoroids reveal subgroup-specific drug vulnerabilities

Irene Paassen et al. Oncogene. 2023 May.

Abstract

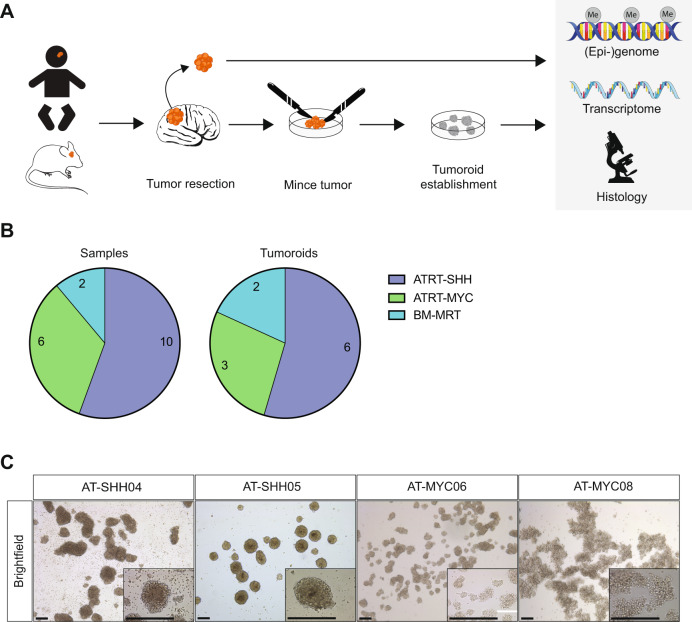
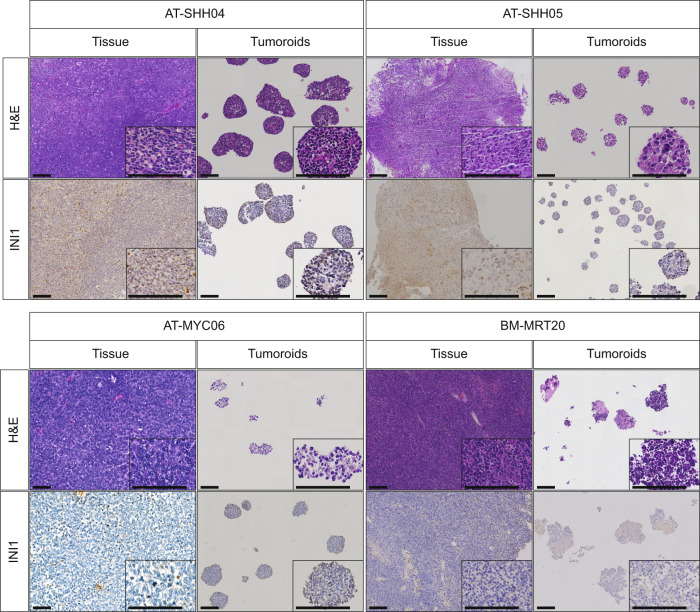
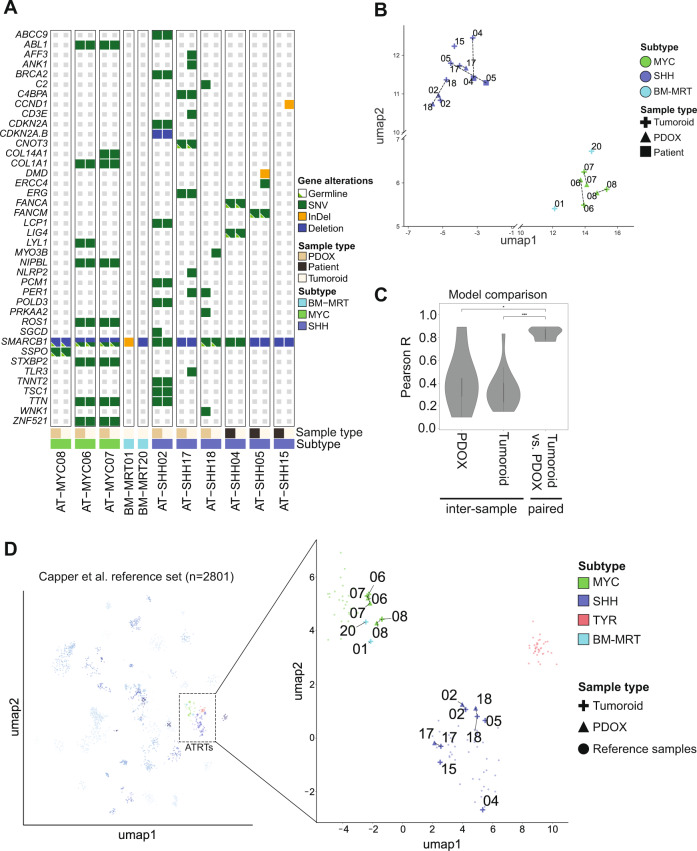
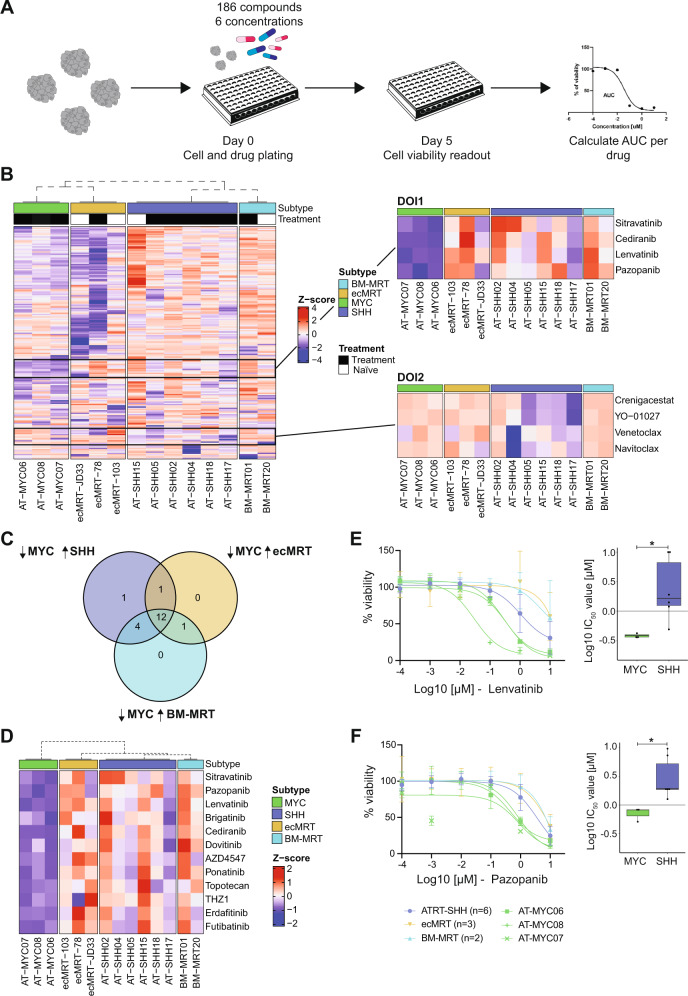
Atypical teratoid/rhabdoid tumors (ATRTs) represent a rare, but aggressive pediatric brain tumor entity. They are genetically defined by alterations in the SWI/SNF chromatin remodeling complex members SMARCB1 or SMARCA4. ATRTs can be further classified in different molecular subgroups based on their epigenetic profiles. Although recent studies suggest that the different subgroups have distinct clinical features, subgroup-specific treatment regimens have not been developed thus far. This is hampered by the lack of pre-clinical in vitro models representative of the different molecular subgroups. Here, we describe the establishment of ATRT tumoroid models from the ATRT-MYC and ATRT-SHH subgroups. We demonstrate that ATRT tumoroids retain subgroup-specific epigenetic and gene expression profiles. High throughput drug screens on our ATRT tumoroids revealed distinct drug sensitivities between and within ATRT-MYC and ATRT-SHH subgroups. Whereas ATRT-MYC universally displayed high sensitivity to multi-targeted tyrosine kinase inhibitors, ATRT-SHH showed a more heterogeneous response with a subset showing high sensitivity to NOTCH inhibitors, which corresponded to high expression of NOTCH receptors. Our ATRT tumoroids represent the first pediatric brain tumor organoid model, providing a representative pre-clinical model which enables the development of subgroup-specific therapies.


Conflict of interest statement

The authors declare no competing interests.

Figures

Fig. 1
Fig. 1. Establishment of ATRT tumoroid models from primary tissues.
A Schematic overview of the tissue handling workflow and downstream applications. B Pie chart representing number of collected samples subdivided per subgroup and paired number of successful tumoroid model establishment. Details of each tumoroid model are provided in Table 1. C Brightfield microscopy images of ATRT tumoroid models. Scale bars equal 100 µm.
Fig. 2
Fig. 2. Immunohistochemical characterization of ATRT tumoroid models.
H&E and INI1 stainings of the indicated ATRT tumoroid models and matching tissues (H&E = hematoxylin & eosin staining, INI1 = protein encoded by the SMARCB1 gene). Scale bars equal 100 µm.
Fig. 3
Fig. 3. Molecular classification of ATRT tumoroid models.
A Oncoprint of gene alterations found in ATRT tumoroids and matching parental tissue (patient or PDOX). Germline mutations are indicated by a small green triangle. B UMAP plot of paired parental source (primary or PDOX) and tumoroid gene expression profiles generated by RNAseq. Related samples are indicated by a dashed line; subgroup is indicated by color, and sample source indicated by shape. C Comparison of sample consistency using the 3000 most variable DNA methylation array probes in the ATRT reference set, applied to the tumoroid and PDOX dataset. The Pearson’s R was calculated for all unique sample comparisons (inter-sample within one subgroup) or paired between two matching sample types (tumoroid versus parental tissue). Model comparisons are performed with the complete dataset, combining MYC inter-sample and SHH inter-sample comparison results (“PDOX”, “Tumoroid”); MYC-paired and SHH-paired comparison results were combined separately (“Tumoroid versus PDOX”). Statistical significance was determined by Mann–Whitney test (*: p ≤ 0.05, **: p ≤ 0.01, ***: p ≤ 0.001). D UMAP plot of reference samples, paired parental source (patient or PDOX), and tumoroid DNA methylation profiles. Related samples are indicated by dashed line; subgroup is indicated by color, and sample source indicated by shape.
Fig. 4
Fig. 4. High throughput drug screens reveal subgroup-specific vulnerabilities.
A Schematic overview of the drug screen workflow. B Clustering based on subgroup using z-scores calculated per row for 186 drugs. Black boxes indicate drugs of interest (DOI) regions within the left heatmap. DOI1 depicts the four top hits for the ATRT-MYC subgroup. DOI2 depicts the four top hits for the ATRT-SHH subgroup. C Identification of ATRT-MYC-specific compounds by comparing ATRT-MYC (z-score < −1) versus the other tumor entities (z-score > 0). D Heatmap of the z-scores of the 12 drugs of interest. Dashed dendrogram indicates supervised clustering by subgroup. E Dose response curve of Lenvatinib (left) and corresponding Log10 IC50 values per subgroup (right) (two-tailed unpaired Wilcoxon test; *: p ≤ 0.05). F Dose response curve of Pazopanib (left) and corresponding Log10 IC50 values per subgroup (right) (two-tailed unpaired Wilcoxon test; *: p ≤ 0.05).
Fig. 5
Fig. 5. Patient-specific drug vulnerabilities within the ATRT-SHH subgroup.
A Identification of ATRT-SHH-specific compounds by comparing SHH (z-score < −0.5) versus the other tumor entities (z-score > 0). B Heatmap depicting z-scores of the five drugs of interest for the ATRT-SHH subgroup. Dashed dendrogram indicates supervised clustering by subgroup. C Dose response curves of Crenigacestat and YO-01027 (gamma-secretase inhibitors). Sample subgroups are indicated by color and individual SHH samples are indicated by shape and plotted individually. D Heatmap showing z-scores of trimmed mean of M values (TMM) normalized gene expression for all ATRT tumoroid models for several genes in the NOTCH pathway. E Dose response curves of Navitoclax and Venetoclax. Sample subgroups are indicated by color and individual SHH samples are indicated by shape and plotted individually. F Representation of BCL2 and BCL-W gene expression in normalized TPM values of ATRT-SHH tumoroid models. AT-SHH04 is highlighted as the only responder of the ATRT-SHH tumoroid model (red square).

References

    1. Versteege I, Sévenet N, Lange J, Rousseau-Merck MF, Ambros P, Handgretinger R, et al. Truncating mutations of hSNF5/INI1 in aggressive paediatric cancer. Nature. 1998;394:203–6. doi: 10.1038/28212. - DOI - PubMed
    1. Tang M, Verhaak RGW. A Molecular Take on Malignant Rhabdoid Tumors. Vol. 2, Trends in Cancer. Cell Press; 2016:217–8. http://www.ncbi.nlm.nih.gov/pubmed/27672680 - PubMed
    1. Biegel JA, Zhou JY, Rorke LB, Stenstrom C, Wainwright LM, Fogelgren B. Germ-Line and Acquired Mutations of INI1 in Atypical Teratoid and Rhabdoid Tumors. Cancer Res. 1999;59:74–9. - PubMed
    1. Dufour C, Beaugrand A, le Deley MC, Bourdeaut F, André N, Leblond P, et al. Clinicopathologic prognostic factors in childhood atypical teratoid and rhabdoid tumor of the central nervous system. Cancer. 2012;118:3812–21. doi: 10.1002/cncr.26684. - DOI - PubMed
    1. Reddy AT, Strother DR, Judkins AR, Burger PC, Pollack IF, Krailo MD, et al. Efficacy of High-Dose Chemotherapy and Three-Dimensional Conformal Radiation for Atypical Teratoid/Rhabdoid Tumor: A Report From the Children’s Oncology Group Trial ACNS0333. J Clin Oncol. 2020;38:1175–85. doi: 10.1200/JCO.19.01776. - DOI - PMC - PubMed

Publication types