Review
. 2023 Aug;33(8):5309-5320.
doi: 10.1007/s00330-023-09596-y. Epub 2023 Apr 5.

Clinical applications of photon counting detector CT

Affiliations
Review

Clinical applications of photon counting detector CT

Cynthia H McCollough et al. Eur Radiol. 2023 Aug.

Abstract

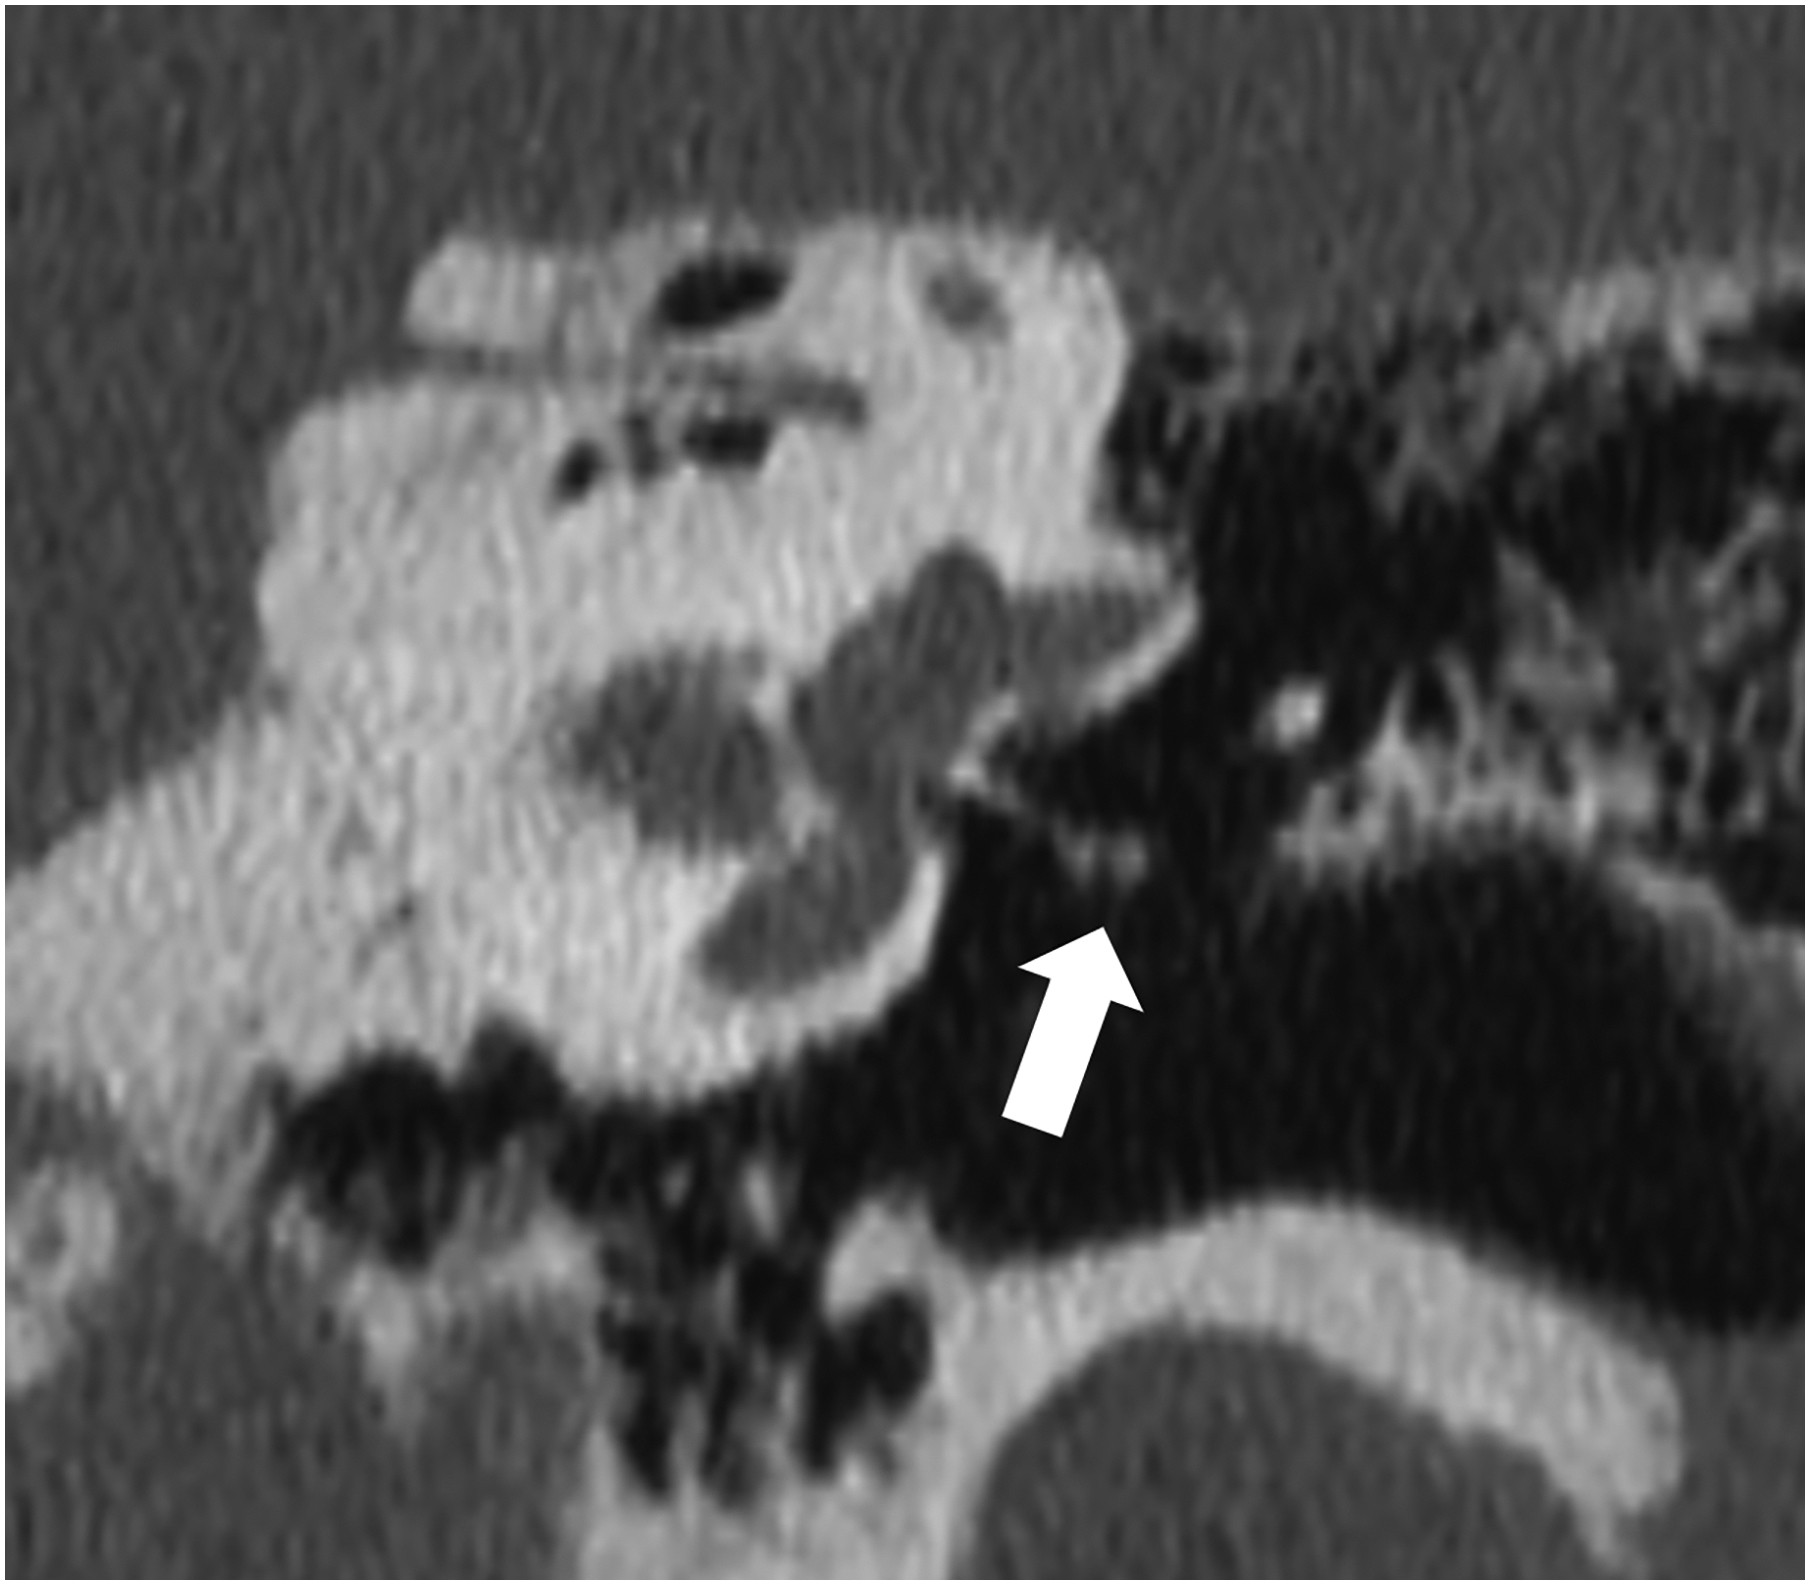
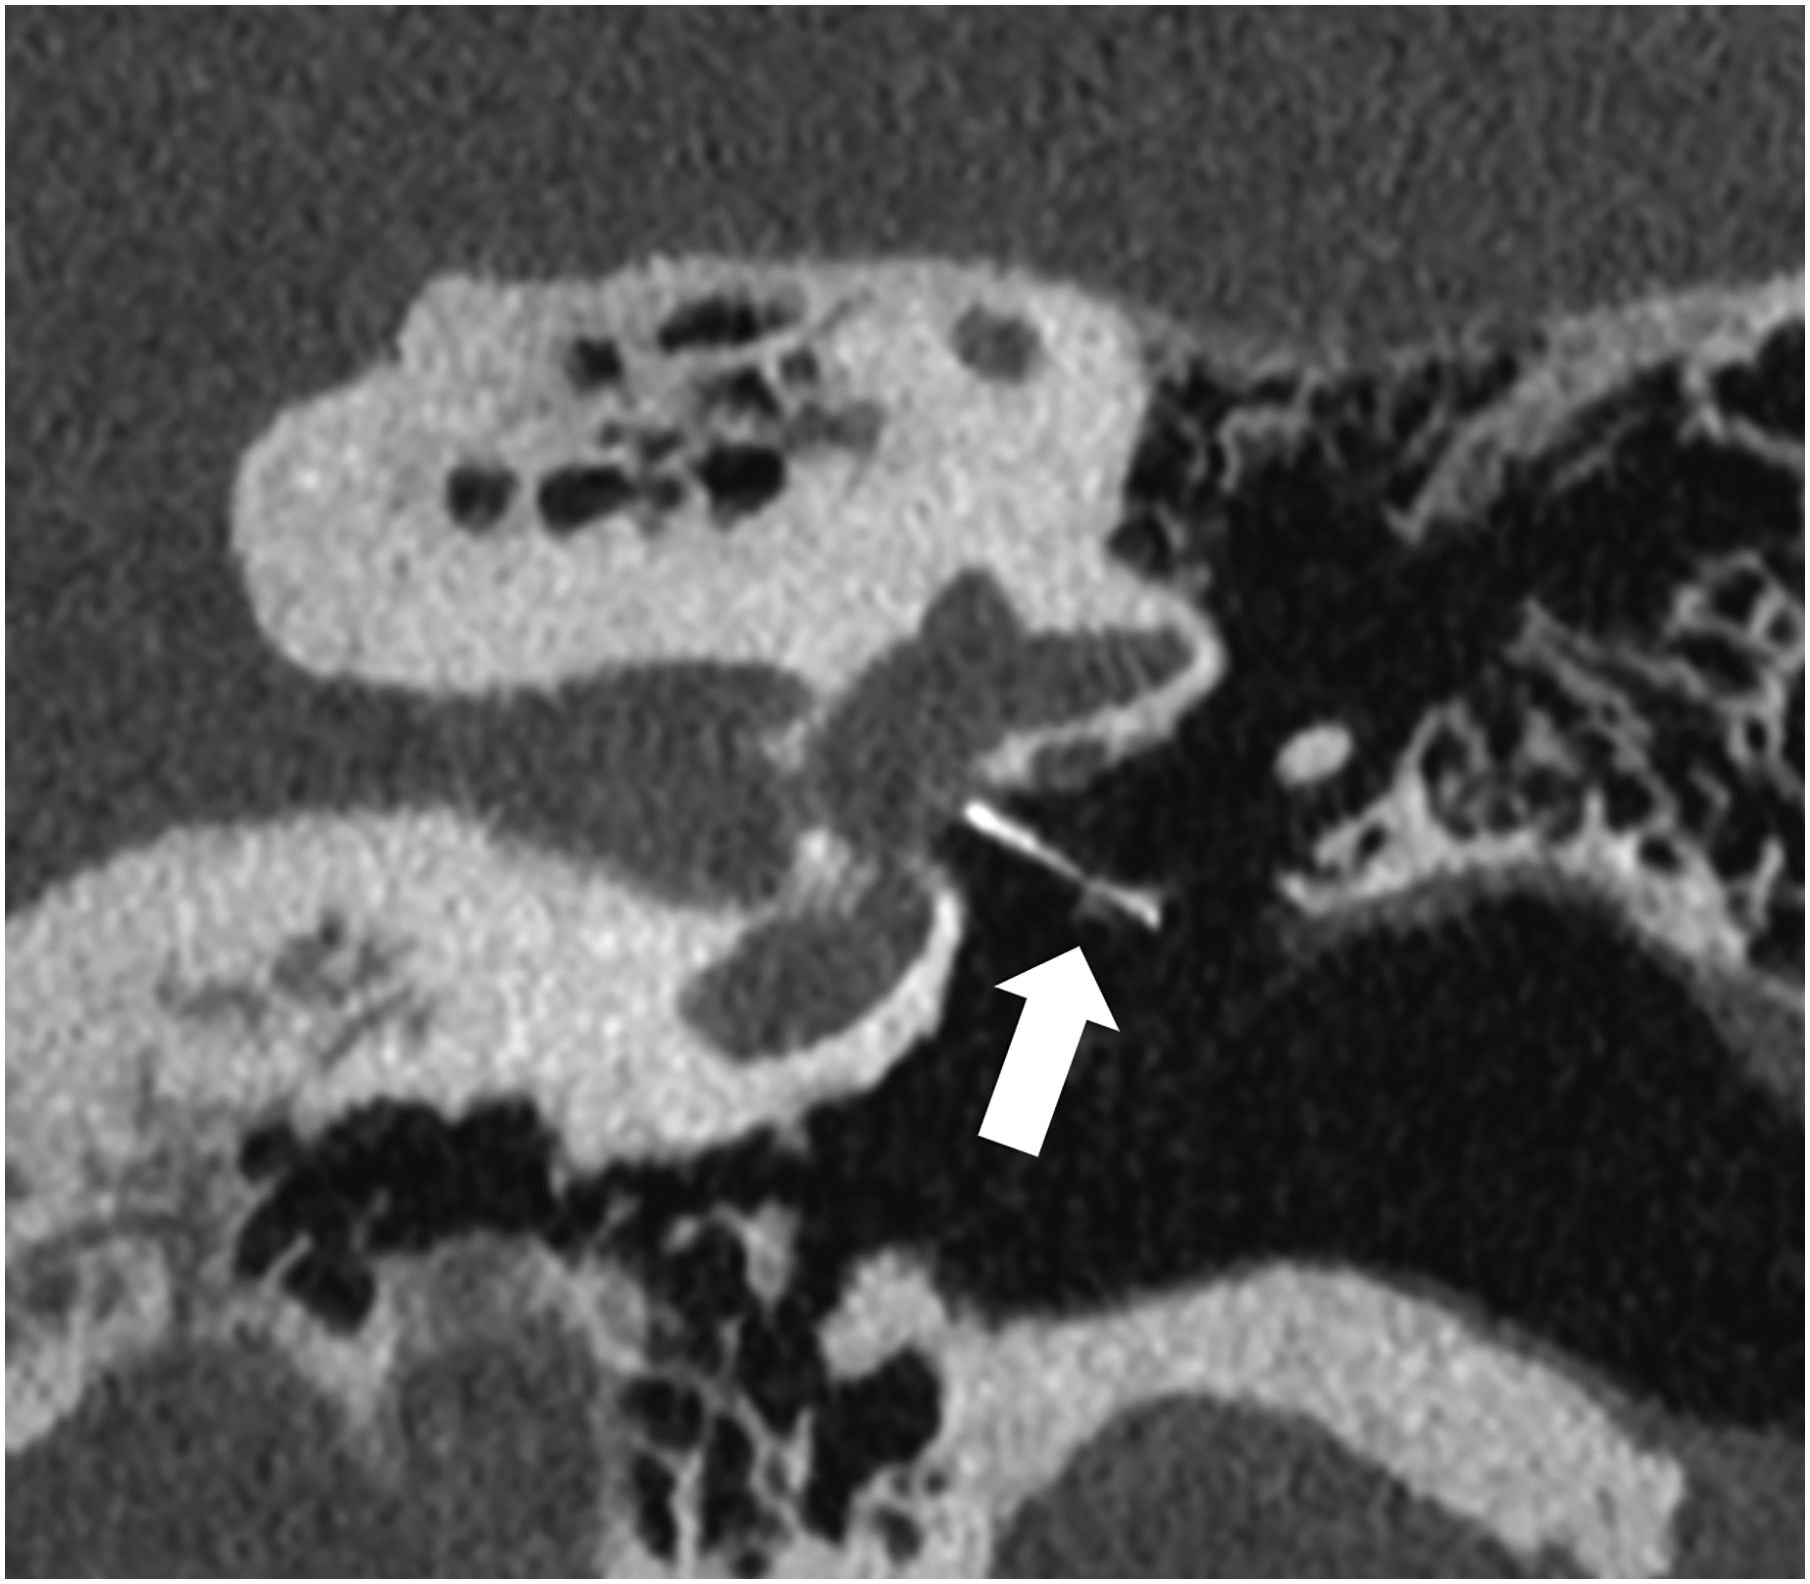
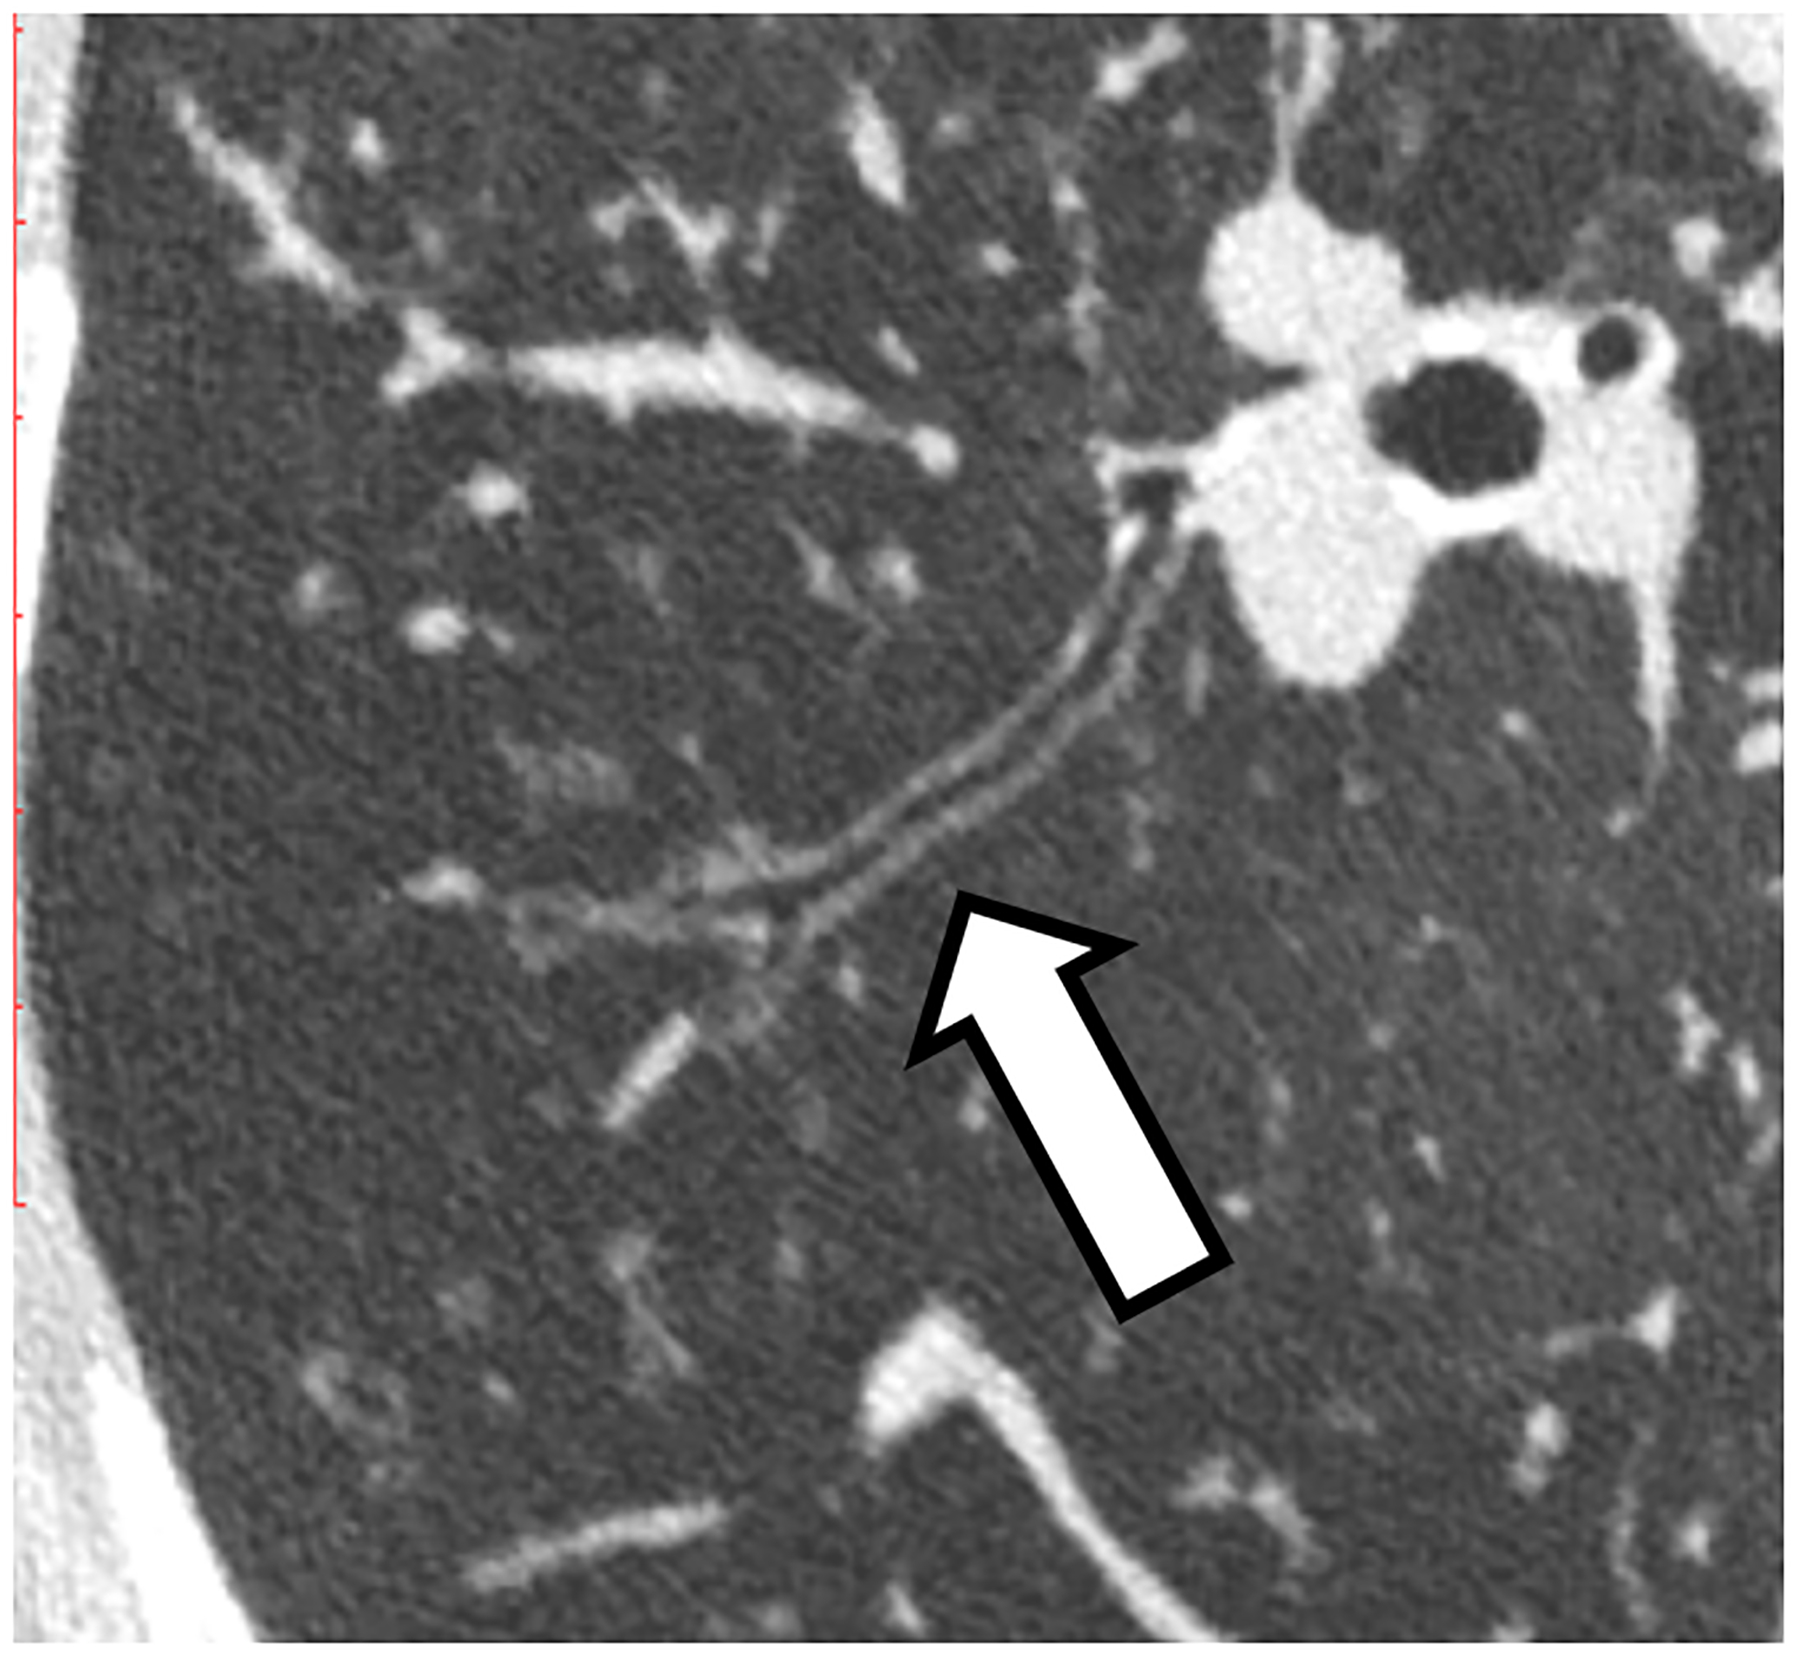
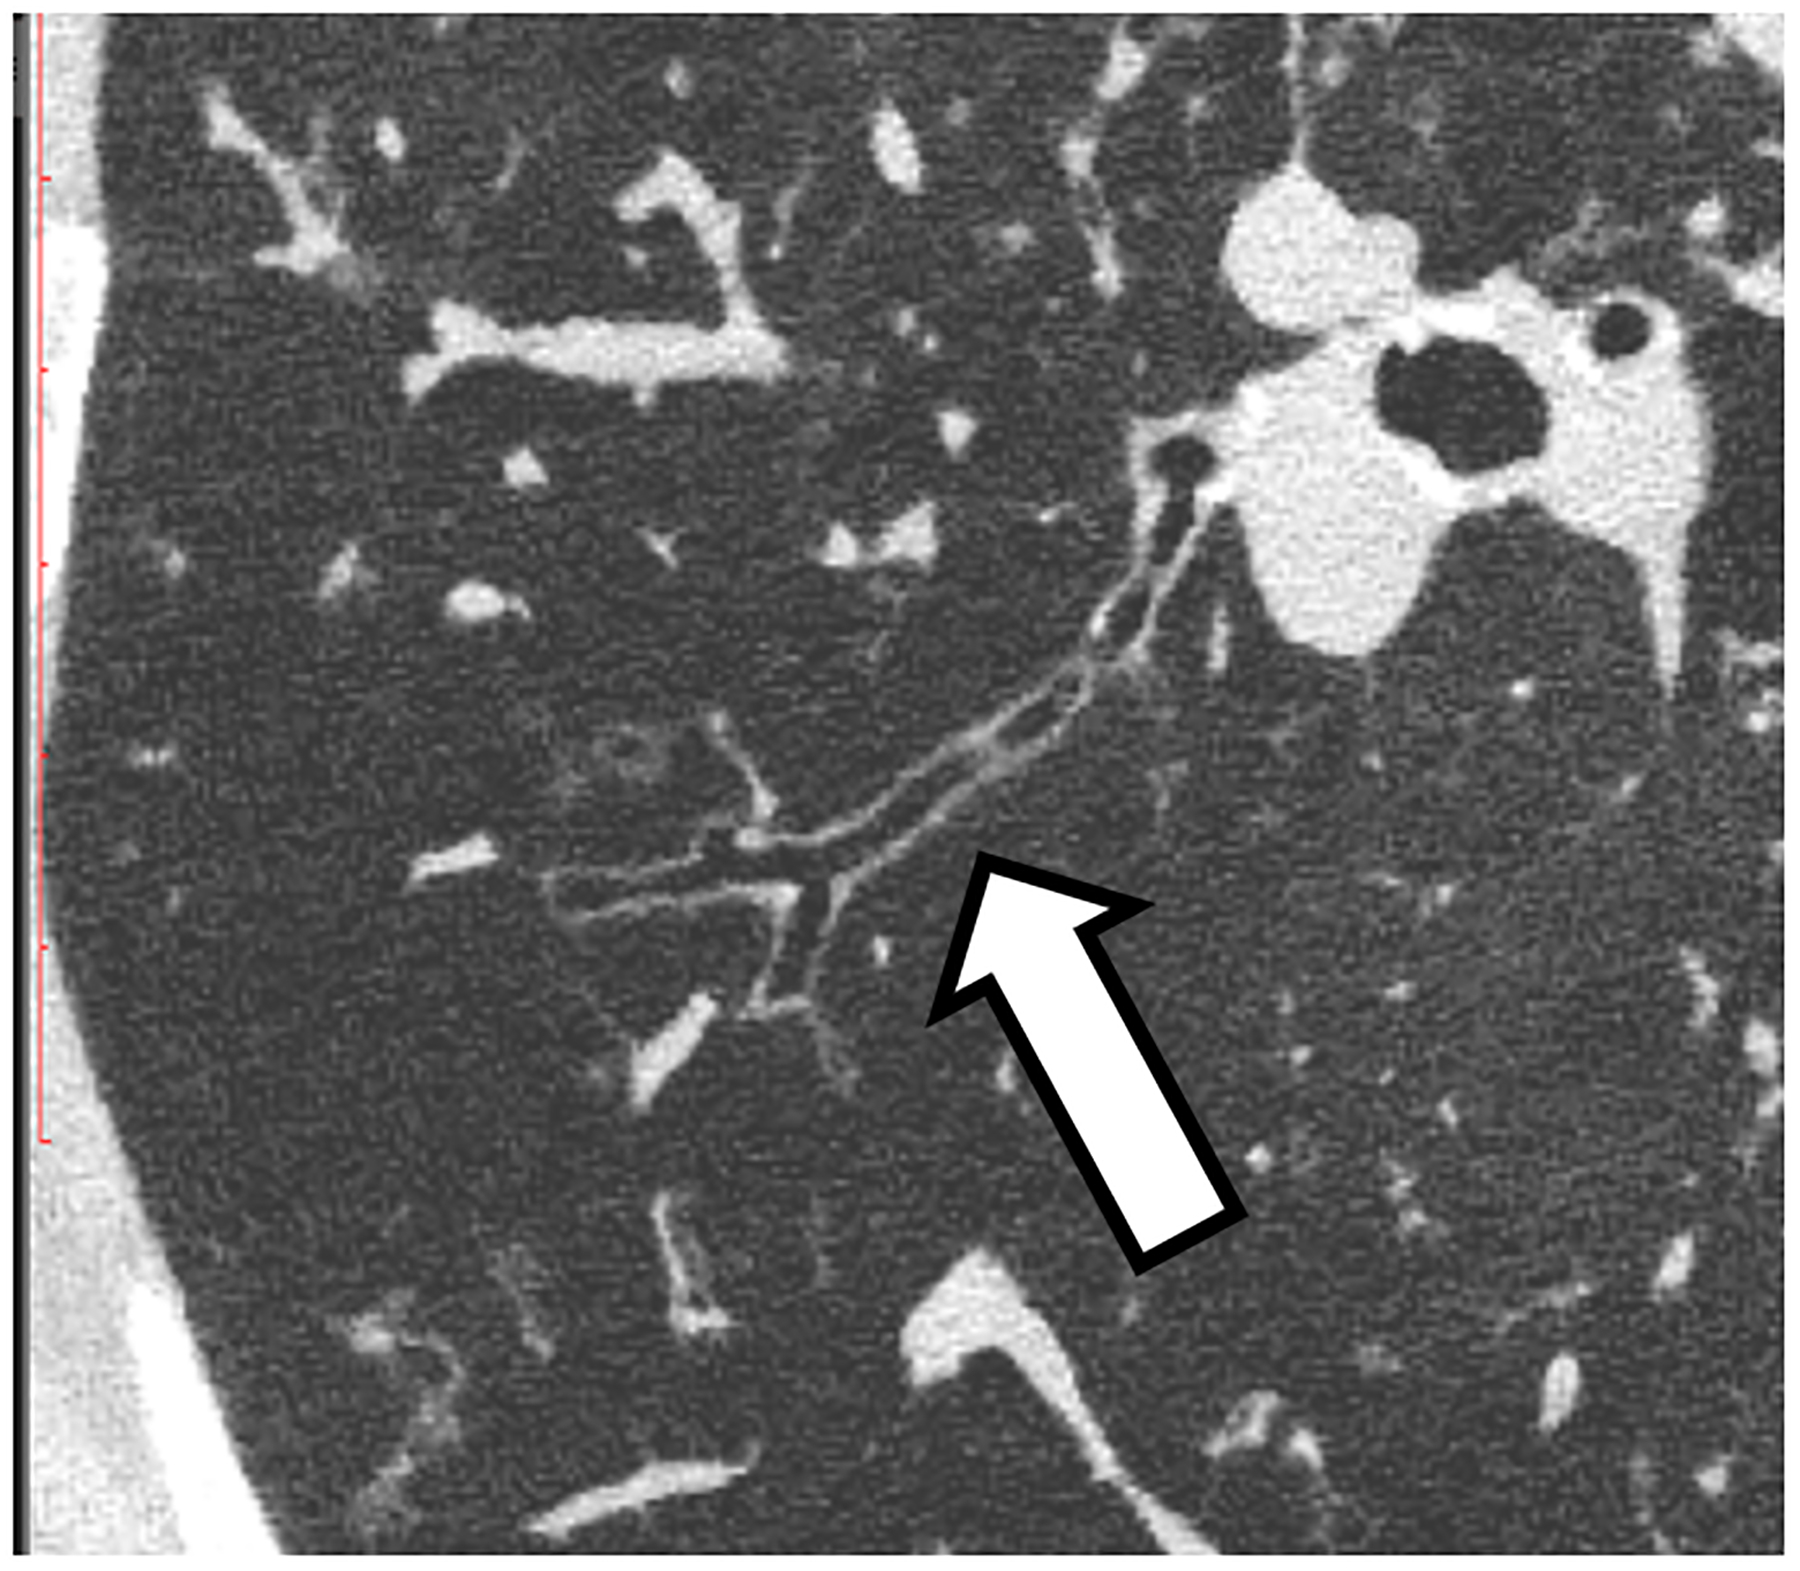
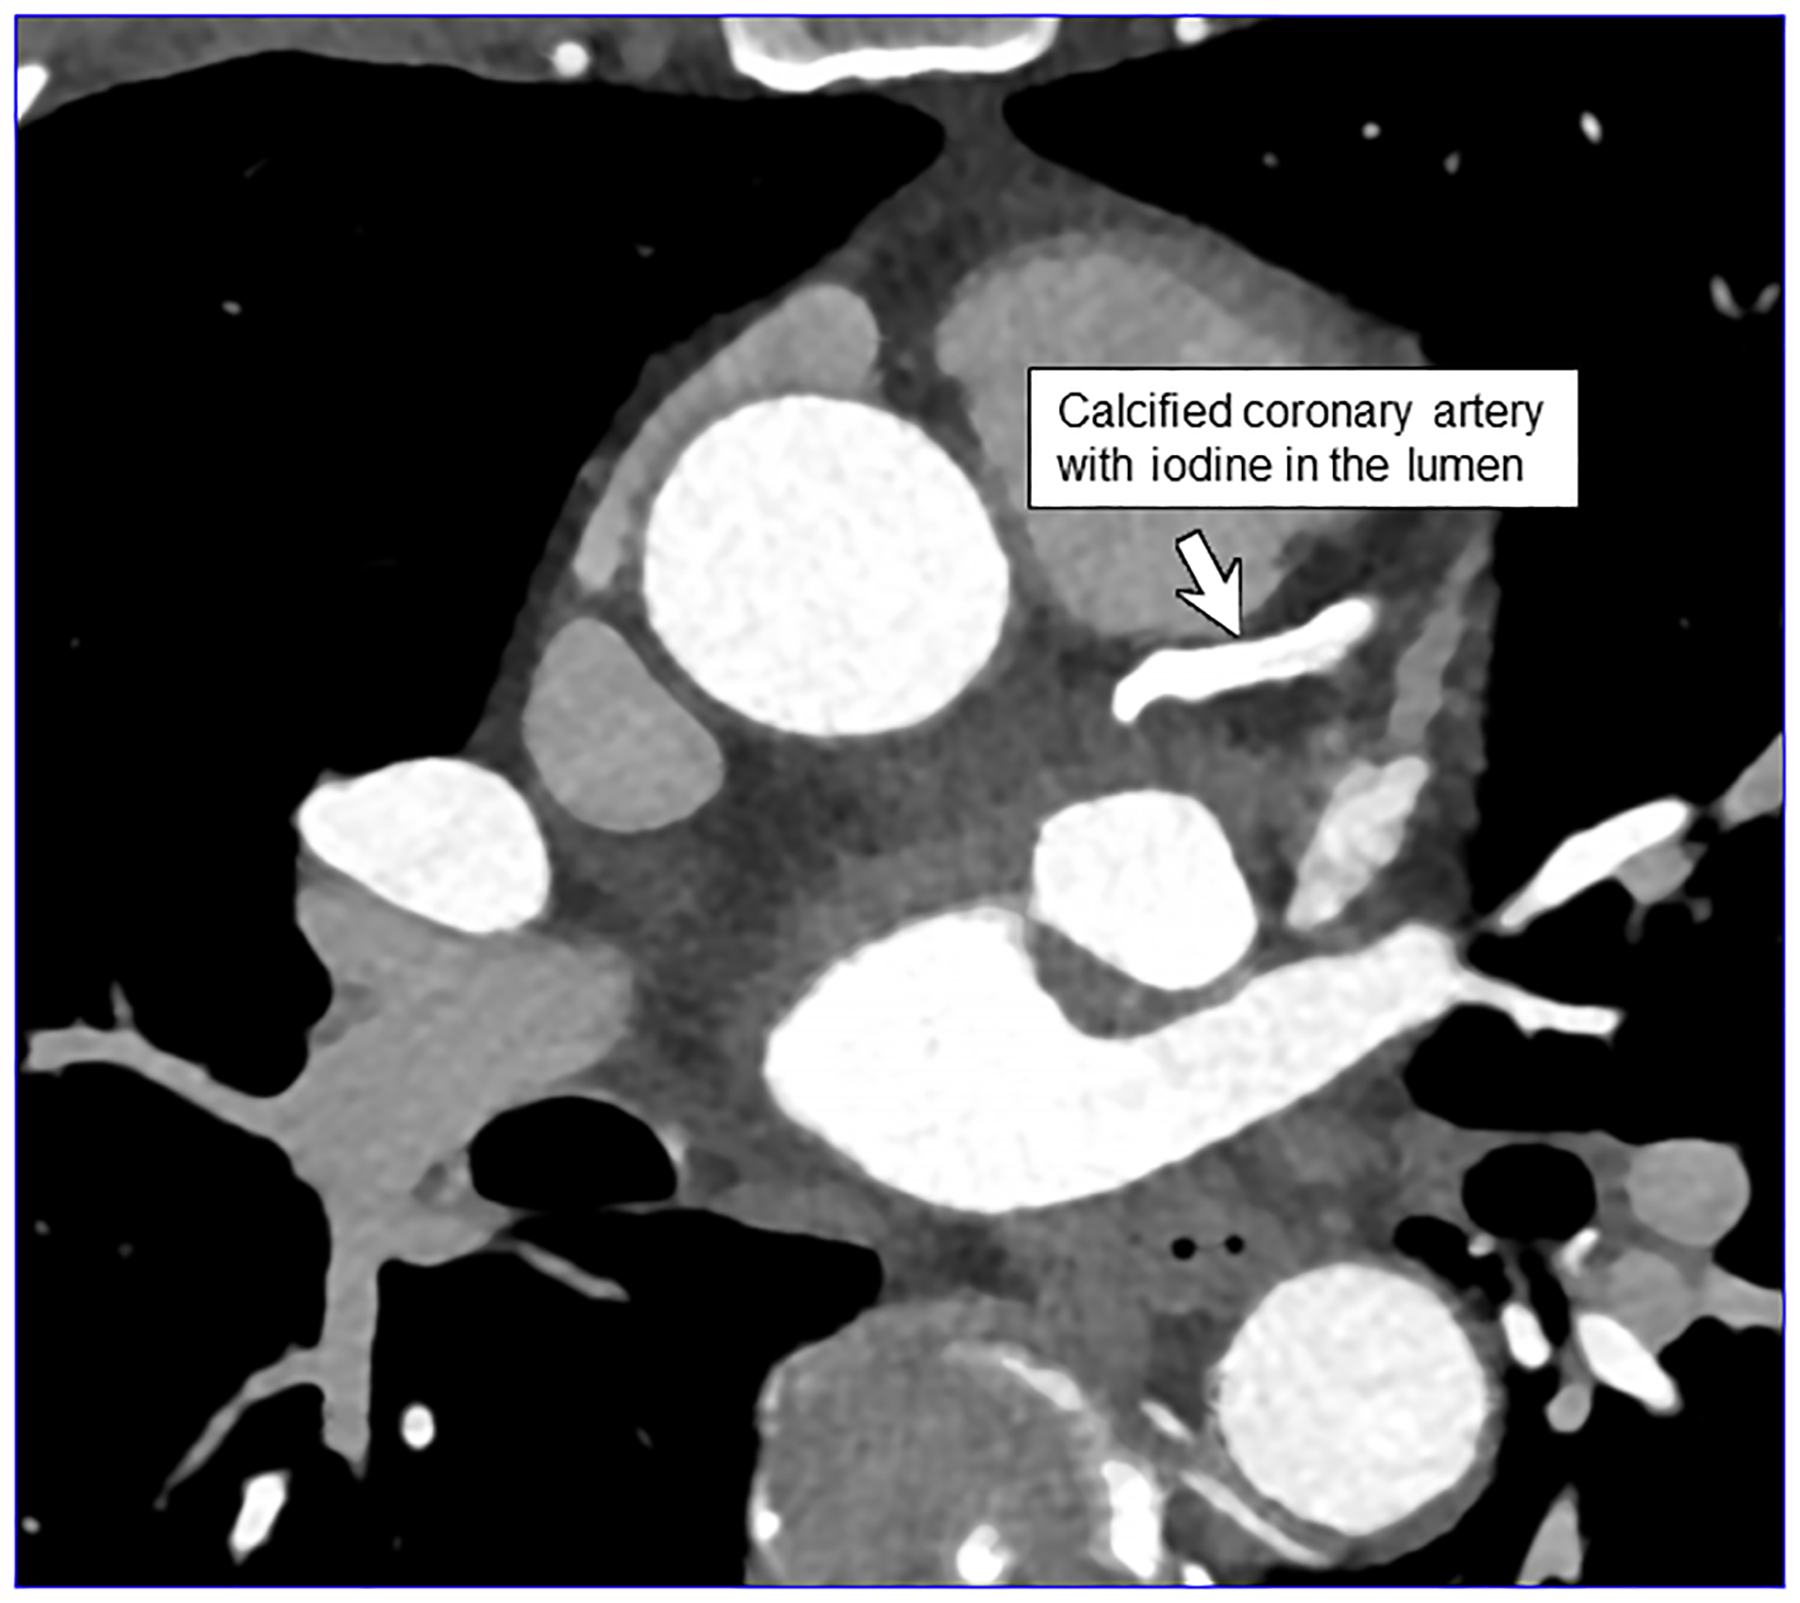
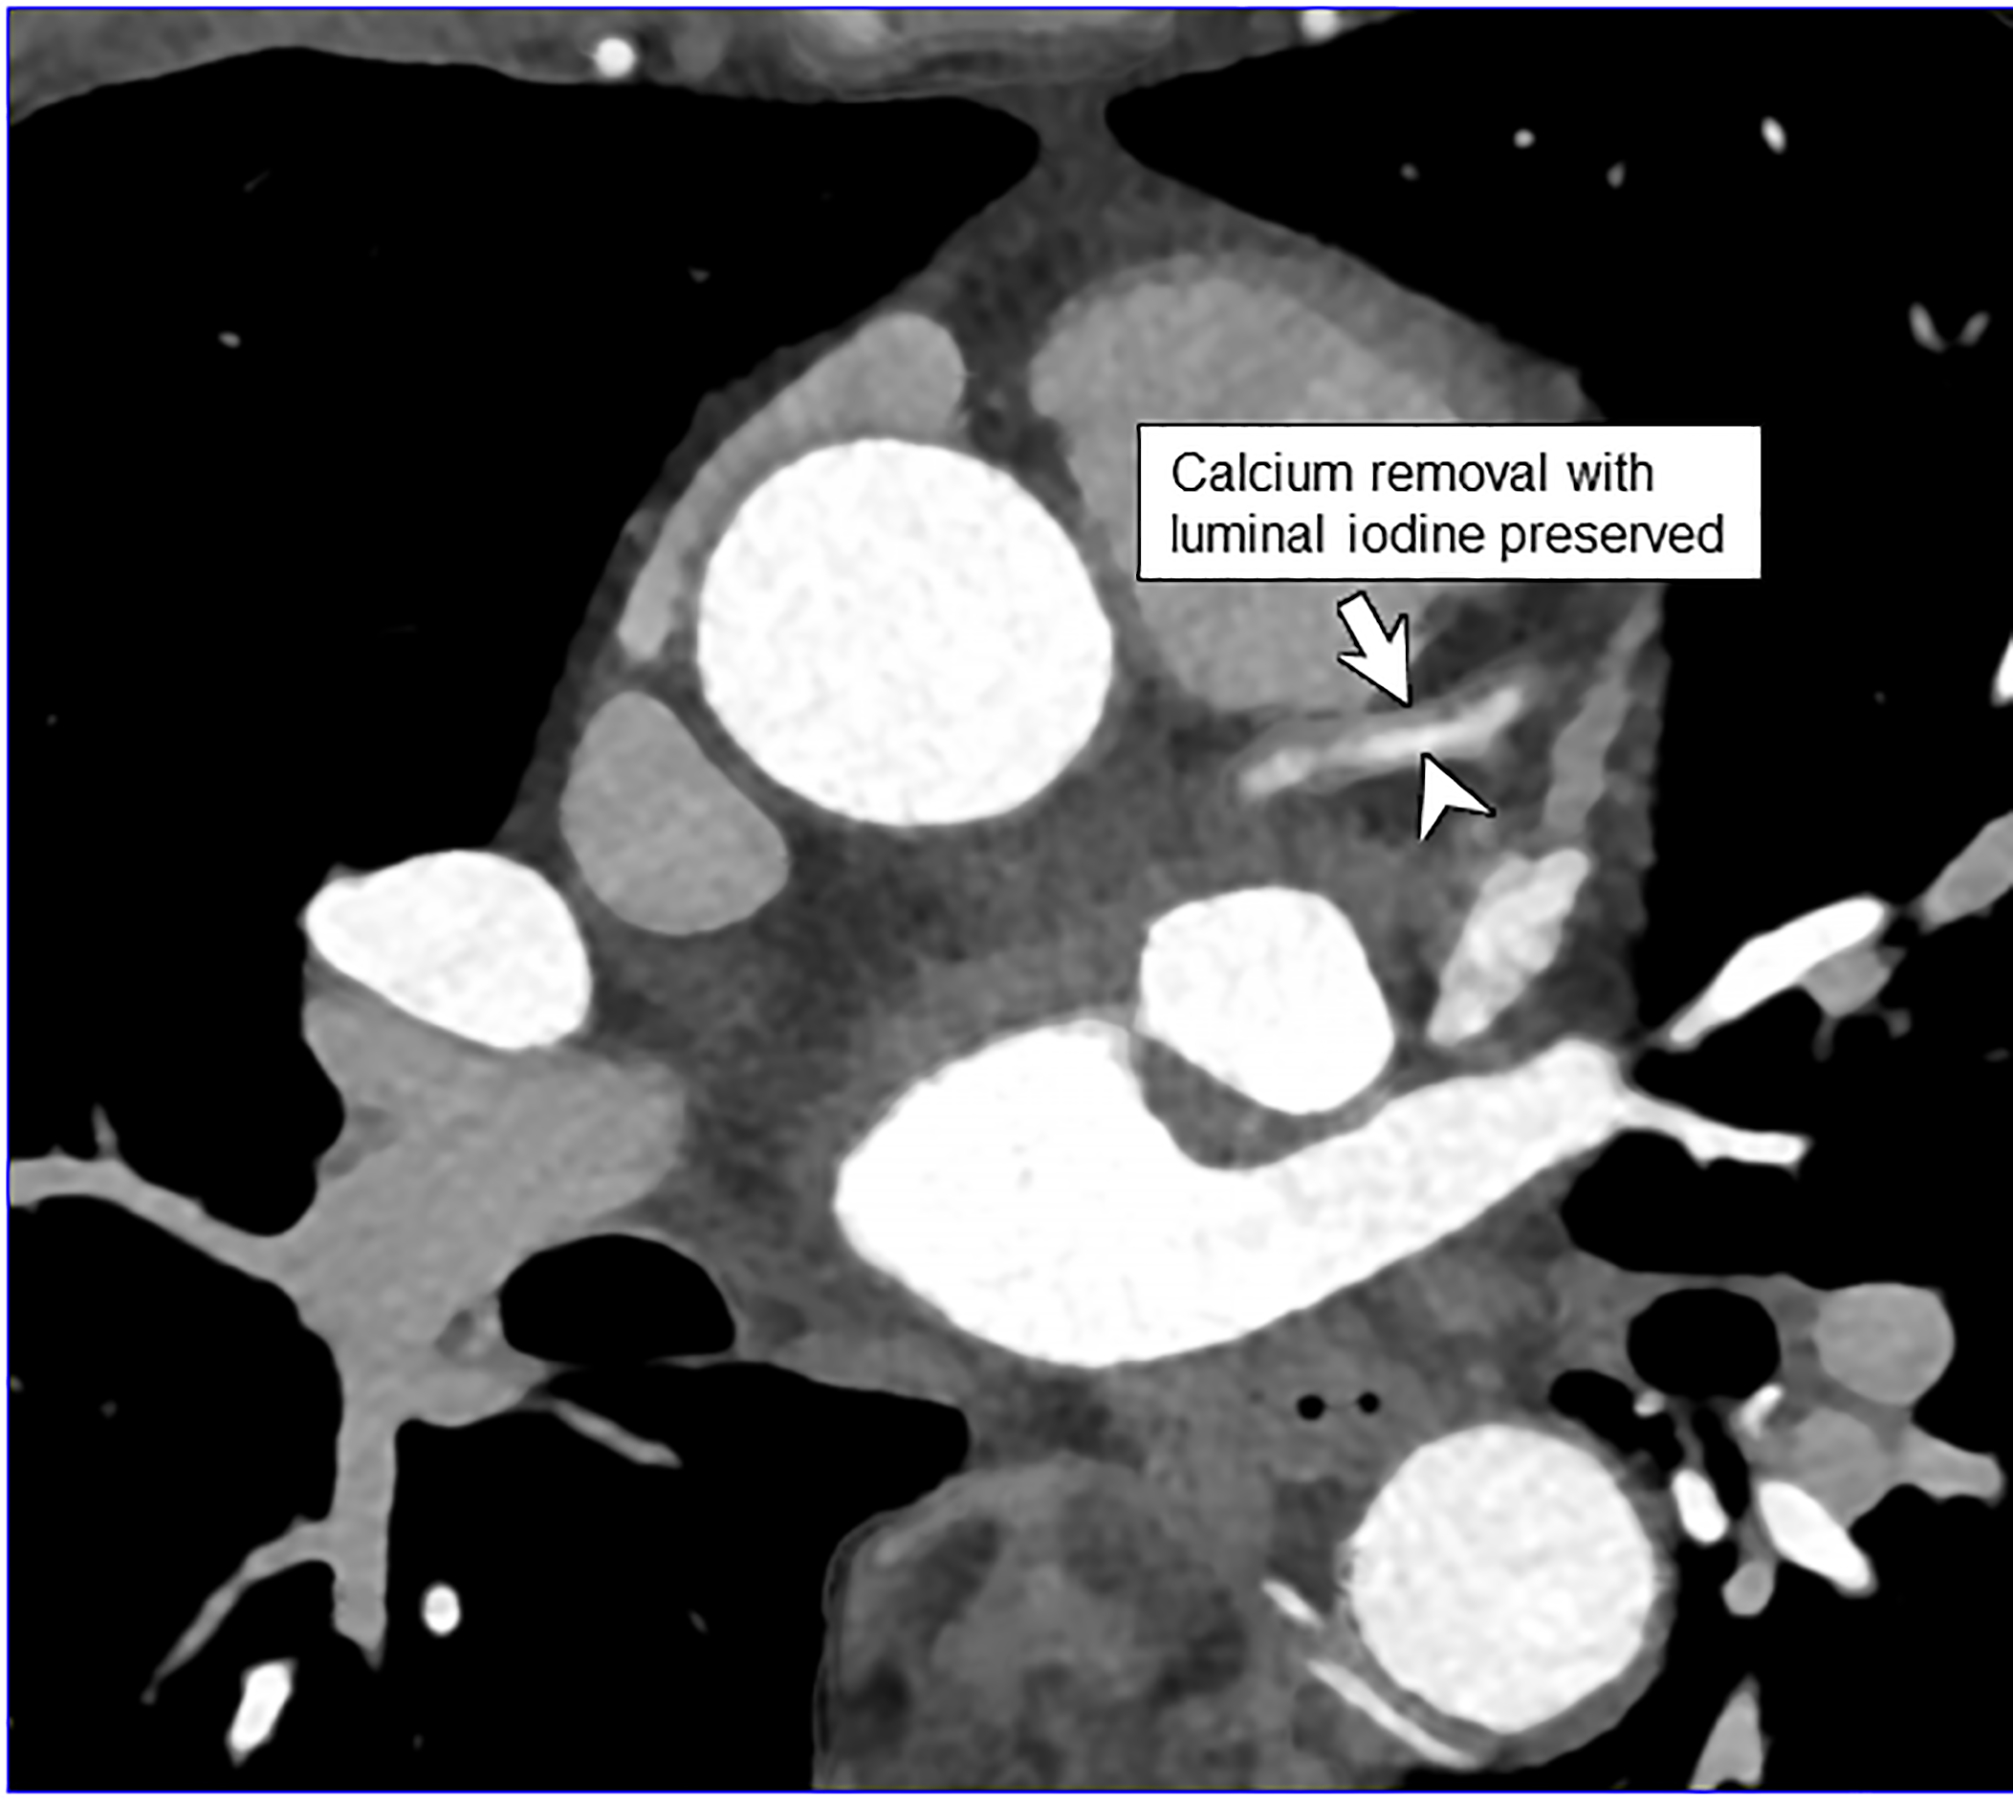
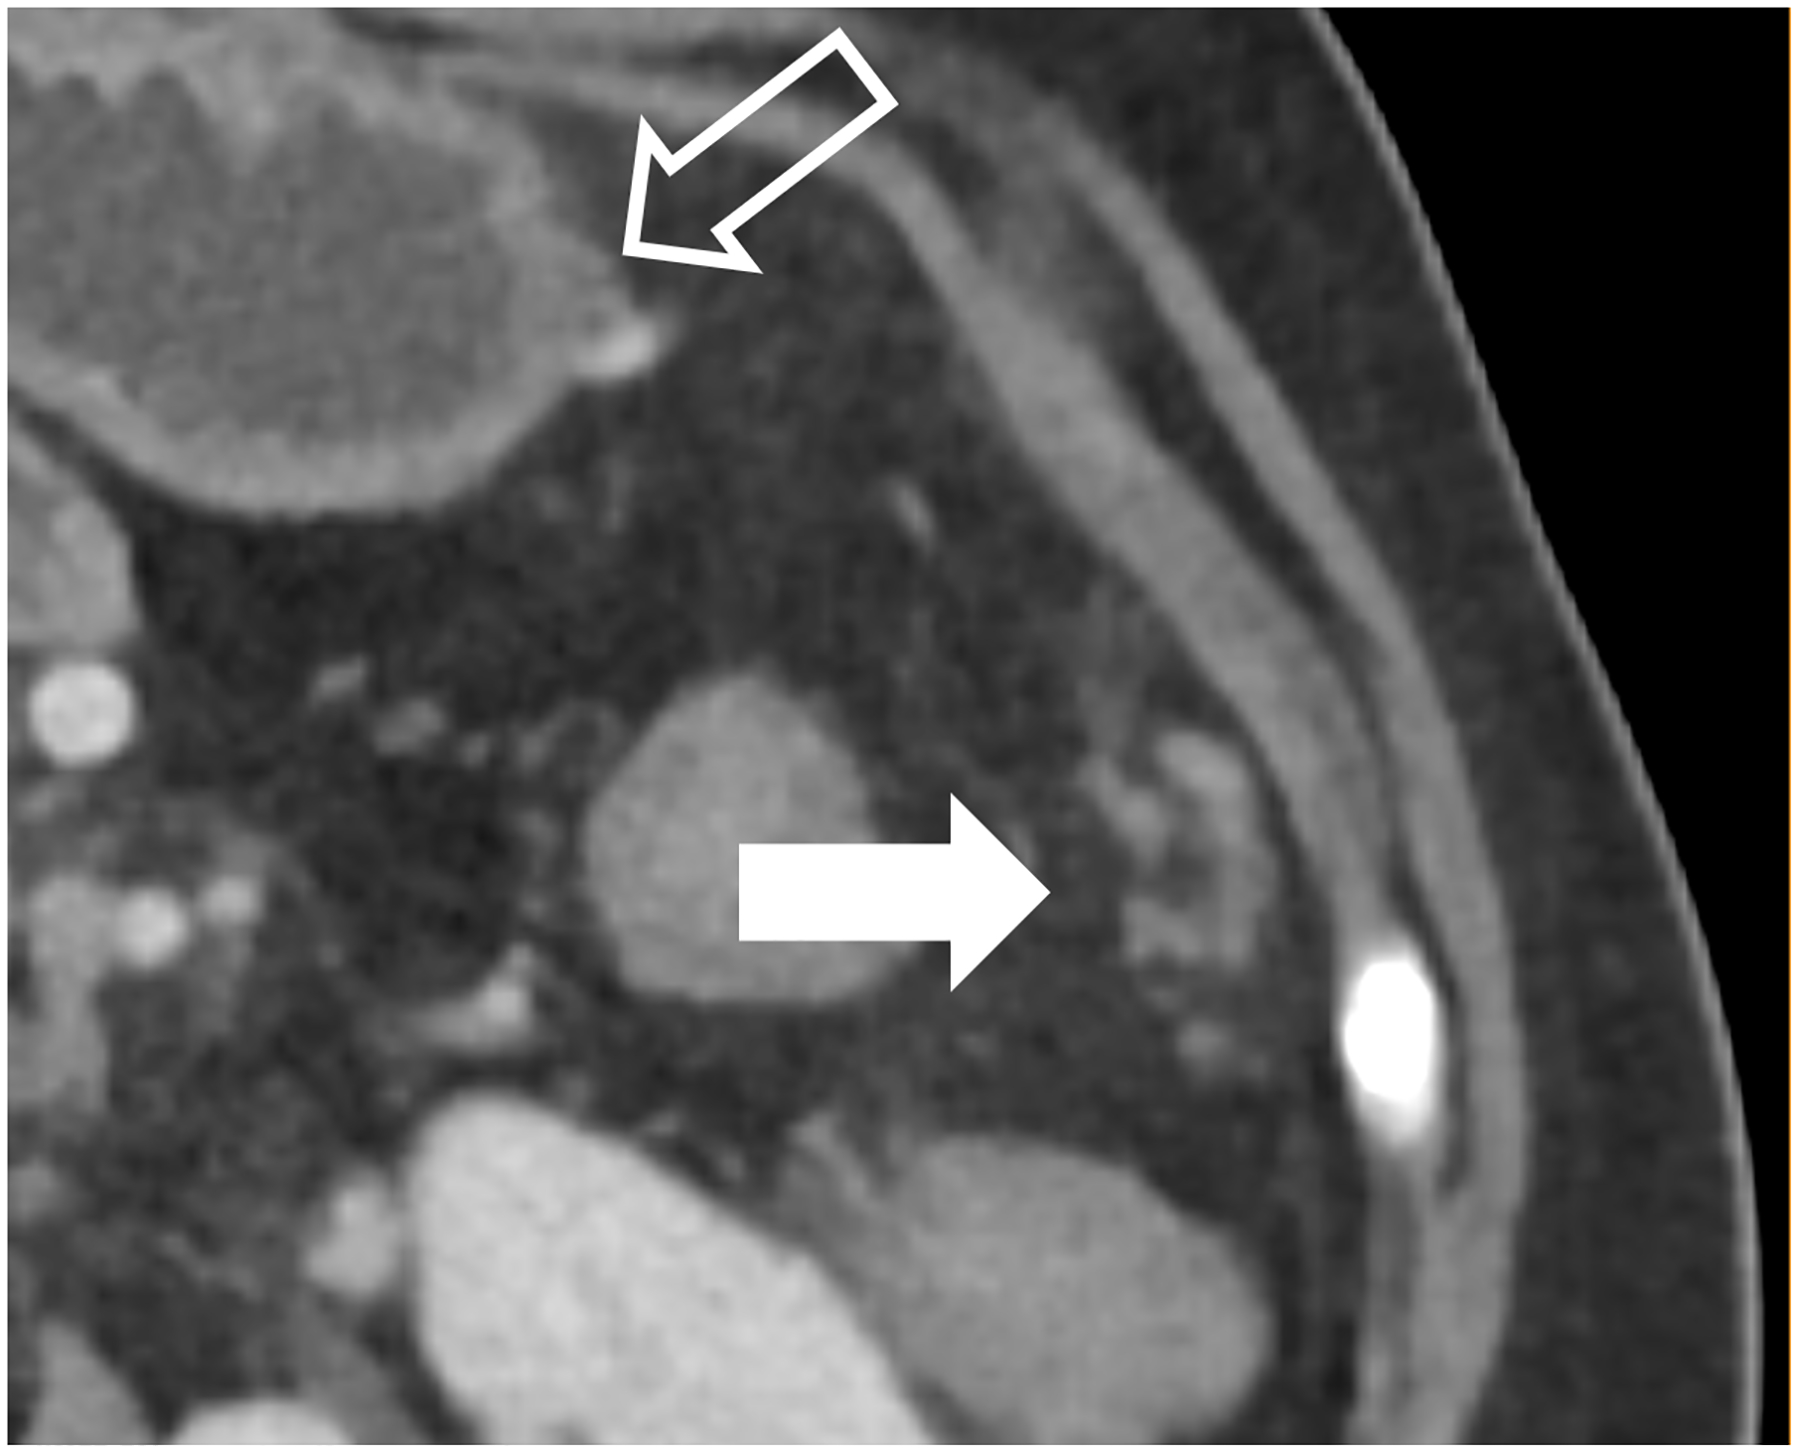
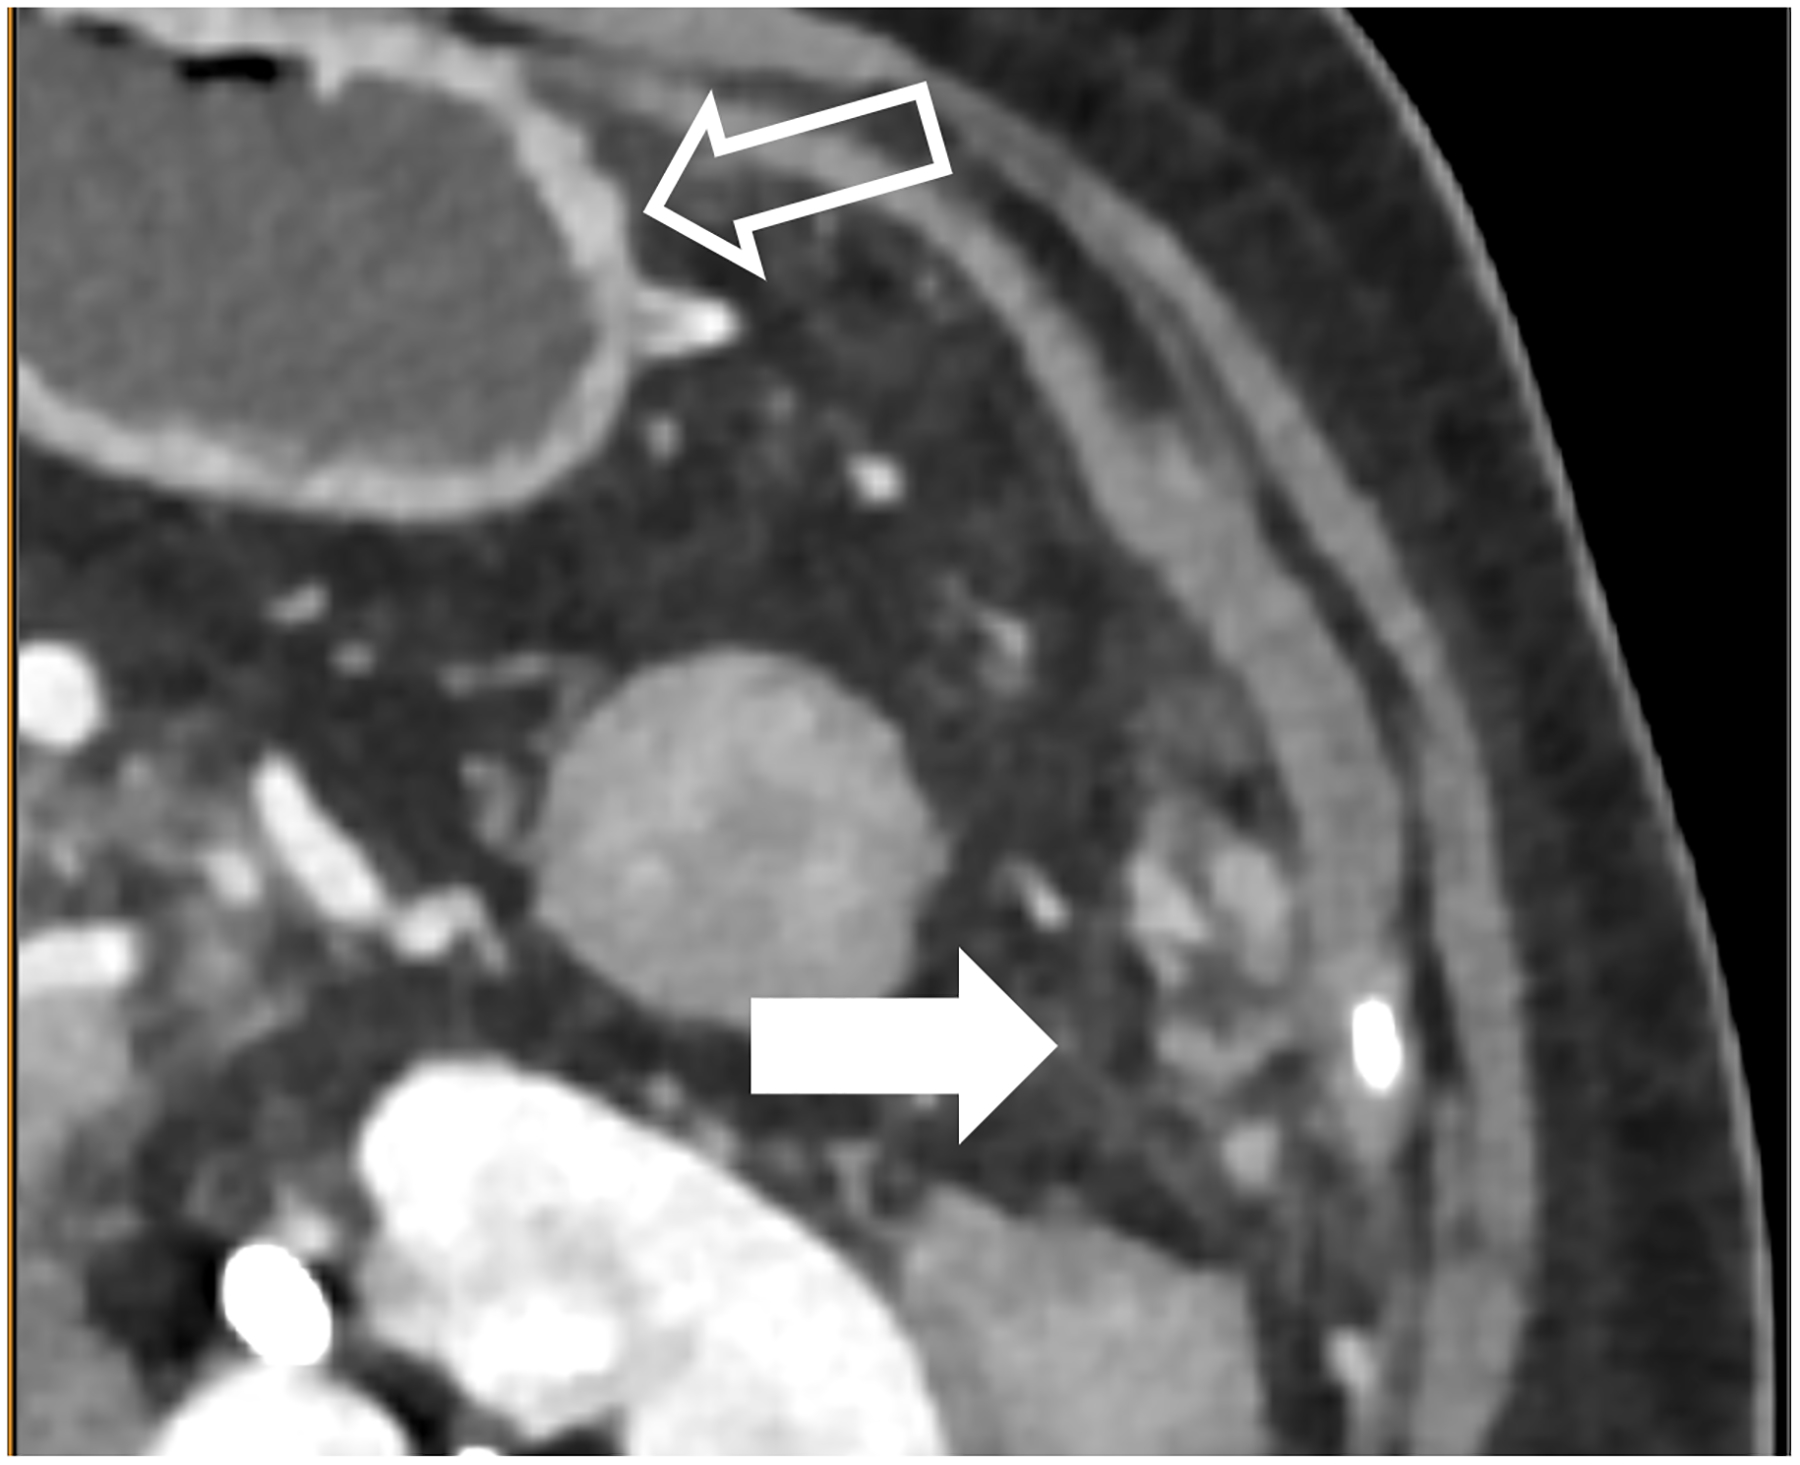
The X-ray detector is a fundamental component of a CT system that determines the image quality and dose efficiency. Until the approval of the first clinical photon-counting-detector (PCD) system in 2021, all clinical CT scanners used scintillating detectors, which do not capture information about individual photons in the two-step detection process. In contrast, PCDs use a one-step process whereby X-ray energy is converted directly into an electrical signal. This preserves information about individual photons such that the numbers of X-ray in different energy ranges can be counted. Primary advantages of PCDs include the absence of electronic noise, improved radiation dose efficiency, increased iodine signal and the ability to use lower doses of iodinated contrast material, and better spatial resolution. PCDs with more than one energy threshold can sort the detected photons into two or more energy bins, making energy-resolved information available for all acquisitions. This allows for material classification or quantitation tasks to be performed in conjunction with high spatial resolution, and in the case of dual-source CT, high pitch, or high temporal resolution acquisitions. Some of the most promising applications of PCD-CT involve imaging of anatomy where exquisite spatial resolution adds clinical value. These include imaging of the inner ear, bones, small blood vessels, heart, and lung. This review describes the clinical benefits observed to date and future directions for this technical advance in CT imaging. KEY POINTS: • Beneficial characteristics of photon-counting detectors include the absence of electronic noise, increased iodine signal-to-noise ratio, improved spatial resolution, and full-time multi-energy imaging. • Promising applications of PCD-CT involve imaging of anatomy where exquisite spatial resolution adds clinical value and applications requiring multi-energy data simultaneous with high spatial and/or temporal resolution. • Future applications of PCD-CT technology may include extremely high spatial resolution tasks, such as the detection of breast micro-calcifications, and quantitative imaging of native tissue types and novel contrast agents.

Keywords: Humans; Iodine; Photons; Radiation dosage; Tomography, X-ray computed.


Figures

Figure 1:
Figure 1:
Thin section axial and oblique sagittal head CTA images of a 61-year-old male, using EID with 0.6-mm slice thickness (A-B, top row) and PCD-CT (120 kV PCD image comprising 20–120 keV photons) with high resolution mode including 0.2-mm slice thickness (C-D, bottom row) techniques. An ~2-mm left supraclinoid ICA outpouching (infundibulum vs. aneurysm) is seen on EID (solid white arrow in A), but better delineated on PCD (solid white arrow in C). Specifically, the small vessel (anterior choroidal artery) arising from the apex of the outpouching is much better visualized on PCD (open arrows in C-D) than EID (open arrows in A-B), confirming an infundibulum rather than an aneurysm. In a 53-year-old male patient undergoing temporal bone imaging at EID-CT (E) and PCD-CT (120 kV PCD image comprising 20–120 keV photons, F), a stapes prosthesis (solid white arrow) is much better delineated on oblique coronal images using PCD with 0.2-mm slice thickness (F) than EID-CT with 0.4-mm slice thickness (E); the radiation dose was lower for PCD than EID (36 vs. 56 mGy, respectively). E and F reproduced with permission from [23]. [EID: energy integrating detector; PCD: photon-counting-detector]
Figure 1:
Figure 1:
Thin section axial and oblique sagittal head CTA images of a 61-year-old male, using EID with 0.6-mm slice thickness (A-B, top row) and PCD-CT (120 kV PCD image comprising 20–120 keV photons) with high resolution mode including 0.2-mm slice thickness (C-D, bottom row) techniques. An ~2-mm left supraclinoid ICA outpouching (infundibulum vs. aneurysm) is seen on EID (solid white arrow in A), but better delineated on PCD (solid white arrow in C). Specifically, the small vessel (anterior choroidal artery) arising from the apex of the outpouching is much better visualized on PCD (open arrows in C-D) than EID (open arrows in A-B), confirming an infundibulum rather than an aneurysm. In a 53-year-old male patient undergoing temporal bone imaging at EID-CT (E) and PCD-CT (120 kV PCD image comprising 20–120 keV photons, F), a stapes prosthesis (solid white arrow) is much better delineated on oblique coronal images using PCD with 0.2-mm slice thickness (F) than EID-CT with 0.4-mm slice thickness (E); the radiation dose was lower for PCD than EID (36 vs. 56 mGy, respectively). E and F reproduced with permission from [23]. [EID: energy integrating detector; PCD: photon-counting-detector]
Figure 2:
Figure 2:
Improved visualization of bronchial walls relative to EID-CT (A) are seen with PCD-CT (B) in these non-enhanced chest CT images of a 70-year-old female. In EID-CT (C) and PCD-CT (D) images from a contrast-enhanced chest CT of a 77-year-old male, the improved spatial resolution and iodine signal of PCD-CT allows the increased sharpness of the vascular tree to extend right to the periphery of the lung. PCD-CT images obtained at 120 kV and comprise 20–120 keV photons. A and B reproduced with permission from [8]. [EID: energy integrating detector; PCD: photon-counting-detector]
Figure 2:
Figure 2:
Improved visualization of bronchial walls relative to EID-CT (A) are seen with PCD-CT (B) in these non-enhanced chest CT images of a 70-year-old female. In EID-CT (C) and PCD-CT (D) images from a contrast-enhanced chest CT of a 77-year-old male, the improved spatial resolution and iodine signal of PCD-CT allows the increased sharpness of the vascular tree to extend right to the periphery of the lung. PCD-CT images obtained at 120 kV and comprise 20–120 keV photons. A and B reproduced with permission from [8]. [EID: energy integrating detector; PCD: photon-counting-detector]
Figure 3:
Figure 3:
EID-CT (A) and PCD-CT (120 kV PCD image comprising 20–120 keV photons, B) images from a run-off exam in a 75-year-old male demonstrate increased clarity of the lumen adjacent to the better delineated calcified plaque. PCD-CT coronary artery images in a 71-year-old male without (C) and with multi-energy post-processing (D) using an algorithm that performs material decomposition and removes calcium signal. The post-processed image (D) shows the patent lumen adjacent to the heavily calcified plaque (arrowhead). [EID: energy integrating detector; PCD: photon-counting-detector]
Figure 3:
Figure 3:
EID-CT (A) and PCD-CT (120 kV PCD image comprising 20–120 keV photons, B) images from a run-off exam in a 75-year-old male demonstrate increased clarity of the lumen adjacent to the better delineated calcified plaque. PCD-CT coronary artery images in a 71-year-old male without (C) and with multi-energy post-processing (D) using an algorithm that performs material decomposition and removes calcium signal. The post-processed image (D) shows the patent lumen adjacent to the heavily calcified plaque (arrowhead). [EID: energy integrating detector; PCD: photon-counting-detector]
Figure 4:
Figure 4:
Improved visualization for abdominal diagnostic tasks resulting from improved spatial resolution and/or iodine contrast. EID-CT with intravenous contrast shows a 52-year-old female with peritoneal disease from colon cancer (A, white arrow). Note visualization of the gastric wall (A, open arrow). PCD-CT shows improved iodine signal in the gastric wall and peritoneal deposits (B, open and white arrow, respectively), with iodine signal further enhanced using 50 keV virtual monoenergetic images (C). Bottom row shows impact of improved spatial resolution, with depiction of more renal stones in a 72-year-old man despite similar 2-mm slice thickness (D, EID-CT; E, PCD-CT), and improved enhancement and visualization of jejunal folds in a 70-year-old female (F, EID-CT; G, PCD-CT). PCD-CT images B, E, and G were acquired at 120 kV and comprise 20–120 keV photons. [EID: energy integrating detector; PCD: photon-counting-detector]
Figure 4:
Figure 4:
Improved visualization for abdominal diagnostic tasks resulting from improved spatial resolution and/or iodine contrast. EID-CT with intravenous contrast shows a 52-year-old female with peritoneal disease from colon cancer (A, white arrow). Note visualization of the gastric wall (A, open arrow). PCD-CT shows improved iodine signal in the gastric wall and peritoneal deposits (B, open and white arrow, respectively), with iodine signal further enhanced using 50 keV virtual monoenergetic images (C). Bottom row shows impact of improved spatial resolution, with depiction of more renal stones in a 72-year-old man despite similar 2-mm slice thickness (D, EID-CT; E, PCD-CT), and improved enhancement and visualization of jejunal folds in a 70-year-old female (F, EID-CT; G, PCD-CT). PCD-CT images B, E, and G were acquired at 120 kV and comprise 20–120 keV photons. [EID: energy integrating detector; PCD: photon-counting-detector]
Figure 5:
Figure 5:
Improved visualization of trabecular visualization relative to EID-CT (A) is shown on PCD-CT (140 kV PCD image comprising 20–140 keV photons, B) in images of an 18-year-old female with a cortical fracture of the anterior tibia. A multi-energy virtual non-calcium PCD-CT image (C) of the same patient was formed to look for bone marrow edema. EID-CT (D) image of the femoral head and acetabulum show decreased sharpness and trabecular structure to the PCD-CT (140 kV PCD image comprising 20–140 keV photons, E) image in a 41-year-old female. [EID: energy integrating detector; PCD: photon-counting-detector]
Figure 5:
Figure 5:
Improved visualization of trabecular visualization relative to EID-CT (A) is shown on PCD-CT (140 kV PCD image comprising 20–140 keV photons, B) in images of an 18-year-old female with a cortical fracture of the anterior tibia. A multi-energy virtual non-calcium PCD-CT image (C) of the same patient was formed to look for bone marrow edema. EID-CT (D) image of the femoral head and acetabulum show decreased sharpness and trabecular structure to the PCD-CT (140 kV PCD image comprising 20–140 keV photons, E) image in a 41-year-old female. [EID: energy integrating detector; PCD: photon-counting-detector]
Figure 6:
Figure 6:
Maximum intensity projection (20 mm) of ultra-high-resolution PCD-CT (120 kV PCD image comprising 20–120 keV photons) processed using CNN (A) and a clinically indicated mammographic image (B) on a 66-year-old year female. A total of five microcalcifications were detected in the PCD-CT exam following CNN noise reduction. The mammographic reference exam confirmed the presence of these microcalcifications. [PCD: photon-counting-detector, CNN: convolutional neural network]
Figure 6:
Figure 6:
Maximum intensity projection (20 mm) of ultra-high-resolution PCD-CT (120 kV PCD image comprising 20–120 keV photons) processed using CNN (A) and a clinically indicated mammographic image (B) on a 66-year-old year female. A total of five microcalcifications were detected in the PCD-CT exam following CNN noise reduction. The mammographic reference exam confirmed the presence of these microcalcifications. [PCD: photon-counting-detector, CNN: convolutional neural network]

References

    1. McCollough C, Rajendran K, Leng S et al. (2022) The technical development of photon counting detector CT. Euro Radiol In Press - PMC - PubMed
    1. Benjaminov O, Perlow E, Romman Z et al. (2008) Novel, Energy-Discriminating Photon Counting CT System (EDCT): First Clinical Evaluation—CT Angiography: Carotid Artery StenosisRadiological Society of North America 2008 Scientific Assembly and Annual Meeting, Chicago, Il.
    1. Leng S, Rajendran K, Gong H et al. (2018) 150-μm Spatial Resolution Using Photon-Counting Detector Computed Tomography Technology: Technical Performance and First Patient Images. Invest Radiol 53:655–662 - PMC - PubMed
    1. Pourmorteza A, Symons R, Sandfort V et al. (2016) Abdominal Imaging with Contrast-enhanced Photon-counting CT: First Human Experience. Radiology 279:239–245 - PMC - PubMed
    1. Yu Z, Leng S, Jorgensen SM et al. (2016) Evaluation of conventional imaging performance in a research whole-body CT system with a photon-counting detector array. Phys Med Biol 61:1572–1595 - PMC - PubMed

LinkOut - more resources