Review
. 2023 May;18(5):1379-1415.
doi: 10.1038/s41596-023-00809-8. Epub 2023 Apr 5.

Z-REX: shepherding reactive electrophiles to specific proteins expressed tissue specifically or ubiquitously, and recording the resultant functional electrophile-induced redox responses in larval fish

Affiliations
Review

Z-REX: shepherding reactive electrophiles to specific proteins expressed tissue specifically or ubiquitously, and recording the resultant functional electrophile-induced redox responses in larval fish

Kuan-Ting Huang et al. Nat Protoc. 2023 May.

Erratum in

Abstract

This Protocol Extension describes the adaptation of an existing Protocol detailing the use of targetable reactive electrophiles and oxidants, an on-demand redox targeting toolset in cultured cells. The adaptation described here is for use of reactive electrophiles and oxidants technologies in live zebrafish embryos (Z-REX). Zebrafish embryos expressing a Halo-tagged protein of interest (POI)-either ubiquitously or tissue specifically-are treated with a HaloTag-specific small-molecule probe housing a photocaged reactive electrophile (either natural electrophiles or synthetic electrophilic drug-like fragments). The reactive electrophile is then photouncaged at a user-defined time, enabling proximity-assisted electrophile-modification of the POI. Functional and phenotypic ramifications of POI-specific modification can then be monitored, by coupling to standard downstream assays, such as click chemistry-based POI-labeling and target-occupancy quantification; immunofluorescence or live imaging; RNA-sequencing and real-time quantitative polymerase chain reaction analyses of downstream-transcript modulations. Transient expression of requisite Halo-POI in zebrafish embryos is achieved by messenger RNA injection. Procedures associated with generation of transgenic zebrafish expressing a tissue-specific Halo-POI are also described. The Z-REX experiments can be completed in <1 week using standard techniques. To successfully execute Z-REX, researchers should have basic skills in fish husbandry, imaging and pathway analysis. Experience with protein or proteome manipulation is useful. This Protocol Extension is aimed at helping chemical biologists study precision redox events in a model organism and fish biologists perform redox chemical biology.


Figures

Extended Data Fig. 1 |
Extended Data Fig. 1 |. mRNA injection of Halo-POI constructs gives uniform expression of POI in fish.
Keap1 is used as a representative POI. (a) IF analysis of zebrafish embryos (34 hpf). Top row: non-injected embryos not stained with primary antibody; bottom row: Halo-P2A-Keap1 injected embryos (note that there are two sets of each fish in this row, corresponding to fish either stained (top set) or not stained (bottom set) with anti-Keap1 primary antibody). (b) IF analysis of zebrafish embryos (34 hpf) injected with Halo-P2A -Keap (top), or non-injected control embryos (bottom). Both groups were stained with anti-HA primary antibody as described (note that all embryos in both groups were treated with the same primary and secondary antibody mix). (c) Same as (b) but no injection was compared to Halo-Keap1 injection. (d) Quantitation of data in (b) and (c). Halo-P2A-Keap1: n=6, SEM=5.012; Halo-Keap1: n=5, SEM=2.926. Scale bar, 500 μm in all images.
Extended Data Fig. 2 |
Extended Data Fig. 2 |. Downstream pathway activation analyzed by transgenic reporter fish and qRT-PCR analysis.
In this example, responsivity differences were characterized for Keap1–Nrf2–AR25 pathway using Tg(gstp1:GFP) fish and an endogenous downstream gene Gstp1 driven by Nrf2/AR. (a) Unlike in the fin, (see also Fig. 4), Z-REX-assisted Keap1-HNEylation or whole-animal treatment with Tecfidera (25 μM, 4 h treatment) do not cause elevation of AR in the head when measured using Tg(gstp1:GFP). (34 hpf) Halo-Keap1 mRNA-injected (from left to right): n=43, SEM=0.0455; n=29, SEM=0.0416; n=49, SEM=0.0378; n=65, SEM=0.0313; n=24, SEM=0.0767. Halo-P2A-Keap1 mRNA-injected (from left to right): n=55, SEM=0.0510; n=48, SEM=0.0553; n=54, SEM=0.0497; n=49, SEM=0.0622; n=10, SEM=0.0480. (b) qRT-PCR analysis is able to detect a small increase in AR in the head upon Z-REX-assisted Keap1-HNEylation, that is selective to the Halo-Keap1 construct over the Halo-P2A-Keap1 construct. This is significantly less than what is observed in the tail (see Fig. 4d). Fish age: 32 hpf. Fish age: 32 hpf. Halo-Keap1 mRNA-injected (from left to right): n=8, SEM=0.0590; n=8, SEM=0.0418; n=8, SEM=0.0756; n=8, SEM=0.0948. Halo-P2A-Keap1 mRNA-injected (from left to right): n=6, SEM=0.0609; n=6, SEM=0.0586; n=6, SEM=0.0349; n=6, SEM=0.0493. P values were calculated with two-tailed unpaired Student’s t test.
Extended Data Fig. 3 |
Extended Data Fig. 3 |. Validation of the same outcome between whole-mount immunofluorescence and live imaging.
(a) Live Tg(gstp1:GFP) embryos (34 hpf) were dechorionated and placed on an agarose pad and imaged using GFP fluorescence (Ex. 495 nm, Em. 500–500 nm) and bright field. (b) Top row: Tg(gstp1:GFP) (34 hpf) were exposed to Z-REX conditions using Keap1-HNEylation as a representative example, and at 4-h post light exposure, dechorionated, fixed and immunostained for GFP as described. AlexaFluor568 channel shows GFP signal. GFP localization is similar for GFP intrinsic fluorescence (in (a)) and red fluorescence from IF (this figure). Bottom row: identical series of steps carried out as in top row except WT fish was used in place of Tg(gstp1:GFP) reporter fish. Scale bar, 500 μm in all images.
Extended Data Fig. 4 |
Extended Data Fig. 4 |. Z-REX selectively upregulates the AR in fish cardiomyocytes, but not other tissues.
(a) Representative images of Tg(myl7:DsRed-P2A-Halo-TEV-Keap1–2xHA,cry:mRFP1,gstp1:GFP) fish (34 hpf) treated with DMSO, light, 0.3 μM Ht-PreHNE, or Z-REX (with 0.3 μM Ht-PreHNE). Scale bar, 500 μm in all images. See Fig. 5a for magnified images. (b) Quantification of mean GFP intensity. The quantification strategy is described in the discussion. Briefly, the head, tail (median fin fold) and whole fish are defined based on bright-field images. Image-J (NIH) quantification shows AR levels in the head, tail or whole fish were not changed (against all the control conditions) upon cardiomyocyte-specific Z-REX treatment (Fig. 5b). Fish age: 34 hpf. Sample size is the same for three plots (from left to right): n=32, n=36, n=35, n=45. SEM: head (from left to right): 0.0804, 0.0505, 0.0660, 0.0737; tail (from left to right): 0.0616, 0.0913, 0.0989, 0.0900; whole fish (from left to right): 0.0536, 0.0438, 0.0412, 0.0589. P values were calculated with two-tailed unpaired Student’s t test.
Extended Data Fig. 5 |
Extended Data Fig. 5 |. Z-REX-mediated AR stimulation is Nrf2a-dependent.
(a) Representative IF-images of Tg(gstp1:GFP) fish (34 hpf) injected with 2 nl of 500 ng/μL Halo-(TEV)-Keap1–2xHA mRNA and 0.5 mM morpholino (control MO or Nrf2a MO), and treated with DMSO, light, 1 μM Ht-PreHNE, or Z-REX (with 1 μM Ht-PreHNE). Scale bar, 500 μm in all images. (b) Quantification of mean GFP intensity. The quantification strategy is described in the discussion. Briefly, the head and tail (median fin fold) are defined based on bright-field images. After Z-REX-treatment, control morpholino-injected fish show two-fold higher AR signal than other negative control groups (DMSO, light or Ht-PreHNE alone), whereas the Nrf2a MO-injected fish show only 1.3-fold higher AR signal, compared to corresponding negative control groups. The results demonstrate that Nrf2a is a necessary mediator in Z-REX-stimulated AR pathway. Fish age: 34 hpf. Sample size is the same for two plots (from left to right): n=27, n=23, n=24, n=18, n=17, n=23, n=22, n=27. SEM: tail (from left to right): 0.0749, 0.1438, 0.0941, 0.2122, 0.1021, 0.1074, 0.0791, 0.1394; head (from left to right): 0.0675, 0.0779, 0.0783, 0.0971, 0.0826, 0.0797, 0.0667, 0.0548. P values were calculated with two-tailed unpaired Student’s t test.
Extended Data Fig. 6 |
Extended Data Fig. 6 |. A rapid method to generate HaloTagged-POI constructs in pCS2+8.
(a) Halo-Keap1 (or any desired HaloTagged POI) is amplified from the parent (pFN21a, if using Kazusa library (Promega)) using the primers stated in Table 2 (PCR1). Two subsequent PCRs, PCR2 and 3, generate megaprimer that contains the complete desired gene, tags, Kozak sequence, and flanking regions (blue) that anneal to the pCS2+8 plasmid downstream of the SP6 promoter and upstream of the SV40 poly-A tail. This megaprimer is used to prime a PCR reaction (PCRClone) with the linearized pCS2+8 and the crude mixture (with or without Dpn1 digestion) is directly transformed into E coli. (b). Halo and the POI (in this case Keap1) are amplified (PCR1a and 1b) separately by PCR from the original plasmid and extended (PCR2a and 2b). Primers are designed such that the 3´-end of the Halo amplicon (X) can overlap with the 5’-end of the Keap1 amplicon (Y). These two ends encode the linker region between Halo and Keap1 in the final construct. X and Y are used in a self-priming reaction to make the fused DNA (self prime PCR), that is then amplified by PCR using primers that will introduce 5´- and 3´ ends that anneal to pCS2+8 in the same position as in (a) (PCR3). This megaprimer is then used as in (a) (PCRClone).
Extended Data Fig. 7 |
Extended Data Fig. 7 |. Microinjection of zebrafish embryos.
(a) Calibration of injection using a hemocytometer. A cut needle was loaded with mRNA and the needle was cleared and wetted in 10% HBSS. Several injections were made into the oil overlaying the hemocytometer. The drop marked with an arrow is approximately 2 nl based on the grid of the hemocytometer. (b) Embryos at the two-cell stage are aligned in an injection pad. These embryos are acceptable for mRNA injection but not for plasmid injection (for single cells, see (f)). (c) Schematic illustration showing a side-view of optimal set up of the embryos, microscope, and injection needle for creating zebrafish embryos expressing Halo-POI. Also see Extended Data Fig. 8. (d) Single-cell embryos aligned in an injection plate. These are ideal for plasmid and mRNA co-injection. The needle is above the embryos with the tip of the needle in HBSS (aiming at the yolk sac for mRNA injection). Embryos can be injected from left to right or vice versa by moving the plate to position subsequent embryos to align with the needle. (e, f) Injection into (e) the yolk sac of a single-celled embryo (mRNA injection) or (f) a single-cell embryo (mRNA and plasmid co-injection).
Extended Data Fig. 8 |
Extended Data Fig. 8 |. Set up of microscope for microinjection.
One optimal setup for zebrafish embryo injection. Note: Whole area has been sprayed with RNaseZAP and wiped with a similarly wetted kimwipe or paper towel. (a) Front view, (b) top view, and (c) side view looking at injection plate and needle. Needle should be kept in HBSS once it is loaded with mRNA, to avoid clogging, and cleared at least once prior to injection.
Extended Data Fig. 9 |
Extended Data Fig. 9 |. Transgenic fish line, Tg(myl7:DsRed-P2A-Halo-TEV-Keap1–2xHA,cry:mRFP1), expressing Halo-TEV-Keap1 in cardiomyocytes.
(a) Scheme of the inserted myl7:DsRed-P2A-Halo-TEV-Keap1–2xHA-polyA sequence. P2A-Halo-TEV-Keap1–2xHA-polyA sequence was validated by six Sanger sequencing analyses: seq. 1 covers 785–1538; seq. 2 covers 1085–1811; seq. 3 covers 1560–2668; seq. 4 covers 2576–3597; seq. 5 covers 2760–3800; seq. 6 covers 3777–4525. Codon number in the scheme: P2A: 928–1011; Halo: 1012–1899; TEV protease recognition site: 1900–1932; Keap1: 1933–3801; 2 x HA tag: 3802–3855; left stop codon: 3856–3858; left SV40 polyA signal sequence: 3907–4113. Also see Table 3 for sequencing primers. (b) The myl7:DsRed expression in fish cardiomyocytes was visible in both live fish (55 hpf) and formaldehyde-fixed fish (see also Fig. 5, and Extended Data Fig. 4). The cry:mRFP1 expression in fish eye lens was only seen in live fish, but not in formaldehyde-fixed fish. Scale bar, 500 μm in all images.
Fig. 1 |
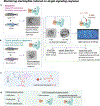
Fig. 1 |. Workflow for Z-REX.
a–c, Zebrafish embryos are injected either at the one to four cell stage for injection of mRNA encoding a Halo-tagged POI, or at the one cell stage for co-injecting reporter plasmid and mRNA encoding a Halo-tagged POI (a). Alternatively, embryos expressing desired Halo-POI fusion protein either ubiquitously or in certain tissues, can be obtained by crossing appropriate transgenic fish lines (b). Embryos are then treated with the HaloTag-targetable small-molecule ligand (gray), the photocaged precursor (pink) to LDE (red) (c, Ht-PreLDE). After 24 h, embryos are washed three times, then exposed to a hand-held lamp (365 nm, 3 mW/cm2) for 2–5 min, which enables rapid liberation (t1/2 < 1 min) of a designated LDE (c, LDE). Should the POI be a kinetically privileged electrophile sensor, the liberated LDE rapidly reacts with the POI, before LDE diffusion. The extent of LDE occupancy on target POI, downstream signaling and indicated functional changes triggered as a result of LDE modification of a specific POI, can then be assessed. d, Relevant sets of Z-REX technical and functional and biological controls should be implemented to help rule out potential artificial outcomes, by assessing effects (if any) due to light alone, probe alone or DMSO alone (left), or by replicating Z-REX conditions using the split construct or electrophile-sensing-defective POI (right). These controls should not give the behavioral or signaling changes observed under Z-REX conditions.
Fig. 2 |
Fig. 2 |. Validation of POI expression and POI-selective targeting in zebrafish larvae.
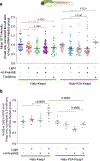
The established electrophile-sensor POI, Keap1 and the pathway it regulates, Keap1–Nrf2–AR, was used as a representative example. a, Schematic of the light-driven precision targeting of native LDEs such as HNE to ectopic Halo-Keap1 elicits upregulation of AR element (ARE)-driven genes. b, Schematic of Tg(gstp1:GFP) reporter fish available from NBRP (see ‘Discussion’). c, Tg(gstp1:GFP) were injected with mRNA coding for either only Halo or Halo-Keap1. After 34 hpf, AR was assessed by IF imaging for GFP. Halo: n = 22, SEM 0.0788; Halo-Keap1: n = 38, SEM 0.0567. d, Representative images from c. Age: 34 hpf. Scale bar, 500 μm in all images. e, Tg(gstp1:GFP) were injected with mRNA coding for Halo-Keap1. At 30 hpf, embryos were treated with DMSO, HNE (25 μM) or Tecfidera (25 μM) for 4 h. Then the extent of AR upregulation specifically in the tail was assessed by IF imaging for GFP (age: 34 hpf). Nontreated: n = 50, SEM 0.0582; HNE-treated: n = 15, SEM 0.1325; Tecfidera-treated: n = 25, SEM 0.1442. Inset: chemical structure of HNE (a well-studied natural bioactive reactive LDE) and Tecfidera (an approved multiple sclerosis drug). P values were calculated with two-tailed unpaired Student’s t-test.
Fig. 3 |
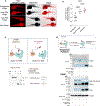
Fig. 3 |. Halo-P2A-POI serves as an ideal negative biological control in Z-REX that proceeds via a quasi-intramolecular mode of POI-specific electrophile modification in vivo.
In this example, the established electrophile-sensor Keap1 was used as a representative POI. a, Expression of POI (Keap1 as an example in this case) in non-injected fish and fish injected with the indicated mRNA, was analyzed by IF, by probing with anti-Keap1 antibody (this antibody can detect human Keap1 and both isoforms of zebrafish Keap1) (age: 34 hpf). For negative control (fish not treated with primary antibody), see Extended Data Fig. 1a. Scale bar, 500 μm in all images. b, Quantitation of Keap1 signals (background subtraction by sample treated with secondary antibody only, but not primary antibody) in the indicated sets. Age: 34 hpf. Non injected: n = 10, SEM 0.1031; Halo-P2A-Keap1 mRNA-injected: n = 8, SEM 0.0712; Halo-Keap1 mRNA-injected: n = 6, SEM 0.0856. P values were calculated with two-tailed unpaired Student’s t-test. c, Top: illustration of the two protein constructs used in this protocol. The Z-REX POI-electrophile modification only happens when the POI is fused to Halo (Halo-TEV-POI), but not when Halo and POI are split (Halo-P2A-POI) (also see Fig. 1, bottom, Z-REX biological or functional control). Bottom schematic gel or blot: through Cy5 click assay (fluorescence gel), the targeting efficiency and ligand (electrophile) occupancy can be calculated. d, WT embryos were injected with mRNA encoding either Halo-Keap1or Halo-P2A-Keap1. Embryos were then treated with Ht-PreHNE (+) or DMSO (−) only. After 30 hpf, all embryos (samples from both + and − lanes) were exposed to light, then immediately collected. After embryo lysis, the lysate was treated with TEV protease before biotin pulldown assay, to selectively enrich the proteins that had been modified by HNE(alkyne-functionalized). (Note: (1) the Halo from Halo-P2A-Keap1 was tagged with HA, but not the Halo from Halo-Keap1: see labels within the figure for a more detailed description of constructs; (2) the photo-uncaging process was not fully completed, which resulted in the enriched Halo band in the last lane in the top blot)
Fig. 4 |
Fig. 4 |. The simultaneous use of genome-encoded fluorescent reporter fish and qRT–PCR method allows an independent validation of pathway activation.
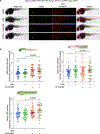
In this example, the use of Tg(gstp1:GFP) reporter fish and qRT–PCR, on the established electrophile-sensing Keap1–Nrf2–AR pathway shows that Z-REX upregulates AR via targeted mechanism that requires association of HaloTag and Keap1. a, Representative images of Tg(gstp1:GFP) fish injected with Halo-Keap1 mRNA exposed to either DMSO, Z-REX (4 h incubation post light exposure) or Tecfidera (25 μM, 4 h treatment). The GFP expression (reporting AR upregulation) induced by Z-REX in tail is indicated with an arrow. Age: 34 hpf. b, Identical to a except Halo-2×HA-P2A-Keap1–2×HA construct was used in place of Halo-Keap1. Age: 34 hpf. c, Quantification of mean GFP intensity of the reporter fish in a and b. Age: 34 hpf. Halo-Keap1 mRNA-injected (from left to right): n = 43, SEM 0.0898; n = 29, SEM 0.0872; n = 47, SEM 0.0547; n = 58, SEM 0.1010; n = 24, SEM 0.1613. Halo-P2A-Keap1 mRNA-injected (from left to right): n = 55, SEM 0.0689; n = 49, SEM 0.0805; n = 52, SEM 0.0905; n = 47, SEM 0.0721; n = 9, SEM 0.1509. d, Similar experimental design to c, except mRNA was extracted 2-h post light exposure (age: 32 hpf) and relative abundance of gstp1 (an endogenous downstream gene driven by the conserved Keap1–Nrf2–AR pathway) relative to β-actin (house-keeping gene) was assessed by qRT–PCR. Halo-Keap1 mRNA-injected (from left to right): n = 8, SEM 0.0257; n = 8, SEM 0.0706; n = 8, SEM 0.0975; n = 6, SEM 0.1158. Halo-P2A-Keap1 mRNA-injected (from left to right): n = 10, SEM 0.0749; n = 10, SEM 0.0456; n = 9, SEM 0.0836; n = 10, SEM 0.0786. Scale bar in (a and b), 200 μm. Scale bar, 500 μm in all images. P values were calculated with two-tailed unpaired Student’s t-test.
Fig. 5 |
Fig. 5 |. Z-REX enables precision investigations into tissue-specific and POI-specific electrophile signaling.
The result shows that Z-REX precisely upregulates the AR signal only in cardiomyocytes, but not in other regions. a, Representative images of (myl7:DsRed-P2A-Halo-TEV-Keap1–2×HA, cry:mRFP1, gstp1:GFP) fish treated with DMSO, light, 0.3 μM Ht-PreHNE or Z-REX (with 0.3 μM Ht-PreHNE). Scale bar, 500 μm in all images. Whole-fish images are in Extended Data Fig. 4a. Age: 34 hpf. b, Quantification of mean GFP intensity. The quantification strategy is described in the Discussion. Briefly, the heart region is defined by DsRed signal, which marks the cardiomyocytes. Z-REX-treated groups show two-fold higher AR signal than other negative control groups (DMSO, light or Ht-PreHNE alone). Also see Extended Data Fig. 4b for the quantification of AR signal in head, tail and whole fish. Age: 34 hpf. From left to right: n = 32, SEM 0.0359; n = 36, SEM 0.0502; n = 35, SEM 0.0446; n = 45, SEM 0.0748. P values were calculated with two-tailed unpaired Student’s t-test.
Fig. 6 |
Fig. 6 |. Prescreening of fish embryos using a representative fluorescent reporter construct.
In this example, Akt-kinase activity reporter construct (AktAR) was used. a, Schematic of the ratiometric dual-fluorescence protein-based reporter, AktAR plasmid (the ratiometric FRET-based AktAR directly reports phosphorylation of a peptide substrate (purple) by Akt isozymes (POI in this example), which is coupled to in an increase in FRET through interaction of the phospho-peptide-binding domain (green) to the phosphorylated peptide substrate). b, Embryos were co-injected with the mRNA encoding Halo-Akt and 25 ng/μl AktAR plasmid (into the single cell; Extended Data Fig. 7f). After 24 h, embryos in the chorion were screened for fluorescence using a fluorescence stereomicroscope (excitation 495 nm, emission 500–550nm). Gray arrows indicate animals expressing reporter gene that are ideal for imaging; yellow arrows indicate wild-type animals; blue arrows indicate embryos expressing reporter gene and have with high yolk-sac fluorescence; red arrow indicates an embryo with reporter gene expression level highly deviated from other fish, and thus less likely to yield high-quality data. The zoom-in image of a fish ideal for imaging is shown in the white box. c, Fish in b were dechorionated, placed on a 2% (wt/vol) agarose pad and imaged similarly, but at higher magnification than in b. Fish at far right (arrow) is best for confocal imaging. d, Higher-magnification image showing one embryo with high fluorescence in yolk sac and the other in the head region (marked by gray arrow). We here only demonstrate the prescreening images. Applications of this reporter plasmid in Z-REX and their results are reported in our previous work. Scale bar, 500 μm in all images.

Similar articles

Cited by

References

    1. Lim W, Mayer B, Pawson T Cell Signaling: Principles and Mechanisms (Taylor & Francis, 2015).
    1. Murphy HC The use of whole animals versus isolated organs or cell culture in research. Trans. Nebr. Acad. Sci. Aff. Soc. XVIII, 105–108 (1991).
    1. Verdin E & Ott M 50 years of protein acetylation: from gene regulation to epigenetics, metabolism and beyond. Nat. Rev. Mol. Cell Biol. 16, 258–264 (2015). - PubMed
    1. Chen Z & Cole PA Synthetic approaches to protein phosphorylation. Curr. Opin. Chem. Biol. 28, 115–122 (2015). - PMC - PubMed
    1. Komander D & Rape M The ubiquitin code. Ann. Rev. Biochem. 81, 203–229 (2012). - PubMed

Publication types

LinkOut - more resources