

The burden of nonalcoholic steatohepatitis (NASH) in the United States
- PMID: 37020273
- PMCID: PMC10077759
- DOI: 10.1186/s12876-023-02726-2
The burden of nonalcoholic steatohepatitis (NASH) in the United States
Abstract
Background: There is limited data on the comparative economic and humanistic burden of non-alcoholic steatohepatitis (NASH) in the United States. The objective was to examine the burden of disease comparing NASH to a representative sample of the general population and separately to a type 2 diabetes mellitus (T2DM) cohort by assessing health-related quality of life (HRQoL) measures, healthcare resource use (HRU) and work productivity and activity impairment (WPAI).
Methods: Data came from the 2016 National Health and Wellness Survey, a nationally representative patient-reported outcomes survey conducted in the United States. Respondents with physician-diagnosed NASH, physician-diagnosed T2DM, and respondents from the general population were compared. Humanistic burden was examined with mental (MCS) and physical (PCS) component summary scores from the Short-Form (SF)-36v2, concomitant diagnosis of anxiety, depression, and sleep difficulties. Economic burden was analysed based on healthcare professional (HCP) and emergency room (ER) visits, hospitalizations in the past six months; absenteeism, presenteeism, overall work impairment, and activity impairment scores on WPAI questionnaire. Bivariate and multivariable analysis were conducted for each outcome and matched comparative group.
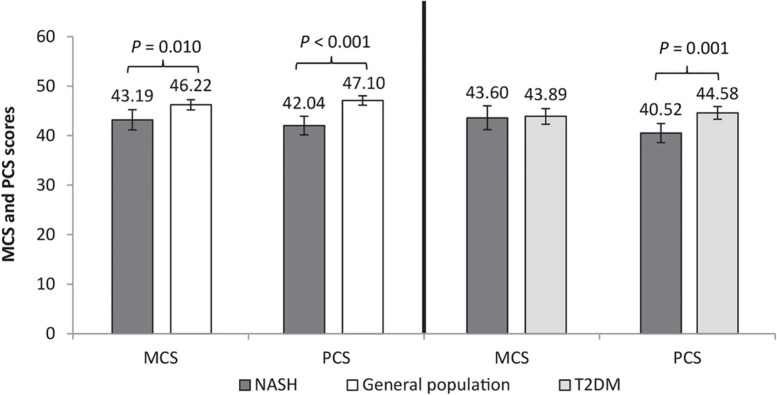
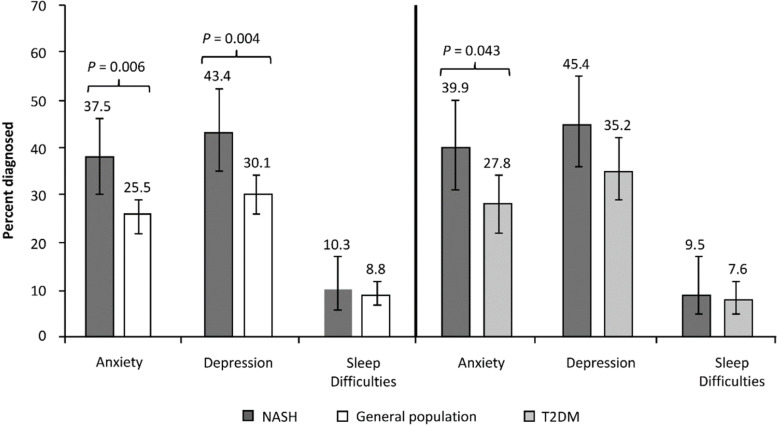
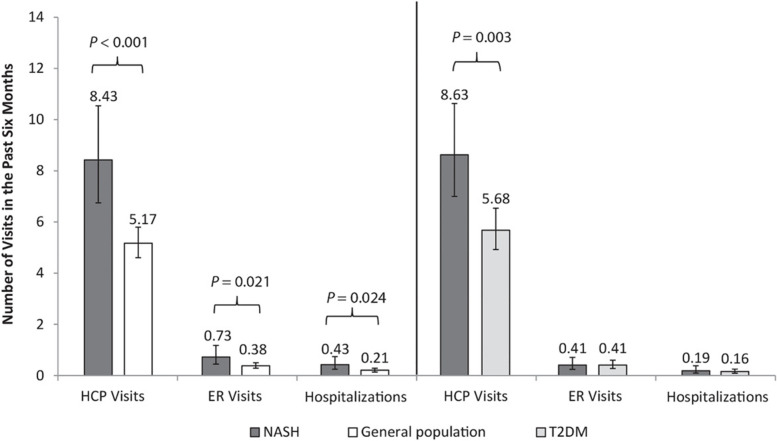
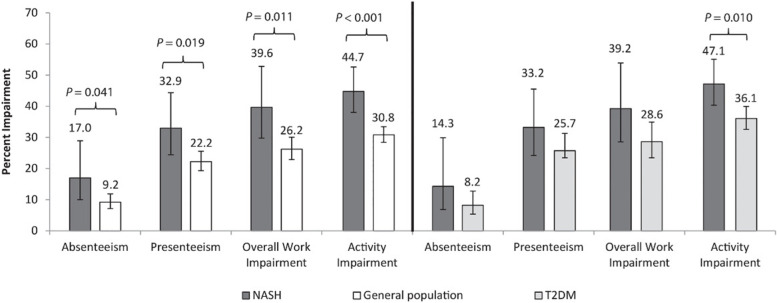
Results: After adjusting for baseline demographics and characteristics, NASH (N = 136) compared to the matched general population cohort (N = 544), reported significantly lower (worse) mental (MCS 43.19 vs. 46.22, p = 0.010) and physical (PCS 42.04 vs. 47.10, p < 0.001) status, higher % with anxiety (37.5% vs 25.5%, p = 0.006) and depression (43.4% vs 30.1%, p = 0.004), more HCP visits (8.43 vs. 5.17), ER visits (0.73 vs. 0.38), and hospitalizations (0.43 vs. 0.2) all p's < 0.05, and higher WPAI scores (e.g. overall work impairment 39.64% vs. 26.19%, p = 0.011). NASH cohort did not differ from matched T2DM cohort (N = 272) on mental or work-related WPAI scores, but had significantly worse physical status (PCS 40.52 vs. 44.58, p = 0.001), higher % with anxiety (39.9% vs 27.8%, p = 0.043), more HCP visits (8.63 vs. 5.68, p = 0.003) and greater activity impairment (47.14% vs. 36.07%, p = 0.010).
Conclusion: This real-world study suggests that burden of disease is higher for all outcomes assessed among NASH compared to matched general controls. When comparing to T2DM, NASH cohort has comparable mental and work-related impairment but worse physical status, daily activities impairment and more HRU.
Keywords: Burden of illness; NAFLD; Nonalcoholic fatty liver disease; Type 2 diabetes; US.
© 2023. The Author(s).
Conflict of interest statement
Elliot B. Tapper received a consultancy fee for his medical expertise on this project from Novartis Pharmaceuticals Corp., US. Maria-Magdalena Balp and Nico Janssens are employees of Novartis Pharma AG, Basel, Switzerland. Nate Way is an employee of Cerner Enviza (formally Kantar Health), Raymond Przybysz and Jennifer Cai are employees of Novartis Pharmaceuticals Corp., US, and Sarah Jane McKenna is an employee of Novartis Business Services Centre, Ireland.
Nancy Krieger, Dion Zappe and Garth Wall were employees of Novartis Pharmaceuticals Corp., US at the time of the study and the initial development of the manuscript.
Figures
References
-
- Nonalcoholic Fatty Liver Disease & NASH. National Institute of Diabetes and Digestive and Kidney Diseases. Published 2018. https://www.niddk.nih.gov/health-information/liver-disease/nafld-nash. Accessed 3 Jan 2019.
-
- Radu C, Grigorescu M, Crisan D, Lupsor M, Constantin D, Dina L. Prevalence and associated risk factors of non-alcoholic fatty liver disease in hospitalized patients. J Gastrointestin Liver Dis. 2008;17(3):255–260. - PubMed
MeSH terms
LinkOut - more resources
Full Text Sources
Medical
Miscellaneous
