

Response of lymphocytes from pigs naturally infected with porcine respiratory disease complex at 3 different stages of development
- PMID: 37020577
- PMCID: PMC10069147
Response of lymphocytes from pigs naturally infected with porcine respiratory disease complex at 3 different stages of development
Abstract
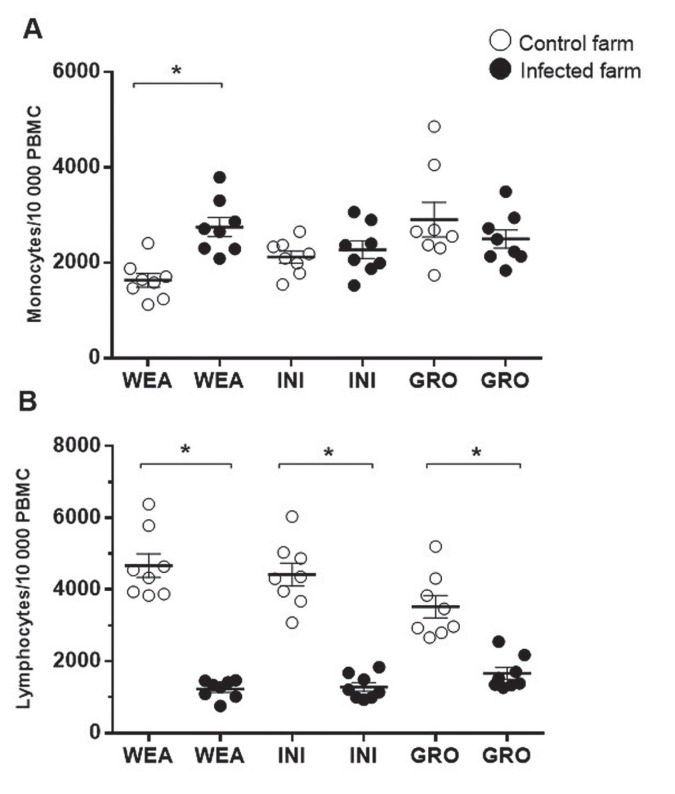
The objective of this study was to analyze the response of lymphocytes from pigs naturally infected with porcine respiratory disease complex (PRDC) at 3 different stages of development. Porcine respiratory disease complexes were isolated from 2 groups: The infected group, consisting of pigs with PRDC and no vaccination against any virus (n = 24), and the control group, consisting of vaccinated and noninfected piglets (n = 24). Both groups were sampled at 3 stages of development: Weaning (WEA) (n = 8), initiation (INI) (n = 8), and growth (GRO) (n = 8). The PRDC status was confirmed by serological testing against porcine circovirus type 2 (PCV-2), porcine reproductive and respiratory syndrome virus (PRRSV), swine influenza virus (H1N1), and Mycoplasma hyopneumoniae. PCV-2+ cells were quantified by flow cytometry. Weight gain was registered at each stage. PCV-2+ cells, CD4+ cells, monocytes and lymphocytes populations were measured. Gene expression in CD4+ cells was quantified for interferon-γ (IFN-γ), GATA binding protein 3 (GATA3), T-box transcription factor (T-bet), interleukin-10 (IL-10), and IL-4. Control piglets gained approximately 35% more weight than those infected with PRDC. Specifically, PCV-2+ cells were detected in piglets from the infected group in the following proportions: WEA ≤ INI ≤ GRO. In infected piglets, the CD4+ count increased at WEA and decreased at GRO, CD4+ expression profile showed an overexpression of T-bet at INI and GRO, and the expression of IFN-γ was lower at WEA and GRO. In contrast, IL-4 was overexpressed at all 3 stages. GATA3 was overexpressed at INI and GRO. The infected piglets showed lymphopenia and less CD4+ cells. CD4+ cells showed a different expression profile than the control group, in which IFN-γ was less expressed, whereas IL-4 and T-bet were overexpressed.
L’objectif de cette étude était d’analyser la réponse des lymphocytes de porcs naturellement infectés par le complexe respiratoire porcin (PRDC) à trois stades de développement différents. Des PRDC ont été isolés à partir de deux groupes : le groupe infecté, composé de porcs atteints de PRDC et non vaccinés contre un virus (n = 24), et le groupe témoin, composé de porcelets vaccinés et non infectés (n = 24). Les deux groupes ont été échantillonnés à trois stades de développement : sevrage (WEA) (n = 8), initiation (INI) (n = 8) et croissance (GRO) (n = 8). Le statut de PRDC a été confirmé par des tests sérologiques contre le circovirus porcin de type 2 (PCV-2), le virus du syndrome reproducteur et respiratoire porcin (PRRSV), le virus de la grippe porcine (H1N1) et Mycoplasma hyopneumoniae. Les cellules PCV-2+ ont été quantifiées par cytométrie en flux. Un gain de poids a été enregistré à chaque étape. Les populations de cellules PCV-2+, de cellules CD4+, de monocytes et de lymphocytes ont été mesurées. L’expression génique dans les cellules CD4+ a été quantifiée pour l’interféron-γ (IFN-γ), la protéine de liaison GATA 3 (GATA3), le facteur de transcription T-box (T-bet), l’interleukine-10 (IL-10) et l’IL-4. Les porcelets témoins ont pris environ 35 % de poids en plus que ceux infectés par le PRDC. Plus précisément, des cellules PCV-2+ ont été détectées chez les porcelets du groupe infecté dans les proportions suivantes : WEA ≤ INI ≤ GRO. Chez les porcelets infectés, le nombre de CD4+ a augmenté à WEA et diminué à GRO, le profil d’expression de CD4+ a montré une surexpression de T-bet à INI et GRO, et l’expression d’IFN-γ était plus faible à WEA et GRO. En revanche, l’IL-4 était surexprimée aux trois stades. GATA3 était surexprimé à INI et GRO. Les porcelets infectés présentaient une lymphopénie et moins de cellules CD4+. Les cellules CD4+ ont montré un profil d’expression différent de celui du groupe témoin, dans lequel l’IFN-γ était moins exprimé, tandis que l’IL-4 et le T-bet étaient surexprimés.(Traduit par Docteur Serge Messier).
Copyright and/or publishing rights held by the Canadian Veterinary Medical Association.
Figures


Similar articles
-
Comparative effects of vaccination against porcine circovirus type 2 (PCV2) and porcine reproductive and respiratory syndrome virus (PRRSV) in a PCV2-PRRSV challenge model.Clin Vaccine Immunol. 2013 Mar;20(3):369-76. doi: 10.1128/CVI.00497-12. Epub 2013 Jan 9. Clin Vaccine Immunol. 2013. PMID: 23302743 Free PMC article.
-
Increased prevalence of torque teno viruses in porcine respiratory disease complex affected pigs.Vet Microbiol. 2012 May 25;157(1-2):61-8. doi: 10.1016/j.vetmic.2011.12.013. Epub 2011 Dec 16. Vet Microbiol. 2012. PMID: 22227415
-
Optimal vaccination strategy against Mycoplasma hyopneumoniae, porcine reproductive and respiratory syndrome virus, and porcine circovirus type 2 in case of early M. hyopneumoniae infection.Vet Med Sci. 2020 Nov;6(4):860-874. doi: 10.1002/vms3.284. Epub 2020 May 28. Vet Med Sci. 2020. PMID: 32462794 Free PMC article.
-
Porcine respiratory disease complex: Interaction of vaccination and porcine circovirus type 2, porcine reproductive and respiratory syndrome virus, and Mycoplasma hyopneumoniae.Vet J. 2016 Jun;212:1-6. doi: 10.1016/j.tvjl.2015.10.030. Epub 2015 Oct 23. Vet J. 2016. PMID: 27256017 Review.
-
Porcine circovirus-2 and concurrent infections in the field.Vet Microbiol. 2004 Feb 4;98(2):159-63. doi: 10.1016/j.vetmic.2003.10.008. Vet Microbiol. 2004. PMID: 14741128 Review.
Cited by
-
Challenges and Lessons Learned from a Field Trial on the Understanding of the Porcine Respiratory Disease Complex.Vaccines (Basel). 2025 Jul 9;13(7):740. doi: 10.3390/vaccines13070740. Vaccines (Basel). 2025. PMID: 40733717 Free PMC article.
References
-
- Lv QZ, Guo KK, Zhang YM. Current understanding of genomic DNA of porcine circovirus type 2. Virus Genes. 2014;49:1–10. - PubMed
-
- Nauwynck HJ, Sanchez R, Meerts P, et al. Cell tropism and entry of porcine circovirus 2. Virus Res. 2012;164:43–45. - PubMed
-
- Tischer I, Rasch R, Tochtermann G. Characterization of papovavirus- and picornavirus-like particles in permanent pig kidney cell lines. Zentralbl Bakteriol Orig A. 1974;226:153–167. - PubMed
-
- Noriega J, Reyes P, Bucarey S. Circovirus Porcino : Un virus pequeño que genera un gran problema Porcine Circovirus : A small virus that causes a great problem. Av en Ciencias Vet. 2007;22:62–71.
MeSH terms
Substances
LinkOut - more resources
Full Text Sources
Research Materials