. 2023 Feb 22;7(4):2200208.
doi: 10.1002/gch2.202200208. eCollection 2023 Apr.

Modeling and Thermodynamic Studies of γ-Valerolactone Production from Bio-derived Methyl Levulinate

Affiliations

Modeling and Thermodynamic Studies of γ-Valerolactone Production from Bio-derived Methyl Levulinate

Elena Montejano-Nares et al. Glob Chall. .

Abstract

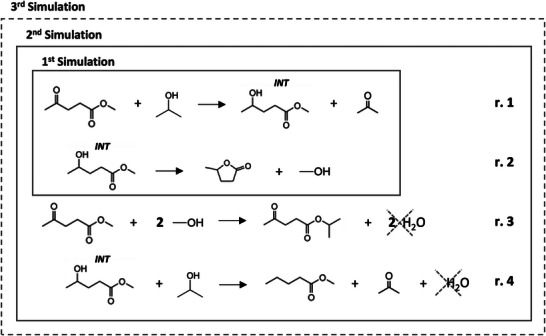
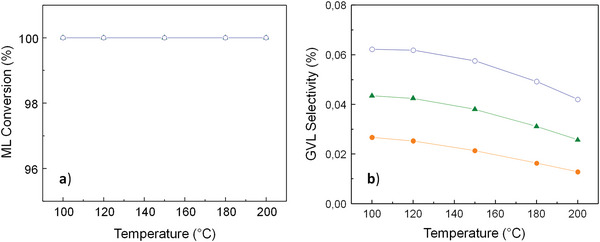
The exploitation of biomass to reduce the dependency on fossil fuels represents a challenge that needs to be solved as soon as possible. Nowadays, one of the most fashionable processes is γ-valerolactone (GVL) production from bio-derived methyl levulinate (ML). Deep understanding of the thermodynamic aspects involved in this process is key for a successful outcome, but detailed studies are missing in the existing literature. A thermodynamic study of the reaction of γ-valerolactone (GVL) production from bio-derived methyl levulinate (ML) is performed by the Gibbs free energy minimization method. The effect of various reaction conditions (temperature, concentration, flow rate) and the implication of possible intermediates and byproducts are assessed. Conversion and selectivity are calculated from the simulation of the ML hydrogenation using isopropanol as the hydrogen donor under continuous flow conditions. Significant increases in GVL selectivity can be achieved under dry conditions, keeping the high conversion. Comparison between theoretical and experimental results from a previous article discloses the effect of using 5%RuTiO2 catalysts, which increases the selectivity from 3-40% to 41-98%. Enthalpy and Gibbs free energy of the reactions at issue are also calculated from models using Barin equations according to Aspen Physical Property System parameters.

Keywords: Aspen Plus; Hydrogenation; Methyl levulinate; Thermodynamic analysis; γ‐valerolactone.


Conflict of interest statement

The authors declare no conflict of interest.

Figures

Figure 1
Figure 1
Possible reaction pathway for the continuous‐flow catalytic transfer hydrogenation of methyl levulinate by using Ru catalysts.[ 36 ]
Figure 2
Figure 2
Simulation schemes and associated reactions considered for theoretical calculation using Aspen Plus. All reactions included in each simulation scheme have been treated as simultaneous possibilities: ML hydrogenation with isopropanol (r. 1), GVL production from the intermediate (r. 2), and byproducts production from ML (r. 3) and the intermediate (r. 4). Acronyms: INT = Intermediate (methyl 4‐hydroxypentanoate).
Figure 3
Figure 3
Conversion of ML a) and selectivity to GVL b) at a pressure of 35 bar for the 1st simulation (Figure 2) conducted in Aspen Plus. Symbols: (‐●‐) CML,initial = 0.3 mol·L−1, (‐▲‐) CML,initial = 0.45 mol·L−1 (‐○‐), CML,initial = 0.6 mol·L−1 (for all initial flow rates between 0.3‐ 1 mL·min−1). Acronyms: CML, initial = ML initial concentration.
Figure 4
Figure 4
Molar flow rate of GVL at a pressure of 35 bar for the 1st simulation (Figure 2) conducted in Aspen Plus. Symbols: (‐●‐) FR = 0.3 mL·min−1, (‐▲‐) FR = 0.5 mL·min−1 (‐○‐), FR = 0.7 mL·min−1, (‐∎‐) FR = 1 mL·min−1. Acronyms: FRGVL,final = GVL final production, FR = Inlet flow rate, CML,initial = ML initial concentration.
Figure 5
Figure 5
Conversion of ML a) and selectivity to GVL b) at a pressure of 35 bar for the 2nd simulation (Figure 2) conducted in Aspen Plus. Symbols: (‐●‐) CML,initial = 0.3 mol·L−1, (‐▲‐) CML,initial = 0.45 mol·L−1 (‐○‐) CML,initial = 0.6 mol·L−1 (for all initial flow rates between 0.3‐ 1 mL·min−1). Acronyms: CML,initial = ML initial concentration.
Figure 6
Figure 6
Molar flow rate of GVL at a pressure of 35 bar for the 2nd simulation (Figure 2) conducted in Aspen Plus. Symbols: (‐●‐) FR = 0.3 mL·min−1, (‐▲‐) FR = 0.5 mL·min−1 (‐○‐), FR = 0.7 mL·min−1, (‐∎‐) FR = 1 mL·min−1. Acronyms: FRGVL, final = GVL final production, FR = Inlet flow rate, CML, initial = ML initial concentration.
Figure 7
Figure 7
Conversion of ML a) and selectivity to GVL b) at a pressure of 35 bar for the 3rd simulation (Figure 2) conducted in Aspen Plus. Symbols: (‐●‐) CML,initial = 0.3 mol·L−1, (‐▲‐) CML,initial = 0.45 mol·L−1 (‐○‐) CML,initial = 0.6 mol·L−1 (for all initial flow rates between 0.3‐ 1 mL·min−1). Acronyms: CML, initial = ML initial concentration.
Figure 8
Figure 8
Molar flow rate of GVL at a pressure of 35 bar for the 3rd simulation (Figure 2) conducted in Aspen Plus. Symbols: (‐●‐) FR = 0.3 mL·min−1, (‐▲‐) FR = 0.5 mL·min−1 (‐○‐), FR = 0.7 mL·min−1, (‐∎‐) FR = 1 mL·min−1. Acronyms: FRGVL,final = GVL final production, FR = Inlet flow rate, CML,initial = ML initial concentration.

References

    1. Stöcker M., Angew. Chem., Int. Ed. 2008, 47, 9200. - PubMed
    1. Alonso D. M., Bond J. Q., Dumesic J. A., Green Chem. 2010, 12, 1493.
    1. Alonso D. M., Wettstein S. G., Dumesic J. A., Chem. Soc. Rev. 2012, 41, 8075. - PubMed
    1. García A., Miguel P. J., Pico M. P., Álvarez‐Serrano I., López M. L., García T., Solsona B., Appl. Catal. Gen. 2021, 623, 118276.
    1. Huber G. W., Corma A., Angew. Chem., Int. Ed. 2007, 46, 7184. - PubMed

LinkOut - more resources