. 2023 Mar 20:17:1133400.
doi: 10.3389/fncel.2023.1133400. eCollection 2023.

Brain vitamin D3-auto/paracrine system in relation to structural, neurophysiological, and behavioral disturbances associated with glucocorticoid-induced neurotoxicity

Affiliations

Brain vitamin D3-auto/paracrine system in relation to structural, neurophysiological, and behavioral disturbances associated with glucocorticoid-induced neurotoxicity

Olha Lisakovska et al. Front Cell Neurosci. .

Abstract

Introduction: Vitamin D3 (VD3) is a potent para/autocrine regulator and neurosteroid that can strongly influence nerve cell function and counteract the negative effects of glucocorticoid (GC) therapy. The aim of the study was to reveal the relationship between VD3 status and behavioral, structural-functional and molecular changes associated with GC-induced neurotoxicity.

Methods: Female Wistar rats received synthetic GC prednisolone (5 mg/kg b.w.) with or without VD3 (1000 IU/kg b.w.) for 30 days. Behavioral, histological, physiological, biochemical, molecular biological (RT-PCR, Western blotting) methods, and ELISA were used.

Results and discussion: There was no difference in open field test (OFT), while forced swim test (FST) showed an increase in immobility time and a decrease in active behavior in prednisolone-treated rats, indicative of depressive changes. GC increased the perikaryon area, enlarged the size of the nuclei, and caused a slight reduction of cell density in CA1-CA3 hippocampal sections. We established a GC-induced decrease in the long-term potentiation (LTP) in CA1-CA3 hippocampal synapses, the amplitude of high K+-stimulated exocytosis, and the rate of Ca2+-dependent fusion of synaptic vesicles with synaptic plasma membranes. These changes were accompanied by an increase in nitration and poly(ADP)-ribosylation of cerebral proteins, suggesting the development of oxidative-nitrosative stress. Prednisolone upregulated the expression and phosphorylation of NF-κB p65 subunit at Ser311, whereas downregulating IκB. GC loading depleted the circulating pool of 25OHD3 in serum and CSF, elevated VDR mRNA and protein levels but had an inhibitory effect on CYP24A1 and VDBP expression. Vitamin D3 supplementation had an antidepressant-like effect, decreasing the immobility time and stimulating active behavior. VD3 caused a decrease in the size of the perikaryon and nucleus in CA1 hippocampal area. We found a recovery in depolarization-induced fusion of synaptic vesicles and long-term synaptic plasticity after VD3 treatment. VD3 diminished the intensity of oxidative-nitrosative stress, and suppressed the NF-κB activation. Its ameliorative effect on GC-induced neuroanatomical and behavioral abnormalities was accompanied by the 25OHD3 repletion and partial restoration of the VD3-auto/paracrine system.

Conclusion: GC-induced neurotoxicity and behavioral disturbances are associated with increased oxidative-nitrosative stress and impairments of VD3 metabolism. Thus, VD3 can be effective in preventing structural and functional abnormalities in the brain and behavior changes caused by long-term GC administration.

Keywords: behavioral impairments; glucocorticoid-induced neurotoxicity; glucocorticoids; oxidative-nitrosative stress; prednisolone; vitamin D-auto/paracrine system; vitamin D3.


Conflict of interest statement

The authors declare that the research was conducted in the absence of any commercial or financial relationships that could be construed as a potential conflict of interest.

Figures

FIGURE 1
FIGURE 1
Schematic representation of the experimental design and timescale. Each experimental group included 20 animals: (1) The control group that received purified water (0.1 ml) and oil solution (0.1 ml) as vehicles; (2) the group with glucocorticoid-induced neurotoxicity, in which rats received orally the water solution of synthetic glucocorticoid prednisolone (Biopharma, Ukraine) at a dose of 5 mg/kg of body weight (30 days) and additionally oil solution (0.1 ml) as vehicle; (3) the group that received the oil solution of vitamin D3 (Sigma-Aldrich, USA, C9756) at a dose of 1,000 IU/kg of body weight per os (30 days) on the background of prednisolone administration (5 mg/kg of body weight). Behavioral procedures (OFT, open-field test; FST, forced swim test; EPM, elevated plus maze; C/C FC, contextual/cued fear conditioning test) were performed during 3 days before the decapitation with the concurrent drug administration (n = 8 per group). At the end of the experimental treatment, the rats were anesthetized by an intraperitoneal injection of chloral hydrate (40 mg/100 g of body weight), decapitated with a guillotine. Blood samples were taken from the inferior vena cava to measure 25OHD3 by ELISA (n = 20 per group). The whole brain was quickly dissected and was used fresh (for synaptosome preparation, n = 4–5) or transferred into the appropriate buffer depending on the procedures: 10% formalin solution in cold 0.1 M phosphate-buffered saline (pH 7.4)—for histological assessment (n = 5 per group); an ice-cold solution of oxygenated (95% O2, 5% CO2) artificial cerebrospinal fluid (ACSF) solution (119 mM NaCl, 2.5 mM KCl, 2.0 mM CaCl2, 1.3 mM MgCl2, 26 mM NaHCO3, 1.0 mM NaH2PO4, 11 mM glucose, pH 7.35)—for electrophysiological studies (n = 5 per group); and a liquid nitrogen—for western blotting, RT-PCR and ELISA (n = 8 per group).
FIGURE 2
FIGURE 2
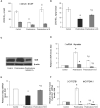
Vitamin D3 circulating pool and the state of vitamin D3-auto/paracrine system in the brain tissue. 25OHD3 concentration in the serum, cerebrospinal fluid (A) and brain homogenates (B) were measured by ELISA (n = 20). VDR protein (C,D) and mRNA (D) levels were determined by western blotting and quantitative RT-PCR respectively in rat brain tissue of three animal groups: 1—control; 2—prednisolone administration; 3—prednisolone and vitamin D3 administration (n = 8 rats/group). Representative immunoblots are shown near the bar charts (C). Cyp27b1 (E) and Cyp24a1 (F) mRNA levels were assessed by quantitative RT-PCR. All protein levels were normalized to β-actin and mRNA levels—to Gapdh expression. All data are presented as mean ± SD of three independent experiments done in triplicate; *p < 0.05 denotes significance compared with control, #p < 0.05 denotes significance compared with prednisolone administration.
FIGURE 3
FIGURE 3
The influence of prednisolone and vitamin D3 on the parameters of the open field (OFT) and forced swim (FST) tests. Animals from three experimental groups: 1—control; 2—prednisolone administration; 3—prednisolone and vitamin D3 administration (n = 8 rats/group) were subjected to the OFT (A–C) and FST (D–F). Total distance traveled (A), time spent in outer (B) and inner (C) zones were calculated during the OFT. Total immobility time (D) and the parameters of active behavior: swimming (E), and climbing (F) were assessed during the FST. All data are presented as mean ± SD of three independent experiments done in triplicate; *p < 0.05 denotes significance compared with control, #p < 0.05 denotes significance compared with prednisolone administration.
FIGURE 4
FIGURE 4
The effect of prednisolone and vitamin D3 on the behavior in the elevated plus maze (EPM) and contextual and cued fear conditioning and memory test. Animals from three experimental groups: 1—control; 2—prednisolone administration; 3—prednisolone and vitamin D3 administration (n = 8 rats/group) were subjected to the EPM (A,B) and contextual/cued conditioning test (C,D). The percentage of entries into the open arms to the total time (Op/Tot) (A) and the ratio of time spent in the open arms to the total time (Op/Tot) (B) were measured during the EPM. Mean freezing time levels during the contextual (C) and cued (D) conditioning test were assessed after prednisolone and vitamin D3 treatment during training and testing days. All data are presented as mean ± SD of three independent experiments done in triplicate; *p < 0.05 denotes significance compared with control, #p < 0.05 denotes significance compared with prednisolone administration.
FIGURE 5
FIGURE 5
Histological examination of hippocampus, cerebral cortex, thalamus and cerebellum after prednisolone and vitamin D3 treatment (toluidine blue or hematoxylin & eosin staining). Representative images of toluidine blue-stained 6-μm rat CA1 hippocampal sections section (A), H&E-stained cerebral cortex (prefrontal cortex) (B), sensory-motor cortex (C), H&E-stained thalamus sections (posterior thalamic nucleus) (D), and H&E-stained cerebellar cortex (E) from the control, prednisolone-administered and prednisolone plus vitamin D3-administered rats (n = 5 rats/group, 400× magnification).
FIGURE 6
FIGURE 6
Glucocorticoid-induced disturbances of synaptic function and its correction by the vitamin D3 supplementation. Depolarization-induced exocytosis in rat brain nerve terminals (synaptosomes) (A) and quantification of the mean amplitude Δ (B). Nerve terminals were isolated from the control, prednisolone-treated and prednisolone plus vitamin D3-treated rats. Spectrofluorimetric registration of pH-sensitive dye – acridine orange (AO), n = 4. The rate of synaptic vesicle fusion with plasma membranes in cell-free system (C). Fusion was determined by monitoring of R18 fluorescence dequenching in suspension of R18-labeled synaptic vesicles and unlabeled synaptic plasma membranes upon Ca2+ application in control and prednisolone-administered rats, n = 5 (traces). Cholesterol content in synaptic plasma membranes (D) of control and prednisolone-treated rats (n = 5). All data are presented as mean ± SD of three independent experiments done in triplicate; *p < 0.05 denotes significance compared with control, #p < 0.05 denotes significance compared with prednisolone administration.
FIGURE 7
FIGURE 7
Effect of vitamin D3 on prednisolone-induced alteration of synaptic plasticity in shaffer-collateral—CA1 synapses. fEPSP slope recorded before and after tetanic stimulation was shown (A) and the normalized fEPSP amplitudes was calculated (B) for the control, prednisolone-treated and prednisolone plus vitamin D3-treated rats (n = 5 rats/group). All points at panel (A) represent the average of three consecutive responses recorded every 20 s at the indicated time points. Data are presented as mean ± SD; *p < 0.05 denotes significance compared with control, #p < 0.05 denotes significance compared with prednisolone administration.
FIGURE 8
FIGURE 8
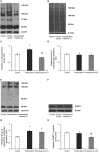
Oxidative-nitrosative stress after prednisolone and vitamin D3 administration. Levels of 3-nitrotyrosine (A,C), carbonylated proteins (B,D), poly(ADP)-rybosilated proteins (E,G) and PARP-1 (F,H) were determined by western blot analysis in rat brain tissue of three animal groups: 1—control; 2—prednisolone administration; 3—prednisolone and vitamin D3 administration (n = 8 rats/per group). Representative immunoblots are shown above the bar charts. Protein levels were normalized to β-actin and/or lamin B1. All data are presented as mean ± SD of three independent experiments done in triplicate; *p < 0.05 denotes significance compared with control, #p < 0.05 denotes significance compared with prednisolone administration (one-way ANOVA, Tukey’s post-hoc test).
FIGURE 9
FIGURE 9
Glucocorticoid receptor level and NF-κB/IκB pathway in brain tissue after prednisolone and vitamin D3 administration. Glucocorticoid receptor protein (A,B) level was determined by western blot analysis. NF-κB signaling was characterized based on the Nfb p65 mRNA level (C), NF-κB p65 phosphorylated at Ser 311 (Western blot) (A,C) and IκB protein (A,D) and mRNA (D) levels in rat brain tissue of three animal groups: 1—control; 2—prednisolone administration; 3—prednisolone and vitamin D3 administration (n = 8 rats/group). Protein level was normalized to β-actin and mRNA levels—to Gapdh expression. All data are presented as mean ± SD of three independent experiments done in triplicate; *p < 0.05 denotes significance compared with control, #p < 0.05 denotes significance compared with prednisolone administration (one-way ANOVA, Tukey’s post-hoc test).

Similar articles

Cited by

References

    1. Abdul-Razzak K. K., Almanasrah S. O., Obeidat B. A., Khasawneh A. G. (2018). Vitamin D is a potential antidepressant in psychiatric outpatients. Int. J. Clin. Pharmacol. Ther. 56 585–596. 10.5414/CP203309 - DOI - PubMed
    1. Abrahám I. M., Harkany T., Horvath K. M., Luiten P. G. (2001). Action of glucocorticoids on survival of nerve cells: Promoting neurodegeneration or neuroprotection? J. Neuroendocrinol. 13 749–760. 10.1046/j.1365-2826.2001.00705.x - DOI - PubMed
    1. Alan I. S., Alan B. (2017). “Side effects of glucocorticoids,” in Pharmacokinetics and adverse effects of drugs–mechanisms and risks factors, ed. Malangu N. (London: IntechOpen; ). 10.5772/intechopen.72019 - DOI
    1. Aoki S., Deyama S., Sugie R., Ishimura K., Fukuda H., Shuto S., et al. (2022). The antidepressant-like effect of resolvin E1 in repeated prednisolone-induced depression model mice. Behav. Brain Res. 418:113676. 10.1016/j.bbr.2021.113676 - DOI - PubMed
    1. Baas D., Prüfer K., Ittel M. E., Kuchler-Bopp S., Labourdette G., Sarliève L. L., et al. (2000). Rat oligodendrocytes express the vitamin D(3) receptor and respond to 1,25-dihydroxyvitamin D(3). Glia 31 59–68. 10.1002/(sici)1098-1136(200007)31:1<59::aid-glia60<3.0.co;2-y - DOI - PubMed