. 2023 Mar 31:11:e15163.
doi: 10.7717/peerj.15163. eCollection 2023.

Assessing arthropod diversity metrics derived from stream environmental DNA: spatiotemporal variation and paired comparisons with manual sampling

Affiliations

Assessing arthropod diversity metrics derived from stream environmental DNA: spatiotemporal variation and paired comparisons with manual sampling

Aaron A Aunins et al. PeerJ. .

Abstract

Background: Benthic invertebrate (BI) surveys have been widely used to characterize freshwater environmental quality but can be challenging to implement at desired spatial scales and frequency. Environmental DNA (eDNA) allows an alternative BI survey approach, one that can potentially be implemented more rapidly and cheaply than traditional methods.

Methods: We evaluated eDNA analogs of BI metrics in the Potomac River watershed of the eastern United States. We first compared arthropod diversity detected with primers targeting mitochondrial 16S (mt16S) and cytochrome c oxidase 1 (cox1 or COI) loci to that detected by manual surveys conducted in parallel. We then evaluated spatial and temporal variation in arthropod diversity metrics with repeated sampling in three focal parks. We also investigated technical factors such as filter type used to capture eDNA and PCR inhibition treatment.

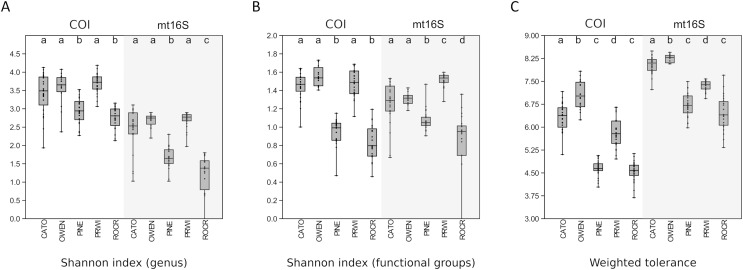
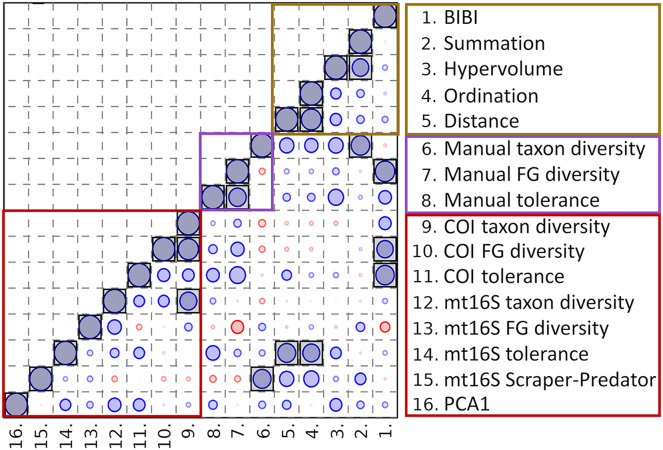
Results: Our results indicate that genus-level assessment of eDNA compositions is achievable at both loci with modest technical noise, although database gaps remain substantial at mt16S for regional taxa. While the specific taxa identified by eDNA did not strongly overlap with paired manual surveys, some metrics derived from eDNA compositions were rank-correlated with previously derived biological indices of environmental quality. Repeated sampling revealed statistical differences between high- and low-quality sites based on taxonomic diversity, functional diversity, and tolerance scores weighted by taxon proportions in transformed counts. We conclude that eDNA compositions are efficient and informative of stream condition. Further development and validation of scoring schemes analogous to commonly used biological indices should allow increased application of the approach to management needs.

Keywords: Arthropods; Benthic invertebrates; Biomonitoring; Freshwater streams; Metabarcoding; Water quality; eDNA.


Conflict of interest statement

The authors declare that they have no competing interests.

Figures

Figure 1
Figure 1. Maps of sampling locations.
Site identifiers used in text are shown. (A) Thirteen sites at which paired environmental DNA (eDNA) and manual sampling was performed. (B) Sites of repeated eDNA sampling within Catoctin Mountain Park, Maryland. (C) Sites of repeated sampling within Prince William Forest Park, Virginia. (D) Sites of repeated sampling within Rock Creek Park, District of Columbia. Map generated with the National Map Viewer tool (https://apps.nationalmap.gov/viewer/).
Figure 2
Figure 2. Variation in the proportions of arthropod functional and taxonomic groups represented in paired environmental DNA (eDNA) and manual surveys at thirteen sites.
COI and mt16S eDNA proportions are derived from log-ratio transformed sequence counts, whereas manual proportions are derived from counts of individuals. (A) Proportions of five functional groups commonly used in benthic invertebrate indices, grouped by method. (B) Proportions of six arthropod taxa commonly used in benthic invertebrate indices, grouped by method. COI, cytochrome c oxidase 1; mt16S, mitochondrial 16S.
Figure 3
Figure 3. Boxplots of quartiles for three environmental DNA (eDNA) diversity metrics obtained by repeated sampling of five reaches.
A significant difference of medians was found by Kruskal-Wallis test for all three metrics at both loci; letters indicate significant pairwise differences within each locus based on subsequent Mann-Whitney U tests. (A) Shannon index of genus proportions in transformed data. (B) Shannon index of functional group proportions in transformed data. (C) Sample tolerance score weighted by genus proportions in transformed data. COI, cytochrome c oxidase 1; mt16S, mitochondrial 16S.
Figure 4
Figure 4. Within-reach variation in three environmental DNA (eDNA) diversity metrics, from replicate samples obtained for the month of September only (n = 3–5 per site).
Boxplots indicate quartile values for each site (not fully defined for n < 4). Filter replicates were not obtained for Prince William Forest (PRWI) sites in September because a high level of suspended material prevented the use of the 0.2 micron filter. The red box highlights an unusually high weighted-tolerance score derived from mt16S taxa at PINE3. COI, cytochrome c oxidase 1; mt16S, mitochondrial 16S.
Figure 5
Figure 5. Seasonal comparison of weighted tolerance scores by site within reach.
September values are the average of all replicates for that month (other months were not replicated at the site level). (A) Trends by site and reach for COI weighted tolerance scores. (B) Pairwise Pearson correlation matrix for the values in panel A (n = 16 sites). The magnitude of each correlation coefficient is proportional to the size of the circle for all cross-month comparisons (range = 0.72–0.98 for all cross-month comparisons). Correlation coefficients significantly greater than zero after Bonferroni adjustment for multiple tests are shaded gray. (C) Trends by site and reach for mt16S weighted tolerance scores. (D) Pairwise Pearson correlation matrix for the values in panel C (n = 16 sites). The magnitude of each correlation coefficient is proportional to the size of the circle (range = 0.51–0.96 for all cross-month comparisons). Correlation coefficients significantly greater than zero after Bonferroni adjustment for multiple tests are shaded gray. COI, cytochrome c oxidase 1; mt16S, mitochondrial 16S. See Fig. 1 for a map of site locations.
Figure 6
Figure 6. Principle components analysis (PCA) of transformed compositions of arthropod genera detected with repeated environmental DNA (eDNA) sampling in five watersheds.
Circles represent 2019 samples and squares represent 2020 samples. Filled green points represent PRWI1 samples and filled blue points represent CATO2 samples (see text for details). The same genus detected at both loci was treated as two independent variables. The proportion of the total variation explained by each axis is given in parentheses. A scree plot comparing the variation explained by each axis (eigenvalue percentage) relative to a null ‘broken stick’ model is shown in the inset, indicating that the plotted axes explain more variation than expected by chance.
Figure 7
Figure 7. Potential metrics of arthropod diversity that strongly differentiated reaches.
Boxplots represent the quartiles of the distribution and points represent values for individual samples, jittered for legibility. A significant difference of medians was found by Kruskal-Wallis test for both metrics; letters indicate significant pairwise differences within each locus based on subsequent Mann-Whitney U tests. (A) Proportion of mt16S taxa classified as scraper or predator relative to all functional groups combined. (B) Scores obtained for samples from the first axis of the principal components analysis (PCA) illustrated in Fig. 6. mt16S, mitochondrial 16S.
Figure 8
Figure 8. Spearman’s rank correlations between five environmental quality metrics from other studies that integrate multiple variables (see text for details) and eleven metrics derived from manual and environmental DNA (eDNA) sampling in this study.
Single values for each metric were derived for eight units of the National Park Service (NPS) as described in the text. The size of the circle in each matrix cell is proportional to the pairwise correlation coefficient, with blue circles indicating the coefficient is positive and red circles indicating negative coefficients. Shaded cells indicate the pairwise comparison is significantly different from zero (unadjusted P < 0.05). No false-discovery correction is applied because the tests are not independent, therefore significance levels should be interpreted with caution. BIBI, Benthic invertebrate biological index; FG, functional group; PCA1, first principal components axis. COI, cytochrome c oxidase 1; mt16S, mitochondrial 16S.

Similar articles

Cited by

References

    1. Alberdi A, Aizpurua O, Gilbert MTP, Bohmann K, Mahon A. Scrutinizing key steps for reliable metabarcoding of environmental samples. Methods in Ecology and Evolution. 2018;9(1):134–147. doi: 10.1111/2041-210X.12849. - DOI
    1. Allan JD. Landscapes and riverscapes: the influence of land use on stream ecosystems. Annual Review of Ecology, Evolution, and Systematics. 2004;35(1):257–284. doi: 10.1146/annurev.ecolsys.35.120202.110122. - DOI
    1. Andersen K, Bird KL, Rasmussen M, Haile J, Breuning-Madsen H, Kjaer KH, Orlando L, Gilbert MTP, Willerslev E. Meta-barcoding of ‘dirt’DNA from soil reflects vertebrate biodiversity. Molecular Ecology. 2012;21(8):1966–1979. doi: 10.1111/j.1365-294X.2011.05261.x. - DOI - PubMed
    1. Bagley M, Pilgrim E, Knapp M, Yoder C, Santo Domingo J, Banerji A. High-throughput environmental DNA analysis informs a biological assessment of an urban stream. Ecological Indicators. 2019;104(69):378–389. doi: 10.1016/j.ecolind.2019.04.088. - DOI - PMC - PubMed
    1. Baird DJ, Hajibabaei M. Biomonitoring 2.0: a new paradigm in ecosystem assessment made possible by next-generation DNA sequencing. Molecular Ecology. 2012;21(8):2039–2044. doi: 10.1111/j.1365-294X.2012.05519.x. - DOI - PubMed

Publication types

Substances

LinkOut - more resources