

Finite Element Model-Computed Mechanical Behavior of Femurs with Metastatic Disease Varies Between Physiologic and Idealized Loading Simulations
- PMID: 37020922
- PMCID: PMC10068135
- DOI: 10.1177/11795972231166240
Finite Element Model-Computed Mechanical Behavior of Femurs with Metastatic Disease Varies Between Physiologic and Idealized Loading Simulations
Abstract
Background and objectives: Femurs affected by metastatic bone disease (MBD) frequently undergo surgery to prevent impending pathologic fractures due to clinician-perceived increases in fracture risk. Finite element (FE) models can provide more objective assessments of fracture risk. However, FE models of femurs with MBD have implemented strain- and strength-based estimates of fracture risk under a wide variety of loading configurations, and "physiologic" loading models typically simulate a single abductor force. Due to these variations, it is currently difficult to interpret mechanical fracture risk results across studies of femoral MBD. Our aims were to evaluate (1) differences in mechanical behavior between idealized loading configurations and those incorporating physiologic muscle forces, and (2) differences in the rankings of mechanical behavior between different loading configurations, in FE simulations to predict fracture risk in femurs with MBD.
Methods: We evaluated 9 different patient-specific FE loading simulations for a cohort of 54 MBD femurs: strain outcome simulations-physiologic (normal walking [NW], stair ascent [SA], stumbling), and joint contact only (NW contact force, excluding muscle forces); strength outcome simulations-physiologic (NW, SA), joint contact only, offset torsion, and sideways fall. Tensile principal strain and femur strength were compared between simulations using statistical analyses.
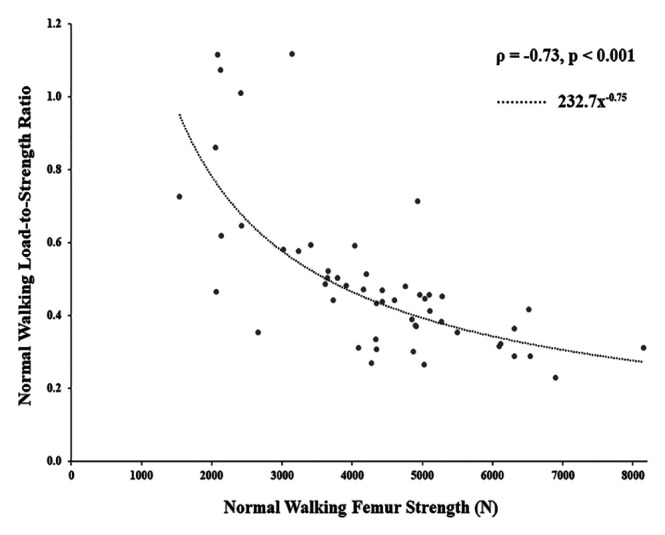
Results: Tensile principal strain was 26% higher (R 2 = 0.719, P < .001) and femur strength was 4% lower (R 2 = 0.984, P < .001) in simulations excluding physiologic muscle forces. Rankings of the mechanical predictions were correlated between the strain outcome simulations (ρ = 0.723 to 0.990, P < .001), and between strength outcome simulations (ρ = 0.524 to 0.984, P < .001).
Conclusions: Overall, simulations incorporating physiologic muscle forces affected local strain outcomes more than global strength outcomes. Absolute values of strain and strength computed using idealized (no muscle forces) and physiologic loading configurations should be used within the appropriate context when interpreting fracture risk in femurs with MBD.
Keywords: Metastatic bone disease; femur strength; finite element model; physiologic loading; strain.
© The Author(s) 2023.
Conflict of interest statement
The author(s) declared no potential conflicts of interest with respect to the research, authorship, and/or publication of this article.
Figures


Similar articles
-
Mechanical Gains Associated With Virtual Prophylactic Intramedullary Nail Fixation in Femurs With Metastatic Disease.Iowa Orthop J. 2023 Dec;43(2):70-78. Iowa Orthop J. 2023. PMID: 38213856 Free PMC article.
-
Finite element analysis potentially identifies nonessential prophylactic stabilization in femurs with metastatic disease.Proc Inst Mech Eng H. 2022 Sep;236(9):1297-1308. doi: 10.1177/09544119221109740. Epub 2022 Jul 5. Proc Inst Mech Eng H. 2022. PMID: 35787214
-
Pathological fracture risk assessment in patients with femoral metastases using CT-based finite element methods. A retrospective clinical study.Bone. 2018 May;110:215-220. doi: 10.1016/j.bone.2018.02.011. Epub 2018 Feb 20. Bone. 2018. PMID: 29475110
-
A fatigue loading model for investigation of iatrogenic subtrochanteric fractures of the femur.Clin Biomech (Bristol). 2013 Nov-Dec;28(9-10):981-7. doi: 10.1016/j.clinbiomech.2013.09.009. Epub 2013 Sep 25. Clin Biomech (Bristol). 2013. PMID: 24125692
-
Simulated lesions representative of metastatic disease predict proximal femur failure strength more accurately than idealized lesions.J Biomech. 2020 Jun 9;106:109825. doi: 10.1016/j.jbiomech.2020.109825. Epub 2020 May 11. J Biomech. 2020. PMID: 32517984
References
-
- Sternheim A, Traub F, Trabelsi N, et al.. When and where do patients with bone metastases actually break their femurs? Bone Joint J. 2020;102-b:638-645. - PubMed
-
- Mirels H. Metastatic disease in long bones. A proposed scoring system for diagnosing impending pathologic fractures. Clin Orthop Relat Res. 1989;249:256-264. - PubMed
-
- Hipp JA, Springfield DS, Hayes WC. Predicting pathologic fracture risk in the management of metastatic bone defects. Clin Orthop Relat Res. 1995;312:120-135. - PubMed
-
- Derikx LC, van Aken JB, Janssen D, et al.. The assessment of the risk of fracture in femora with metastatic lesions: comparing case-specific finite element analyses with predictions by clinical experts. J Bone Joint Surg Br. 2012;94:1135-1142. - PubMed
LinkOut - more resources
Full Text Sources
