. 2023 Mar 20:14:1137952.
doi: 10.3389/fphar.2023.1137952. eCollection 2023.

Increased expression of glutathione peroxidase 3 prevents tendinopathy by suppressing oxidative stress

Affiliations

Increased expression of glutathione peroxidase 3 prevents tendinopathy by suppressing oxidative stress

Haruka Furuta et al. Front Pharmacol. .

Abstract

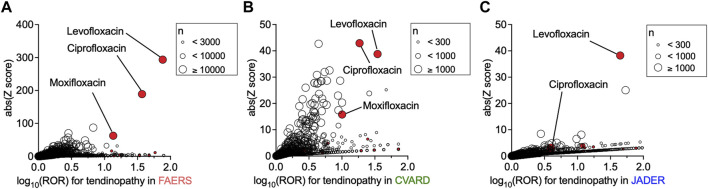
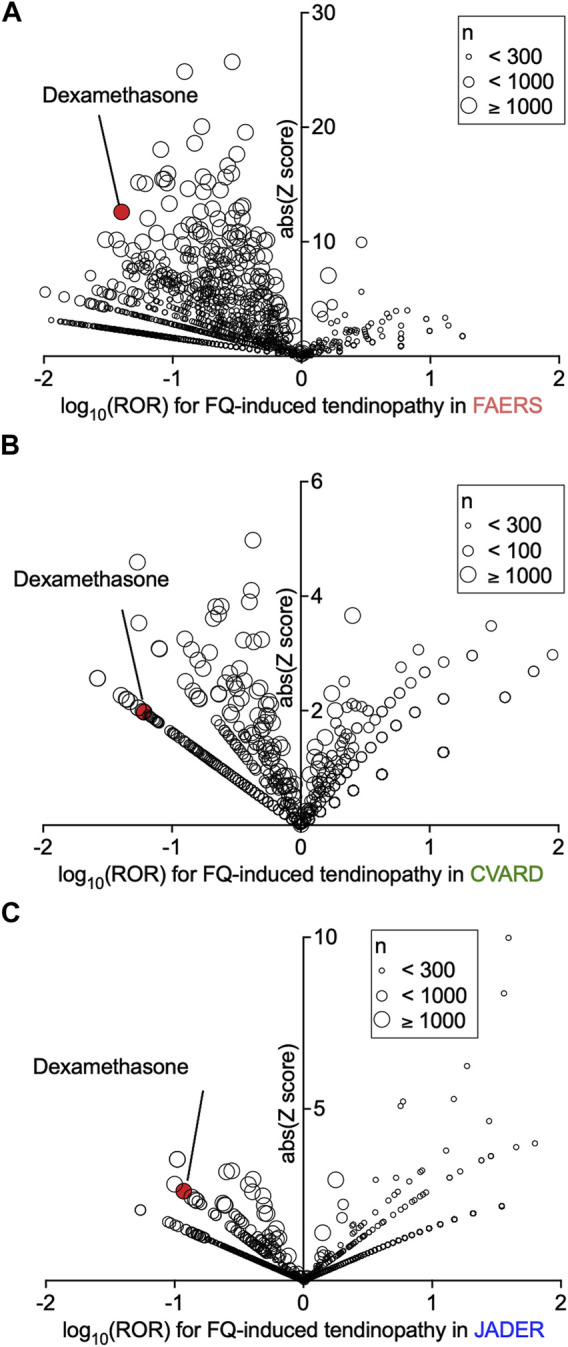
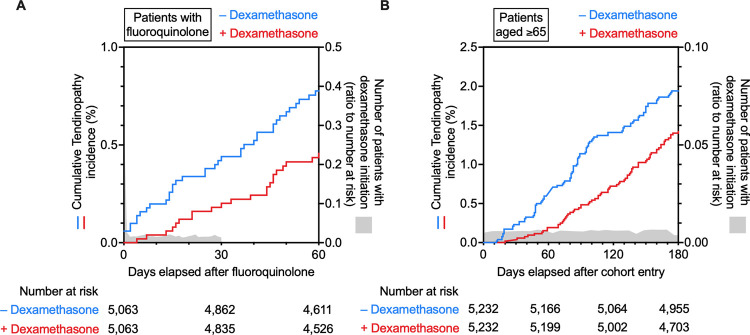
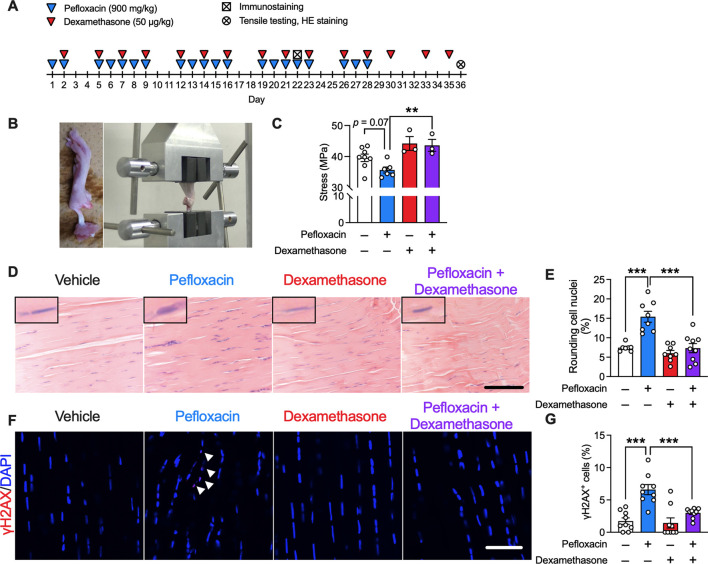
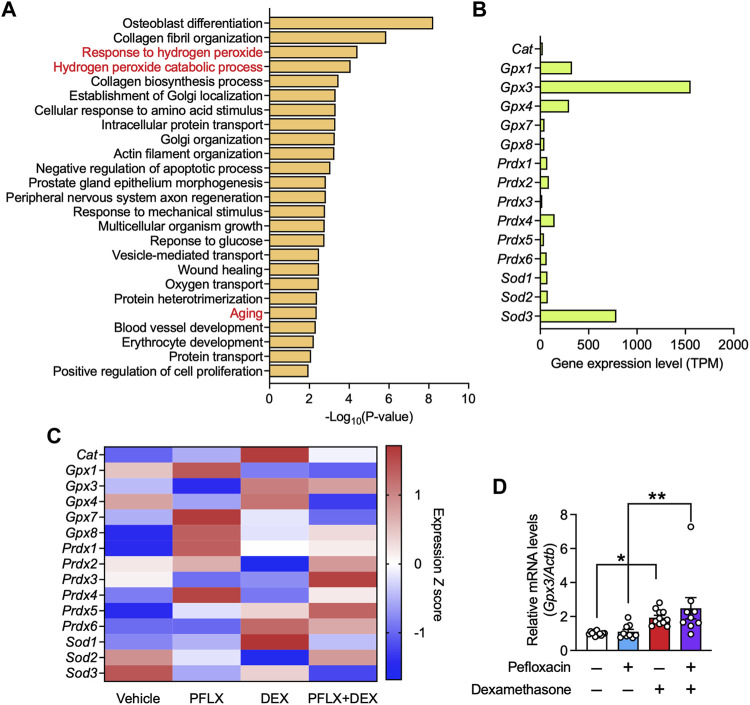
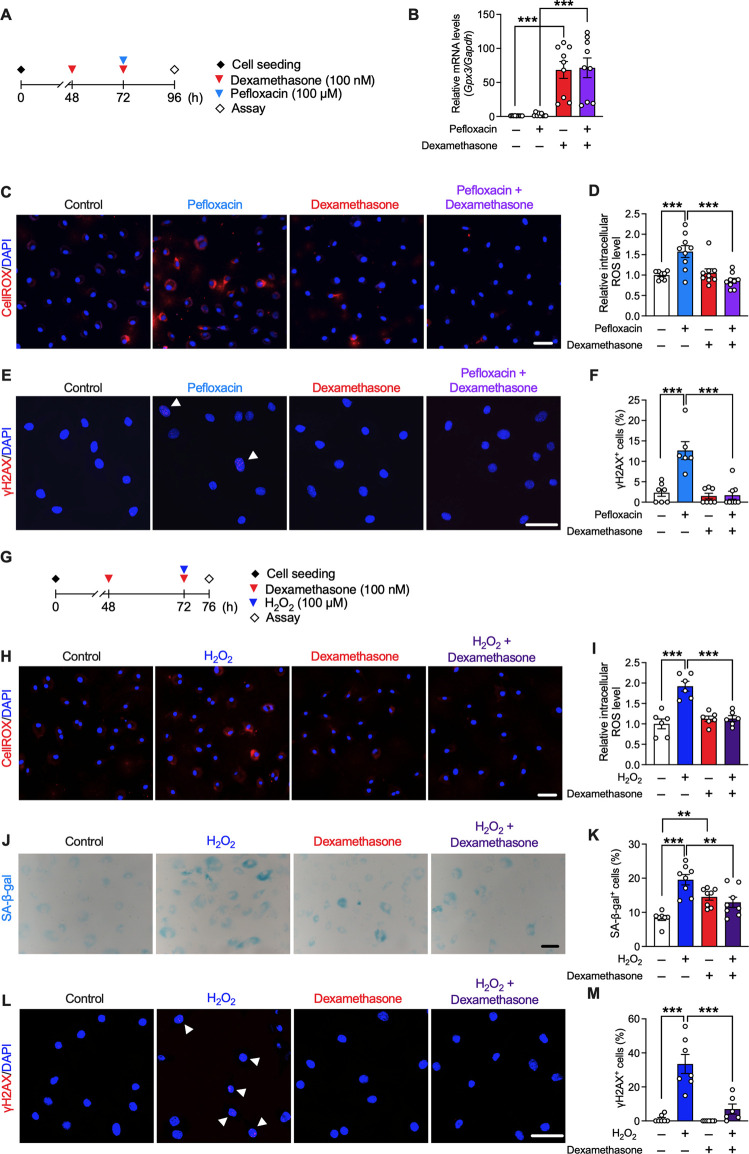
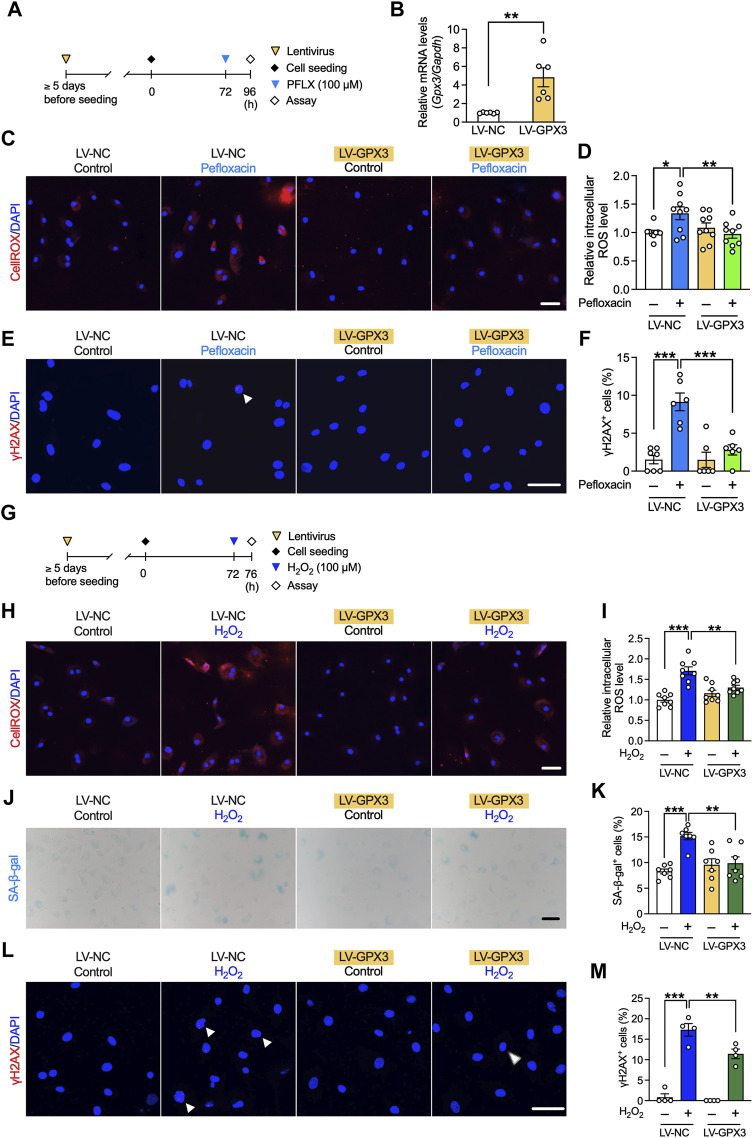
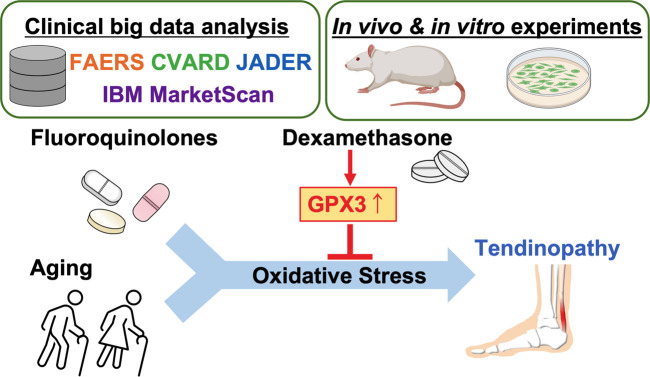
Tendinopathy, a degenerative disease, is characterized by pain, loss of tendon strength, or rupture. Previous studies have identified multiple risk factors for tendinopathy, including aging and fluoroquinolone use; however, its therapeutic target remains unclear. We analyzed self-reported adverse events and the US commercial claims data and found that the short-term use of dexamethasone prevented both fluoroquinolone-induced and age-related tendinopathy. Rat tendons treated systemically with fluoroquinolone exhibited mechanical fragility, histological change, and DNA damage; co-treatment with dexamethasone attenuated these effects and increased the expression of the antioxidant enzyme glutathione peroxidase 3 (GPX3), as revealed via RNA-sequencing. The primary role of GPX3 was validated in primary cultured rat tenocytes treated with fluoroquinolone or H2O2, which accelerates senescence, in combination with dexamethasone or viral overexpression of GPX3. These results suggest that dexamethasone prevents tendinopathy by suppressing oxidative stress through the upregulation of GPX3. This steroid-free approach for upregulation or activation of GPX3 can serve as a novel therapeutic strategy for tendinopathy.

Keywords: GPX3; aging; dexamethasone; fluoroquinolone; oxidative stress; real-world data; tendinopathy.


Conflict of interest statement

The authors declare that the research was conducted in the absence of any commercial or financial relationships that could be construed as a potential conflict of interest.

Figures

FIGURE 1
FIGURE 1
Increased incidence of tendinopathy with the prescription of drugs in patients registered in the FDA Adverse Event Reporting System (FAERS), Canada Vigilance Adverse Reaction Online Database (CVARD), and Japanese Adverse Drug Event Report (JADER). The precise equations used in the analyses, all drugs, reporting odds ratio (ROR) values, and Z scores are presented in Supplementary Data S1. Volcano plots of ROR on a log scale and statistical significance (absolute Z score) are shown. Each circle indicates an individual drug, and the size of the circle reflects the number of patients taking the drug. A strong and significant increase in the ROR of tendinopathy was observed in patients registered in FAERS (A), CVARD (B), and JADER (C) taking fluoroquinolones (red plots), such as levofloxacin, ciprofloxacin, and moxifloxacin.
FIGURE 2
FIGURE 2
Confounding effects of concomitant drugs on fluoroquinolone-induced tendinopathy in patients registered in the FDA Adverse Event Reporting System (FAERS), Canada Vigilance Adverse Reaction Online Database (CVARD), and Japanese Adverse Drug Event Report (JADER). The confounding effects of all drug combinations on the reporting odds ratio (ROR) for tendinopathy were calculated. Volcano plots visualizing the ROR (on a log scale) and its statistical significance (absolute Z score) from FAERS (A), CVARD (B), and JADER (C) are shown. The overall values are presented in Supplementary Data S2.
FIGURE 3
FIGURE 3
Time trends in the incidence of tendinopathy in the fluoroquinolone-prescribed or older adult cohort in the IBM MarketScan data. Kaplan–Meier curves for the cumulative incidence ratio of tendinopathy in patients taking fluoroquinolone (A) or patients aged ≥65 years (B) are shown individually as two populations: one without (blue) and one with (red) co-prescribed dexamethasone. The number of patients with dexamethasone initiation is shown in gray as a ratio to the number at risk.
FIGURE 4
FIGURE 4
Effects of dexamethasone on a pefloxacin-induced tendinopathy rat model. (A) Rats were treated with pefloxacin (900 mg/kg/day, 5 days a week for 4 weeks), dexamethasone (50 µg/kg/day, 3 days a week for 5 weeks), or both, and Achilles tendons were collected 1 day after completing the 3-week administration for immunostaining and 1 day after completing the 5-week administration for tensile testing and hematoxylin and eosin staining (HE staining). (B) Images of biomechanical testing. (C) Biomechanical properties were examined immediately after the collection of Achilles tendons from drug-administered rats (n = 3–8 per group). Maximum stress was calculated from test results. (D,E) Representative images of HE staining (n = 7–9 per group) with representative nuclei in the upper left of each picture; summarized data for cells with round nuclei. Scale bar: 0.1 mm. (F,G) Immunostaining of γH2AX was performed, and the samples were imaged using confocal microscopy (n = 9 per group). The number of γH2AX+ cells (shown with the arrowhead) is presented as a percentage of the number of total cells. Scale bar: 50 µm. Data are shown as mean ± SEM. Statistical significance was tested using a two-way ANOVA with post hoc multiple comparisons; **p < 0.01, ***p < 0.001.
FIGURE 5
FIGURE 5
Gene expression in the tendon tissues of rats treated with pefloxacin, dexamethasone, or both. (A) Gene ontology (GO) analysis of genes whose expression, with transcripts per million (TPM) ≥ 100 in the vehicle group, was increased in the pefloxacin group compared with that in the vehicle group and reduced in the group administered both pefloxacin and dexamethasone compared with that in the pefloxacin group. The top 25 significantly enriched GO terms are shown. (B) The relative gene expression levels, shown as TPM, of antioxidant enzymes in the Achilles tendon from a vehicle-administered rat. (C) Heatmap of gene expression of antioxidant enzymes in Achilles tendon from rats administered vehicle, pefloxacin (PFLX), dexamethasone (DEX), or both (PFLX + DEX). Red and blue colors represent large and small standardized values in Z scores, respectively. (D) The gene expression of Gpx3 was examined using quantitative RT-PCR (n = 9–12 per group) and represented as the relative ratio to the control group. Data are shown as the mean ± SEM. Statistical significance was tested using a two-way ANOVA with post hoc multiple comparisons; *p < 0.05, **p < 0.01.
FIGURE 6
FIGURE 6
Effects of dexamethasone on pefloxacin-induced toxicity and stress-induced senescence in rat primary tenocytes. (A) Primary cultured tenocytes obtained from rat Achilles tendons were treated with pefloxacin (100 µM, 24 h), dexamethasone (100 nM, 24 h pre-treatment plus 24 h co-treatment), or both. (B) The gene expression of Gpx3 after drug treatment was examined using quantitative RT-PCR (n = 9 per group) and represented as the relative ratio to the control group. (C,D) The levels of reactive oxygen species (ROS) were evaluated using the CellROX assay (n = 8–9 per group). Cells were imaged using confocal microscopy, and the intensity of fluorescence was measured in each cell. (E,F) The number of cells with three or more γH2AX+ foci was counted (shown with an arrowhead) and presented as a percentage of the total cell number. (G) Primary cultured tenocytes were treated with H2O2 (100 µM, 4 h) to create a stress-induced senescence model and co-treated with dexamethasone (100 nM, 24 h pre-treatment plus 4 h co-treatment). (H,I) The levels of ROS after drug treatment were evaluated using the CellROX assay (n = 6 per group). (J,K) Senescence-associated β-galactosidase (SA-β-gal) staining was performed after drug treatment (n = 7–8 per group). The number of SA-β-gal+ cells was counted and presented as a percentage of the total number of cells. (L,M) Immunostaining of γH2AX was performed (n = 6–7 per group). The number of cells with three or more γH2AX+ foci (shown with arrowhead) is presented as a percentage of the number of total cells. Data are shown as mean ± SEM. Statistical significance was tested using a two-way ANOVA with post hoc multiple comparisons; ** p < 0.01, ***p < 0.001. Scale bar; 50 µm.
FIGURE 7
FIGURE 7
Effects of GPX3 on pefloxacin-induced oxidative stress and hydrogen peroxide-induced senescence in rat primary tenocytes. (A) Tenocytes transduced with lentivirus for overexpressing GPX3 (LV-GPX3) or negative control (LV-NC). (B) The gene expression of Gpx3 after lentiviral induction was examined using quantitative RT-PCR (n = 6 per group) and represented as the relative ratio to the LV-NC group. (C,D) The levels of reactive oxygen species (ROS) were evaluated using the CellROX assay (n = 9 per group), and cells were imaged using confocal microscopy. The intensity of fluorescence was measured in each cell. (E,F) Tenocytes were stained with anti-γH2AX antibodies (n = 6–7 per group). The number of cells with three or more γH2AX+ foci (shown with arrowhead) is presented as a percentage of the total number of cells. (G) To create a stress-induced senescence model, tenocytes were treated with H2O2 (100 µM, 4 h). (H,I) The levels of ROS were evaluated using the CellROX assay (n = 8 per group). (J,K) SA-β-gal staining was performed (n = 7 per group); the number of SA-β-gal+ cells are presented as a percentage of the number of total cells. (L,M) Cells were stained with anti-γH2AX antibody (n = 4 per group). The number of cells with three or more γH2AX+ foci (shown with arrowhead) is presented as a percentage of the total number of cells. Data are shown as mean ± SEM. Statistical significance was tested using a two-way ANOVA with post hoc multiple comparisons; *p < 0.05, **p < 0.01, ***p < 0.001. Scale bar; 50 µm.
FIGURE 8
FIGURE 8
Graphical summary of the study. Created with BioRender.com.

Similar articles

Cited by

References

    1. Abate M., Silbernagel K. G., Siljeholm C., Di Iorio A., De Amicis D., Salini V., et al. (2009). Pathogenesis of tendinopathies: Inflammation or degeneration? Arthritis Res. Ther. 11, 235. 10.1186/ar2723 - DOI - PMC - PubMed
    1. Abraham A. C., Shah S. A., Golman M., Song L., Li X., Kurtaliaj I., et al. (2019). Targeting the NF-κB signaling pathway in chronic tendon disease. Sci. Transl. Med. 11, eaav4319. 10.1126/scitranslmed.aav4319 - DOI - PMC - PubMed
    1. Arvind V., Huang A. H. (2021). Reparative and maladaptive inflammation in tendon healing. Front. Bioeng. Biotechnol. 9, 719047. 10.3389/fbioe.2021.719047 - DOI - PMC - PubMed
    1. Banda J. M., Evans L., Vanguri R. S., Tatonetti N. P., Ryan P. B., Shah N. H. (2016). A curated and standardized adverse drug event resource to accelerate drug safety research. Sci. Data 3, 160026. 10.1038/sdata.2016.26 - DOI - PMC - PubMed
    1. Best K. T., Nichols A. E. C., Knapp E., Hammert W. C., Ketonis C., Jonason J. H., et al. (2020). NF-κB activation persists into the remodeling phase of tendon healing and promotes myofibroblast survival. Sci. Signal 13, eabb7209. 10.1126/scisignal.abb7209 - DOI - PMC - PubMed