. 2023 Mar 20:14:1118216.
doi: 10.3389/fphar.2023.1118216. eCollection 2023.

Acute effect of antiseizure drugs on background oscillations in Scn1a A1783V Dravet syndrome mouse model

Affiliations

Acute effect of antiseizure drugs on background oscillations in Scn1a A1783V Dravet syndrome mouse model

Shir Quinn et al. Front Pharmacol. .

Abstract

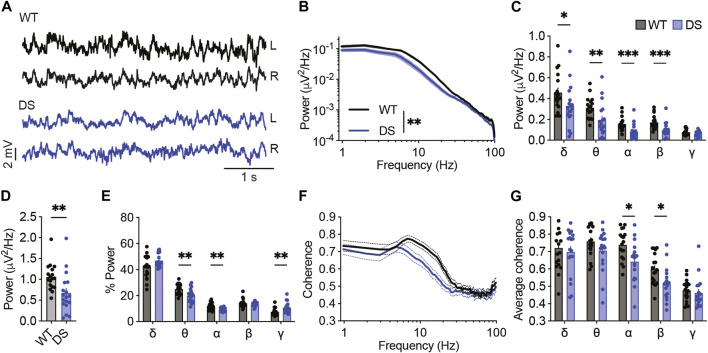
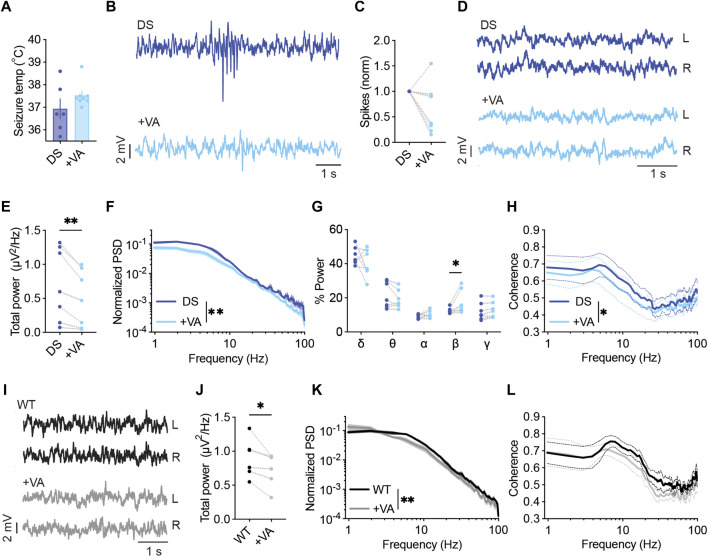
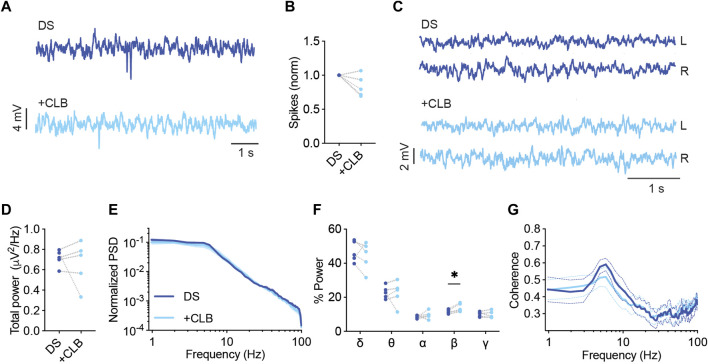
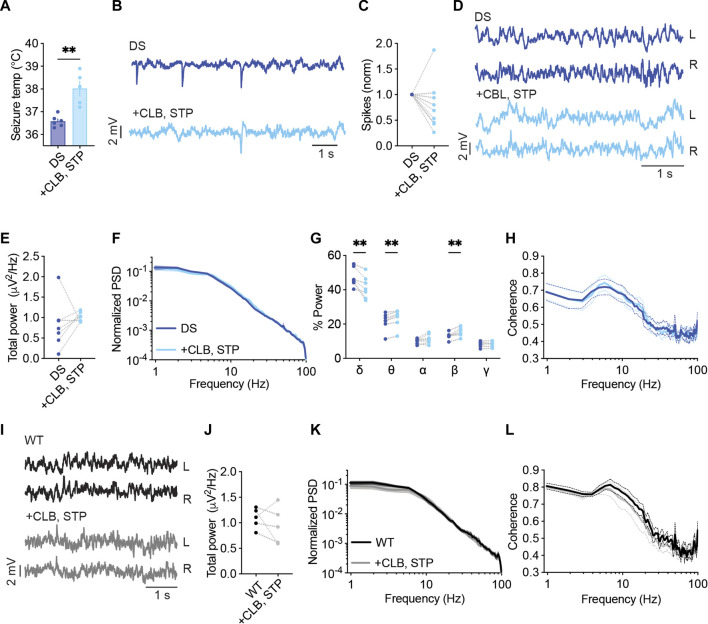
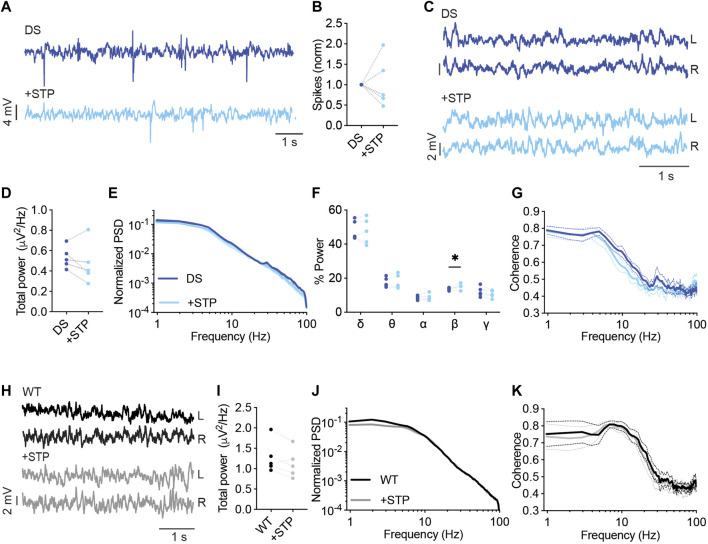
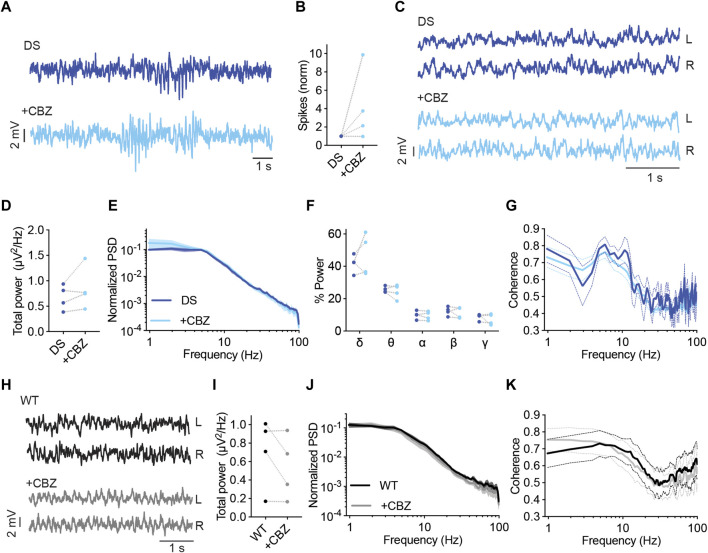
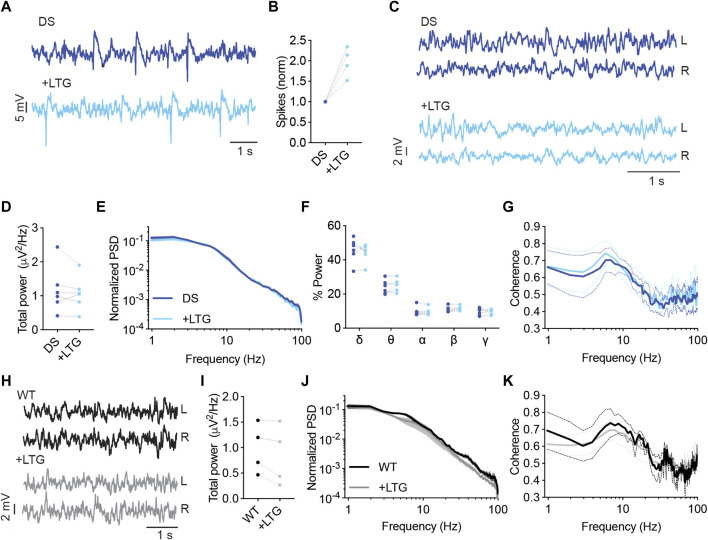
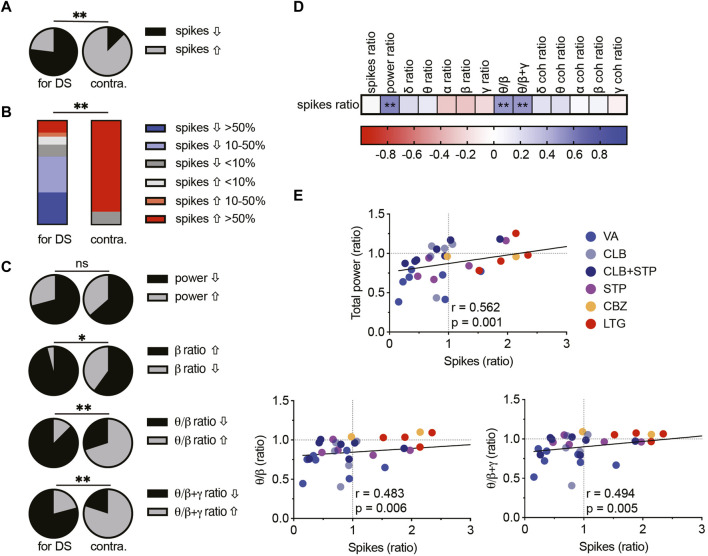
Dravet syndrome (Dravet) is a rare and severe form of developmental epileptic encephalopathy. Antiseizure medications (ASMs) for Dravet patients include valproic acid (VA) or clobazam (CLB), with or without stiripentol (STP), while sodium channel blockers like carbamazepine (CBZ) or lamotrigine (LTG) are contraindicated. In addition to their effect on epileptic phenotypes, ASMs were shown to modify the properties of background neuronal activity. Nevertheless, little is known about these background properties alterations in Dravet. Here, utilizing Dravet mice (DS, Scn1a A1783V/WT), we tested the acute effect of several ASMs on background electrocorticography (ECoG) activity and frequency of interictal spikes. Compared to wild-type mice, background ECoG activity in DS mice had lower power and reduced phase coherence, which was not corrected by any of the tested ASMs. However, acute administration of Dravet-recommended drugs, VA, CLB, or a combination of CLB + STP, caused, in most mice, a reduction in the frequency of interictal spikes, alongside an increase in the relative contribution of the beta frequency band. Conversely, CBZ and LTG increased the frequency of interictal spikes, with no effect on background spectral properties. Moreover, we uncovered a correlation between the reduction in interictal spike frequency, the drug-induced effect on the power of background activity, and a spectral shift toward higher frequency bands. Together, these data provide a comprehensive analysis of the effect of selected ASMs on the properties of background neuronal oscillations, and highlight a possible correlation between their effect on epilepsy and background activity.

Keywords: Dravet syndrome; antiseizure; background oscillations; mouse model; spectral modulation.


Conflict of interest statement

The authors declare that the research was conducted in the absence of any commercial or financial relationships that could be construed as a potential conflict of interest.

Figures

FIGURE 1
FIGURE 1
Reduced power of background activity and interhemispheric coherence in DS mice. (A) Representative traces of background ECoGs in WT and DS mice. (B) ECoG power density profiles. (C) Total power for the following frequency bands: δ, 0.9–3.9 Hz; θ, 4.8–7.8 Hz; α, 8.7–11.7 Hz; β, 12.6–29.2 Hz; γ, 30.2–99.6 Hz. (D) Total power. (E) The relative power (%) of each frequency band. (F) Interhemispheric coherence plotted over the 1–100 Hz spectrum. (G) The mean interhemispheric coherence for each frequency band. WT, n = 18; DS, n = 18. *p < 0.05, **p < 0.01, ***p < 0.001.
FIGURE 2
FIGURE 2
VA modulates the power and spectral properties of background ECoG. (A) Thermally induced seizures in mice treated with vehicle or VA (300 mg/kg). DS mice injected with saline as the vehicle, n =6; DS mice injected with VA, n = 8. (B) Representative traces of ECoGs from DS mice depicting epileptic activity before and after VA administration. (C) The change in interictal spike frequency. (D) Representative traces of background activity. (E) The effect of VA on total power. (F) ECoG power density profiles normalized to the total power prior to VA administration. (G) Relative power in each frequency band, before and after VA. (H) Interhemispheric coherence plotted over the 1–100 Hz spectrum. DS, n = 7. (I) Representative traces of background ECoGs from WT mice before and after VA administration. (J) The effect of VA on total power. (K) ECoG power density profiles normalized to the total power prior to drug administration. (L) Interhemispheric coherence plotted over the 1–100 Hz spectrum. WT, n = 5. *p < 0.05, **p < 0.01.
FIGURE 3
FIGURE 3
CLB treatment modulates the spectral properties of background ECoG in DS mice. (A) Representative traces of epileptic activity before and after acute administration of CLB (10 mg/kg) (B). The change in the frequency of interictal spikes. (C) Representative examples of background activity. (D) The effect on total power. (E) ECoG power density profiles normalized to the total power prior to drug administration. (F) The relative power in each frequency band. (G) Interhemispheric coherence plotted over the 1–100 Hz spectrum. DS, n = 5. * p < 0.05.
FIGURE 4
FIGURE 4
CLB + STP treatment modulates the spectral properties of background ECoG in DS mice. (A) CLB + STP (5,100 mg/kg, respectively) protected against hyperthermia-induced seizures in DS mice. DS mice injected with sesame oil as vehicle, n = 6; DS mice injected with CLB + STP, n = 5. (B) Representative traces of epileptic activity before and after acute administration of CLB + STP. (C) The change in the frequency of interictal spikes. (D) Representative examples of background activity. (E) The effect on total power. (F) ECoG power density profiles normalized to the total power prior to drug administration. (G) The relative power in each frequency band. (H) Interhemispheric coherence plotted over the 1–100 Hz spectrum. DS, n = 7. (I) Representative traces of background ECoG from WT mice before and after drug administration. (J) The effect of CLB + STP on total power. (K) ECoG power density profiles normalized to the power prior to drug administration. (L) Interhemispheric coherence plotted over the 1–100 Hz spectrum. WT, n = 5. ** p < 0.01.
FIGURE 5
FIGURE 5
Analysis of background EcoG activity in response to STP administration. (A) Representative traces of epileptic activity in DS mice prior to and post, acute administration of STP (150 mg/kg). (B) The effect of STP on interictal spike frequency. (C) Representative traces of background ECoG in DS mice before and after STP administration. (D) The effect on total power. (E) ECoG power density profiles normalized to the absolute total power prior to drug administration. (F) The relative power in each frequency band. (G) Interhemispheric coherence plotted over the 1–100 Hz spectrum. DS, n = 5. (H) Representative traces of background ECoG from WT mice, before and after drug administration. (I) The effect of STP on total power. (J) ECoG power density profiles normalized to the absolute power prior to drug administration. (K) Interhemispheric coherence plotted over the 1–100 Hz spectrum. WT, n = 5. * p < 0.05.
FIGURE 6
FIGURE 6
CBZ increased the frequency of interictal spikes in most DS mice. (A) Representative traces of epileptic activity in DS mice before and after acute administration of CBZ (20 mg/kg). (B) The effect of CBZ on interictal spike frequency. (C) Representative traces of background ECoG in DS mice before and after treatment with CBZ. (D) The effect on total power. (E) ECoG power density profiles normalized to the absolute total power prior to drug administration. (F) The relative power in each frequency band. (G) Interhemispheric coherence plotted over the 1–100 Hz spectrum. DS, n = 4. (H) Representative traces of background ECoG from WT mice, before and after administration of CBZ. (I) The effect of CBZ on total power. (J) ECoG power density profiles normalized to the absolute power prior to drug administration. (K) Interhemispheric coherence plotted over the 1–100 Hz spectrum. WT, n = 4.
FIGURE 7
FIGURE 7
LTG increased the frequency of interictal spikes in DS mice. (A) Representative traces of epileptic activity in DS mice before and after acute administration of LTG (10 mg/kg). (B) The effect of LTG on interictal spike frequency. (C) Representative traces of background ECoG in DS mice before and after treatment with LTG. (D) The effect on total power. (E) ECoG power density profiles normalized to the absolute total power prior to drug administration. (F) The relative power in each frequency band. (G) Interhemispheric coherence plotted over the 1–100 Hz spectrum. DS, n =6. (H) Representative traces of background ECoG from WT mice, before and after administration of LTG. (I) The effect of LTG on total power. (J) ECoG power density profiles normalized to the absolute power prior to drug administration. (K) Interhemispheric coherence plotted over the 1–100 Hz spectrum. WT, n = 4.
FIGURE 8
FIGURE 8
Correlations between spike frequency and spectral parameters in DS mice. (A) The proportion of mice with increased or decreased spike frequency among prescribed (left, VA, CLB, CLB + STP, STP) and contraindicated (right, CBZ, LTG) ASMs in DS mice. (B) Percentages of mice and their change in spike frequency following treatment with prescribed (left) and contraindicated (right) ASMs. (C) The proportion of DS mice, treated with prescribed (left) and contraindicated (right) ASMs with increased or decreased total power, beta contribution, theta/beta relative power ratios, or theta/(beta + gamma) ratios. (D) Correlation matrix (Spearman correlation) between the change in the frequency of interictal spikes, background spectral parameters, and the coherence (coh). The change was calculated as the ratio between a specific parameter after ASM administration divided by the same parameter before ASMs. Full correlation analysis is presented in Supplementary Fig. 5. A full description of the correlation coefficients and statistical significance are presented in Supplementary Table 1. (E) Correlations between the change in spike frequency and the total power (top), the theta/beta ratio (bottom, left), and the theta/(beta + gamma) ratio (bottom, right). The text indicates the Spearman correlation coefficient and statistical significance. The solid black line depicts the fit. * p < 0.05, ** p < 0.01.

Similar articles

Cited by

References

    1. Almog Y., Fadila S., Brusel M., Mavashov A., Anderson K., Rubinstein M. (2021). Developmental alterations in firing properties of hippocampal CA1 inhibitory and excitatory neurons in a mouse model of Dravet syndrome. Neurobiol. Dis. 148, 105209. 10.1016/j.nbd.2020.105209 - DOI - PubMed
    1. Ambrósio A. F., Soares-da-Silva P., Carvalho C. M., Carvalho A. P. (2002). Mechanisms of action of carbamazepine and its derivatives, oxcarbazepine, BIA 2-093, and BIA 2-024. Neurochem. Res. 27, 121–130. 10.1023/A:1014814924965 - DOI - PubMed
    1. Armstrong C., Zavez A., Mulcahey P. J., Sogawa Y., Gotoff J. M., Hagopian S., et al. (2022). Quantitative electroencephalographic analysis as a potential biomarker of response to treatment with cannabidiol. Epilepsy Res. 185, 106996. 10.1016/J.EPLEPSYRES.2022.106996 - DOI - PubMed
    1. Avoli M., Biagini G., de Curtis M. (2006). Do interictal spikes sustain seizures and epileptogenesis? Epilepsy Curr. 6, 203–207. 10.1111/J.1535-7511.2006.00146.X - DOI - PMC - PubMed
    1. Barger Z., Frye C. G., Liu D., Dan Y., Bouchard K. E. (2019). Robust, automated sleep scoring by a compact neural network with distributional shift correction. PLoS One 14, e0224642. 10.1371/JOURNAL.PONE.0224642 - DOI - PMC - PubMed

LinkOut - more resources