

A novel 7-chemokine-genes predictive signature for prognosis and therapeutic response in renal clear cell carcinoma
- PMID: 37021054
- PMCID: PMC10067584
- DOI: 10.3389/fphar.2023.1120562
A novel 7-chemokine-genes predictive signature for prognosis and therapeutic response in renal clear cell carcinoma
Abstract
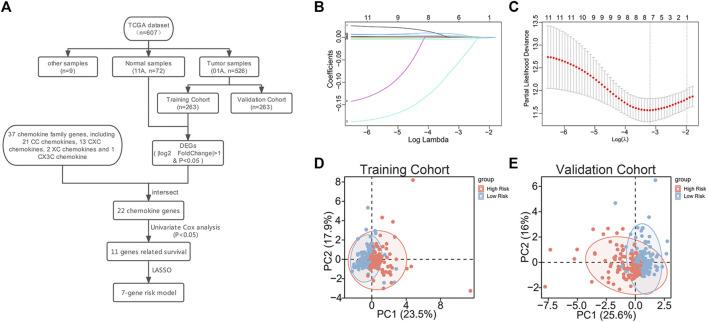
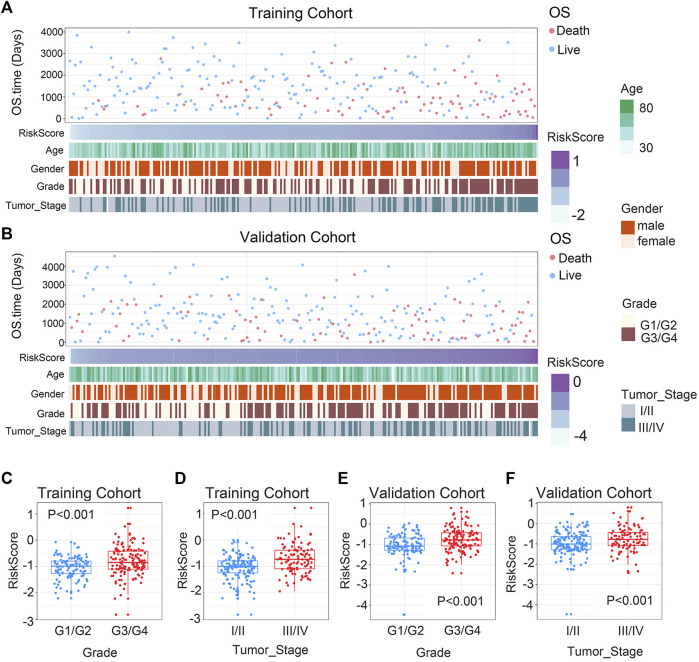
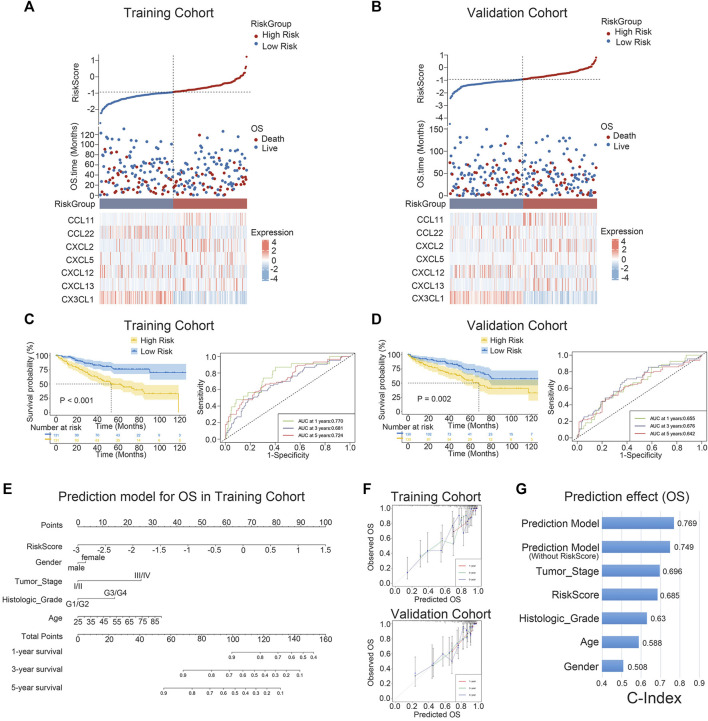
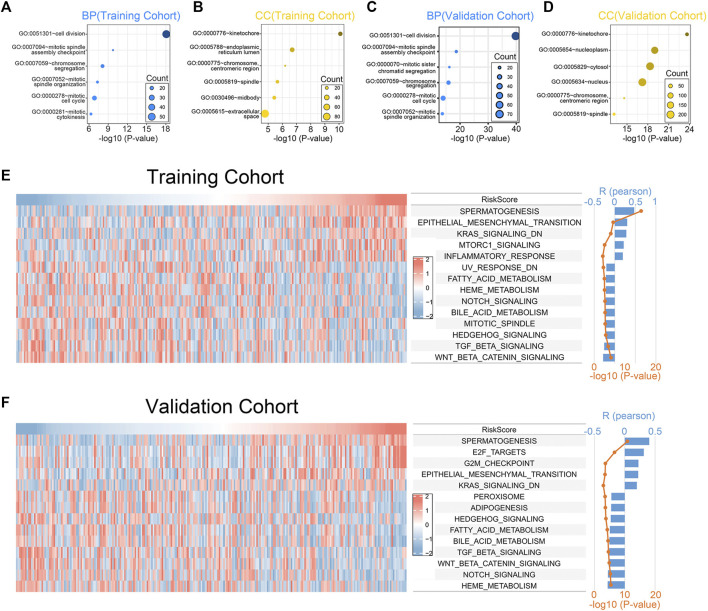
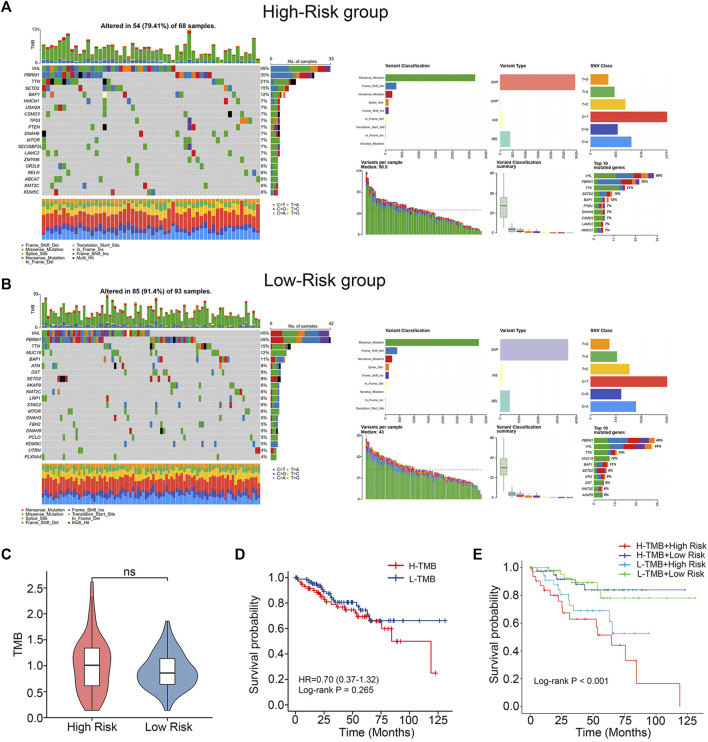
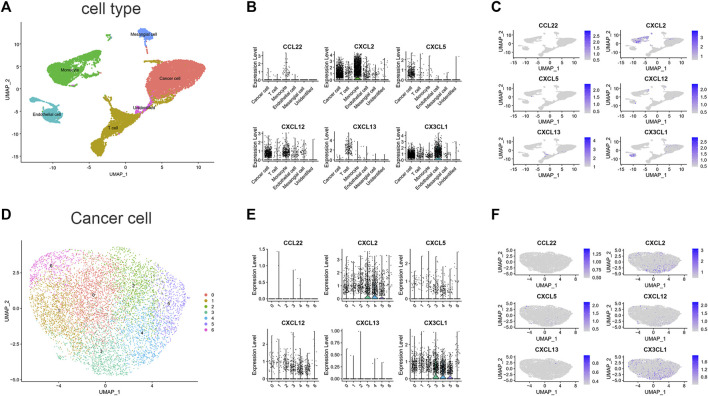
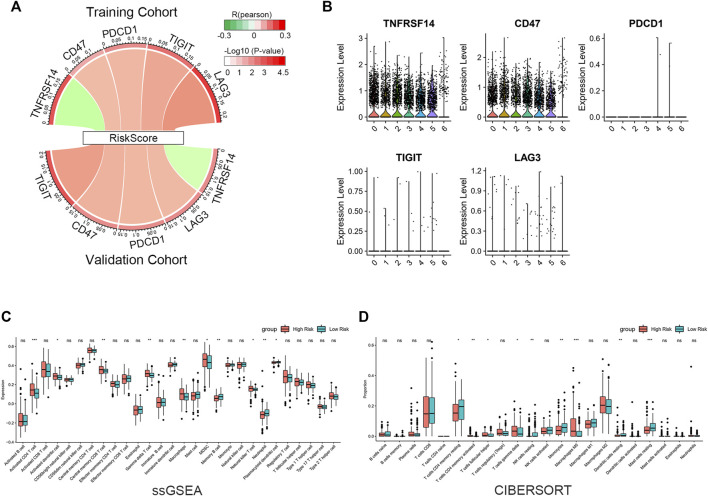
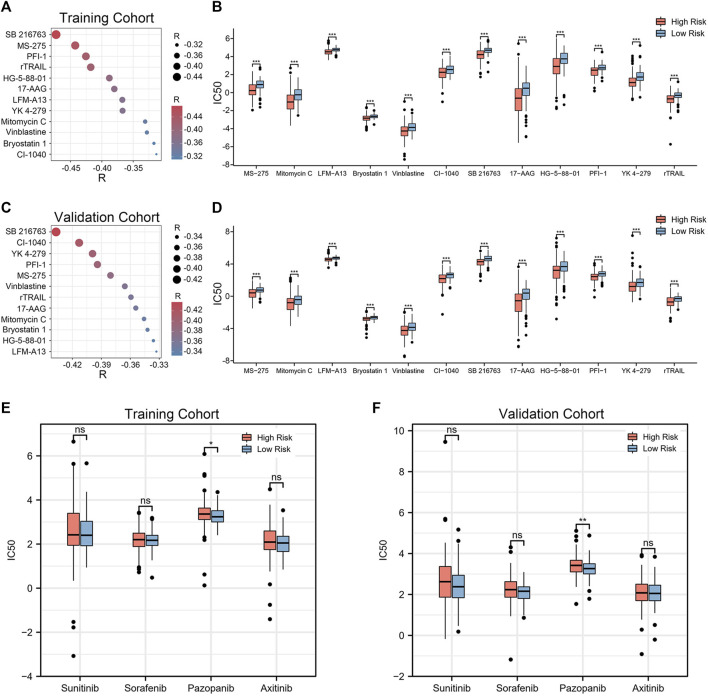
Background: Renal clear cell carcinoma (ccRCC) is one of the most prevailing type of malignancies, which is affected by chemokines. Chemokines can form a local network to regulate the movement of immune cells and are essential for tumor proliferation and metastasis as well as for the interaction between tumor cells and mesenchymal cells. Establishing a chemokine genes signature to assess prognosis and therapy responsiveness in ccRCC is the goal of this effort. Methods: mRNA sequencing data and clinicopathological data on 526 individuals with ccRCC were gathered from the The Cancer Genome Atlas database for this investigation (263 training group samples and 263 validation group samples). Utilizing the LASSO algorithm in conjunction with univariate Cox analysis, the gene signature was constructed. The Gene Expression Omnibus (GEO) database provided the single cell RNA sequencing (scRNA-seq) data, and the R package "Seurat" was applied to analyze the scRNA-seq data. In addition, the enrichment scores of 28 immune cells in the tumor microenvironment (TME) were calculated using the "ssGSEA" algorithm. In order to develop possible medications for patients with high-risk ccRCC, the "pRRophetic" package is employed. Results: High-risk patients had lower overall survival in this model for predicting prognosis, which was supported by the validation cohort. In both cohorts, it served as an independent prognostic factor. Annotation of the predicted signature's biological function revealed that it was correlated with immune-related pathways, and the riskscore was positively correlated with immune cell infiltration and several immune checkpoints (ICs), including CD47, PDCD1, TIGIT, and LAG-3, while it was negatively correlated with TNFRSF14. The CXCL2, CXCL12, and CX3CL1 genes of this signature were shown to be significantly expressed in monocytes and cancer cells, according to scRNA-seq analysis. Furthermore, the high expression of CD47 in cancer cells suggested us that this could be a promising immune checkpoint. For patients who had high riskscore, we predicted 12 potential medications. Conclusion: Overall, our findings show that a putative 7-chemokine-gene signature might predict a patient's prognosis for ccRCC and reflect the disease's complicated immunological environment. Additionally, it offers suggestions on how to treat ccRCC using precision treatment and focused risk assessment.
Keywords: chemokine; gene signature; immunotherapy; renal clear cell carcinoma; tumor microenvironment.
Copyright © 2023 Lin, Tang, Yao, Tan, Dai, Wang, Zhu, Xu, Mumin, Liang, Wang, Deng, Luo, Wei and Cao.
Conflict of interest statement
The authors declare that the research was conducted in the absence of any commercial or financial relationships that could be construed as a potential conflict of interest.
Figures
Similar articles
-
RETRACTED: Exploring the tumor microenvironment: Chemokine-related genes and immunotherapy/chemotherapy response in clear-cell renal cell carcinoma.Environ Toxicol. 2025 Jun;40(6):E74-E91. doi: 10.1002/tox.24190. Epub 2024 Mar 15. Environ Toxicol. 2025. Retraction in: Environ Toxicol. 2025 Mar;40(3):500. doi: 10.1002/tox.24455. PMID: 38488671 Retracted.
-
Computational construction of TME-related lncRNAs signature for predicting prognosis and immunotherapy response in clear cell renal cell carcinoma.J Clin Lab Anal. 2022 Aug;36(8):e24582. doi: 10.1002/jcla.24582. Epub 2022 Jul 8. J Clin Lab Anal. 2022. PMID: 35808868 Free PMC article.
-
Integrated analysis of single-cell and bulk transcriptome identifies a signature based on NK cell marker genes to predict prognosis and therapeutic response in clear cell renal cell carcinoma.Transl Cancer Res. 2023 May 31;12(5):1270-1289. doi: 10.21037/tcr-22-2782. Epub 2023 Apr 12. Transl Cancer Res. 2023. PMID: 37304554 Free PMC article.
-
A new CCCH-type zinc finger-related lncRNA signature predicts the prognosis of clear cell renal cell carcinoma patients.Front Genet. 2022 Sep 30;13:1034567. doi: 10.3389/fgene.2022.1034567. eCollection 2022. Front Genet. 2022. PMID: 36246657 Free PMC article.
-
Recent Advances in Single-Cell RNA-Sequencing of Primary and Metastatic Clear Cell Renal Cell Carcinoma.Cancers (Basel). 2023 Sep 26;15(19):4734. doi: 10.3390/cancers15194734. Cancers (Basel). 2023. PMID: 37835428 Free PMC article. Review.
Cited by
-
Deciphering the tumour microenvironment of clear cell renal cell carcinoma: Prognostic insights from programmed death genes using machine learning.J Cell Mol Med. 2024 Jul;28(13):e18524. doi: 10.1111/jcmm.18524. J Cell Mol Med. 2024. PMID: 39011666 Free PMC article.
References
-
- Dai S., Zeng H., Liu Z., Jin K., Jiang W., Wang Z., et al. (2021). Intratumoral CXCL13 + CD8 + T cell infiltration determines poor clinical outcomes and immunoevasive contexture in patients with clear cell renal cell carcinoma. J. Immunother. Cancer 9, e001823. 10.1136/jitc-2020-001823 - DOI - PMC - PubMed
LinkOut - more resources
Full Text Sources
Research Materials
Miscellaneous