. 2023 Apr 2;13(4):e9943.
doi: 10.1002/ece3.9943. eCollection 2023 Apr.

First insight into the phylogeny of fine-leaved Festuca in the Altai Mountain Country based on genome-wide genotyping

Affiliations

First insight into the phylogeny of fine-leaved Festuca in the Altai Mountain Country based on genome-wide genotyping

Elizaveta A Kriuchkova et al. Ecol Evol. .

Abstract

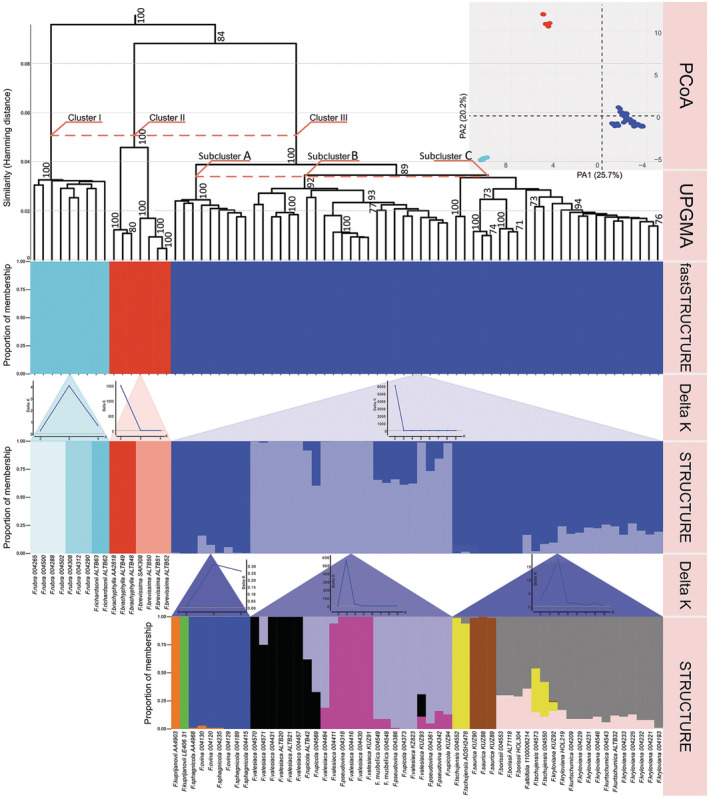
Festuca is one of the largest genera within the Poaceae family. Molecular phylogenies demonstrate that Festuca s.l. comprises two groups: broad- and fine-leaved species. The latter is the species-richest and taxonomically complicated group due to being paraphyletic. Here, we provide the first insight into the phylogeny of 17 fine-leaved species of Altai fescues. Based on genome-wide genotyping, the examined taxa were divided into three markedly differentiated clusters. The first cluster comprises species from the F. rubra complex, the second cluster includes the F. brachyphylla complex, and the third cluster contains taxa from the groups F. ovina, F. valesiaca, and F. kryloviana. Importantly, we detected a complex genetic pattern within the groups of F. valesiaca and F. kryloviana. Moreover, our findings underline a discrepancy between morphological and molecular data for some species distributed within the Altai Mountain Country. We suggest that in order to validate the current findings on the fine-leaved fescues, additional comprehensive research including morphological, karyological, and molecular methods is required. Nonetheless, our work provides a baseline for further investigations on the genus and studies on the floral diversity of Asia.

Keywords: Altai Mountain Country; DArTseq; distribution; fescues; hybridization; phylogeny.


Conflict of interest statement

None declared.

Figures

FIGURE 1
FIGURE 1
UPGMA tree reconstructed based on 1997 SNPs. Only bootstrap values > 70% obtained from 1000 replicates are shown. The y‐axes show the Hamming Distance, proportions of membership inferred with fastSTRUCTURE and STRUCTURE, and values of delta K obtained by Structure Harvester. The x‐axis for delta K represents numbers of Clusters used in STRUCTURE. Percentages in the PCoA labels represent the explained variation across the axes.
FIGURE 2
FIGURE 2
Molecular analyses of the Cluster I based on 4460 SNPs. (a) UPGMA tree. Only bootstrap values > 70% obtained from 1000 replicates are shown. The y‐axis shows the Hamming Distance. (b) Proportions of membership inferred with STRUCTURE for the best supported model K = 3. (c) PCoA, the first two principal coordinate axes. Percentages in the labels represent the explained variation across the axes. (d) PCoA, the first three principal coordinate axes. (e) The distribution map of the analyzed specimens.
FIGURE 3
FIGURE 3
Molecular analyses of the Cluster II based on 2355 SNPs. (a) UPGMA tree. Only bootstrap values > 70% obtained from 1000 replicates are shown. The y‐axis shows the Hamming Distance. (b) Proportions of membership inferred with STRUCTURE for the best supported model K = 2. (c) PCoA, the first two principal coordinate axes. Percentages in the labels represent the explained variation across the axes. (d) PCoA, the first three principal coordinate axes. (e) The distribution map of the analyzed specimens.
FIGURE 4
FIGURE 4
Molecular analyses of the Cluster III based on 2116 SNPs. (a) Proportions of membership inferred with STRUCTURE for the best supported model K = 2. (b) UPGMA tree. Only bootstrap values > 70% obtained from 1000 replicates are shown. The y‐axis shows the Hamming Distance. (c) PCoA, the first two principal coordinate axes. Percentages in the labels represent the explained variation across the axes. The pie charts represent the proportions of membership established by STRUCTURE for the best K = 2.
FIGURE 5
FIGURE 5
Molecular analyses of the Subcluster A based on 2118 SNPs. (a) UPGMA tree. Only bootstrap values > 70% obtained from 1000 replicates are shown. The y‐axis shows the Hamming Distance. (b) Proportions of membership inferred with STRUCTURE for the best supported model K = 3. (c) PCoA, the first two principal coordinate axes. Percentages in the labels represent the explained variation across the axes. The pie charts represent the proportions of membership established by STRUCTURE for the best K = 3. (d) PCoA, the first three principal coordinate axes. (e) The distribution map of the analyzed specimens.
FIGURE 6
FIGURE 6
Molecular analyses of the Subclaster B based on 5417 SNPs. (a) Proportions of membership inferred with STRUCTURE for the best supported model K = 3. (b) UPGMA tree. Only bootstrap values > 70% obtained from 1000 replicates are shown. The y‐axis shows the Hamming Distance. (c) PCoA, the first two principal coordinate axes. Percentages in the labels represent the explained variation across the axes. The pie charts represent the proportions of membership established by STRUCTURE for the best K = 3. (d) PCoA, the first three principal coordinate axes. (e) The distribution map of the analyzed specimens.
FIGURE 7
FIGURE 7
Molecular analyses of theSubcluster C based on 3516 SNPs. (a) Proportions of membership inferred with STRUCTURE for the best‐supported model K = 4. (b) UPGMA tree. Only bootstrap values > 70% obtained from 1000 replicates are shown. The y‐axis shows the Hamming Distance. (c) PCoA, the first two principal coordinate axes. Percentages in the labels represent the explained variation across the axes. The pie charts represent the proportions of membership established by STRUCTURE for the best K = 4. (d) PCoA, the first three principal coordinate axes. (e) The distribution map of the analyzed specimens.

Similar articles

Cited by

References

    1. Alexeev, E. B. (1976). New species of fescues (Festuca L.). Novosti Sistematiki Vysshikh Rastenii. Moscow, Leningrad, 13, 20–32.
    1. Alexeev, E. B. (1980). Ovsyanici Kavkaza. Izdatelstvo Moskovskogo Universiteta.
    1. Alexeev, E. B. (1984). On the new taxa and typification of some taxa of the genus Festuca (Poaceae) from South America. Botanicheskii Zhurnal, 69(3), 346–353.
    1. Alexeev, E. B. (1990). Festuca L. In Malyshev L. I. & Peschkova G. A. (Eds.), Flora Sibiriae Poaceae (Gramineae) (pp. 130–162). Nauka. Divisio Sibirica.
    1. Alexeev, E. B. , Sokolovskaya, A. P. , & Probatova, N. S. (1988). Taxonomy, distribution and chromosome numbers in Festuca L. (Gramineae) of the flora of USSR. 3. Section Festuca: F. tschujensis–F. beckeri. Bulleten Moskovskogo Obshchestva Ispytatelei Prirody . Otdel Biologicheskii, 93, 90–99.

LinkOut - more resources