. 2023 Mar 20:17:1130892.
doi: 10.3389/fnins.2023.1130892. eCollection 2023.

Spatial-dependent suppressive aftereffect produced by a sound in the rat's inferior colliculus is partially dependent on local inhibition

Affiliations

Spatial-dependent suppressive aftereffect produced by a sound in the rat's inferior colliculus is partially dependent on local inhibition

Syed Anam Asim et al. Front Neurosci. .

Abstract

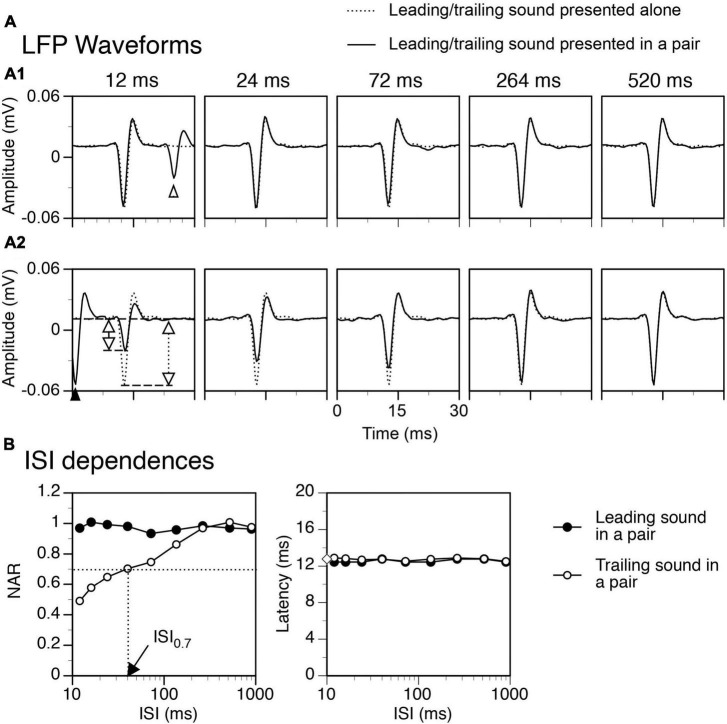
In a natural acoustic environment, a preceding sound can suppress the perception of a succeeding sound which can lead to auditory phenomena such as forward masking and the precedence effect. The degree of suppression is dependent on the relationship between the sounds in sound quality, timing, and location. Correlates of such phenomena exist in sound-elicited activities of neurons in hearing-related brain structures. The present study recorded responses to pairs of leading-trailing sounds from ensembles of neurons in the rat's inferior colliculus. Results indicated that a leading sound produced a suppressive aftereffect on the response to a trailing sound when the two sounds were colocalized at the ear contralateral to the site of recording (i.e., the ear that drives excitatory inputs to the inferior colliculus). The degree of suppression was reduced when the time gap between the two sounds was increased or when the leading sound was relocated to an azimuth at or close to the ipsilateral ear. Local blockage of the type-A γ-aminobutyric acid receptor partially reduced the suppressive aftereffect when a leading sound was at the contralateral ear but not at the ipsilateral ear. Local blockage of the glycine receptor partially reduced the suppressive aftereffect regardless of the location of the leading sound. Results suggest that a sound-elicited suppressive aftereffect in the inferior colliculus is partly dependent on local interaction between excitatory and inhibitory inputs which likely involves those from brainstem structures such as the superior paraolivary nucleus. These results are important for understanding neural mechanisms underlying hearing in a multiple-sound environment.

Keywords: GABAergic inhibition; binaural hearing; forward masking; free-field stimulation; glycinergic inhibition; inferior colliculus; sound location; suppressive aftereffect.


Conflict of interest statement

The authors declare that the research was conducted in the absence of any commercial or financial relationships that could be construed as a potential conflict of interest.

Figures

FIGURE 1
FIGURE 1
Speaker locations and a train of paired leading-trailing sounds. (A) Five azimuthal locations (c90°, c45°, 0°, i45°, and i90°) used in sound presentations. A pair of leading-trailing tone bursts were either colocalized at c90° (left panel) or separated with a leading sound being at a non-c90° azimuth while a trailing sound being at c90° (right panel for a leading sound at c45°). Two speakers used in the study were calibrated at these azimuths. (B) A train of leading-trailing tone-burst pairs. In panels (A,B), a leading sound or a speaker that was used to present a leading sound is indicated by a black color. A trailing sound or a speaker that was used to present a trailing sound is indicated by a white color. A speaker that was used to present both a leading and a trailing sound (colocalized at c90°) is indicated by a gray color.
FIGURE 2
FIGURE 2
An example showing that a temporal separation between a leading and a trailing tone burst reduced the suppressive aftereffect produced by the leading sound. Results were obtained when the two sounds were colocalized at c90°. (A) Waveforms of local-field potentials (LFPs) elicited by a leading sound [solid lines in (A1)] and a trailing sound [solid lines in (A2)] in a leading-trailing sound pair. The waveforms shown in two corresponding panels in (A1) and (A2) were obtained at the same inter-stimulus interval (ISI) [indicated above a panel in (A1)]. The start of the x axis (0 ms) corresponds to the onset of a leading sound in each panel of (A1) and the onset of a trailing sound in each panel of (A2). A part of the LFP elicited by a trailing sound is shown in the left panel of (A1) (pointed by an open upward triangle), while a part of the LFP elicited by a leading sound is shown in the left panel of (A2) (pointed by a filled upward triangle). LFPs elicited by the leading and the trailing sound when they were presented individually are shown in (A1) and (A2) (dotted lines) for comparison. In the left panel of (A2), two vertical double arrows indicate amplitudes of the negative peak of LFP elicited by a trailing sound presented individually (dotted) and in a sound pair (solid). (B) Dependences of normalized amplitude of response (NAR, left panel) and latency (right panel) on the ISI for LFPs elicited by a leading (filled circle) and a trailing (open circle) sound. In the left panel, a horizontal dotted line indicates the level of NAR at 0.7. The vertical dotted line indicates the ISI associated with the 0.7 NAR. In the right panel, an open diamond on the Y-axis indicates the latency of the response to a trailing sound presented alone. The characteristic frequency (CF) of the recording site (hence the frequency of the trailing sound) was 13.0 kHz. The frequency of the leading sound was 13.458 kHz.
FIGURE 3
FIGURE 3
Group results showing that temporal separation between a leading and a trailing tone burst reduced the suppression of the response to a trailing sound but did not affect the response to a leading sound. Results were obtained when leading and trailing sounds were colocalized at c90°. (A,B) Show effects of separation on normalized amplitude of responses (NARs) and latencies of local-field potentials (LFPs), respectively. Latencies of LFPs elicited by a leading and a trailing sound when they were presented alone at c90° are shown on the right of panel (B). An error bar indicates a standard error of the mean.
FIGURE 4
FIGURE 4
An example showing effects of spatial separation between a leading and a trailing tone burst on the local-field potentials (LFPs) elicited by the sounds. The time interval between leading and trailing tone bursts was 24 ms. (A) Waveforms of LFPs elicited by leading and trailing tone bursts. Results were obtained when a leading tone burst was at c90°, c45°, 0°, i45°, and i90° (indicated above each panel) while a trailing tone burst was at a fixed location at c90°. The start of the x axis (0 ms) corresponds to the onset of a leading sound in each panel of (A). Filled and open upward triangles indicate LFPs elicited by the leading and the trailing sound, respectively. Waveforms of LFPs elicited by the leading and the trailing tone burst presented alone at c90° are shown in each panel for comparison. (B) Line charts showing effects of spatial separation between leading and trailing sounds on normalized amplitude of responses (NARs) (left panel) and latencies (right panel) of LFPs elicited by the sounds. Filled downward and open upward triangles on the y-axis of the right panel indicate the latencies of the responses elicited by a leading and a trailing sound alone at c90°, respectively. The characteristic frequency (CF) of the recording site (hence the frequency of the trailing sound) was 5.5 kHz. The frequency of the leading sound was 5.694 kHz.
FIGURE 5
FIGURE 5
Group results showing effects of spatial separation between a leading and a trailing tone burst on the amplitudes and latencies of local-field potentials (LFPs) elicited by the sounds. (A,B) Bar charts based on responses to a leading and a trailing sound, respectively. In both panels (A,B), the left and right panels show effects of spatial separation on the normalized amplitude of response (NAR) and the latency, respectively. An error bar indicates a standard error of the mean. “*” and “**” indicate statistical significance (Tukey’s test) at the level of 0.05 and 0.005, respectively.
FIGURE 6
FIGURE 6
Difference between suppressive aftereffects produced by a leading tone burst presented at c90° and i90°. (A) Results from an example rat showing normalized amplitude of response (NAR)-inter-stimulus interval (ISI) (left panel) and latency-ISI (right panel) relationships for the response to a trailing sound obtained when the leading sound was at c90° and i90°, respectively. In the left panel, two arrows point toward the ISI0.7 values obtained when the leading sound was at the two azimuths. The characteristic frequency (CF) of the recording site (hence the frequency of the trailing sound) was 13.0 kHz. The frequency of the leading sound was 13.458 kHz. (B) Results from the entire group of 18 rats comparing effects generated by a leading sound at c90° and i90°. (B1) Top and bottom panels show effects of a leading sound on the NAR and latency of the response to a trailing sound, respectively. A post-hoc t-test (see text for the result from a two-way ANOVA test) indicates that the difference in the suppressive effect was significant at all ISIs between 12 and 72 ms (p = 0.004 at 12 ms; p < 0.001 at 16 ms; p < 0.001 at 24 ms; p = 0.001 at 40 ms; p = 0.020 at 72 ms). Before responses to a leading-trailing sound pair were recorded at each angle of separation (c90° and i90°), the response to a trailing sound presented alone was recorded. Latencies of responses elicited by a trailing sound under these conditions are shown on the right side of the bottom panel. (B2) Bar chart comparing ISI0.7 values obtained when the leading sound was at c90° and i90°. An error bar indicates a standard error of the mean. “*” and “**” indicate statistical significance at the level of 0.05 and 0.005, respectively.
FIGURE 7
FIGURE 7
Results from an example rat showing that gabazine enhanced local-field potentials (LFPs) elicited by a leading and a trailing sound and reduced the suppressive aftereffect produced by a leading sound. (A) The effect of gabazine on waveforms of LFPs elicited by a leading (indicated by a filled upward arrowhead) and a trailing sound (indicated by an open upward arrowhead) in a pair (ISI = 24 ms). Results were obtained when the leading sound was presented at c90° (top panel) and i90° (bottom panel), respectively. (B) The effect of gabazine on the waveform of an LFP elicited by the trailing sound presented alone at c90°. (C) The effect of gabazine on the normalized amplitude of response (NAR)-ISI relationship obtained when the leading sound was at c90° (left panel) and i90° (right panel), respectively. The horizontal dash-and-dotted line indicates the value of NAR at 0.7. The characteristic frequency (CF) of the recording site (hence the frequency of the trailing sound) was 12.0 kHz. The frequency of the leading sound was 11.501 kHz.
FIGURE 8
FIGURE 8
Group results showing that gabazine partially reduced the suppressive aftereffect produced by a leading sound. (A) Bar charts showing effects of gabazine on the normalized amplitude of response (NAR)-inter-stimulus interval (ISI) relationship. Results were obtained when a leading sound was presented at c90° (left panel) and i90° (right panel). The location of the leading sound is shown in the top left corner of each plot. (B) A bar chart showing the effect of gabazine on the ISI0.7 obtained at c90° and i90°. An error bar indicates a standard error of the mean. “*” indicates statistical significance at the level of 0.1.
FIGURE 9
FIGURE 9
Results from an example rat showing that strychnine enhanced local-field potentials (LFPs) elicited by leading and trailing sounds and reduced the suppressive aftereffect produced by a leading sound. (A) The effect of strychnine on waveforms of LFPs elicited by a leading (indicated by a filled upward arrowhead) and a trailing sound (indicated by an open upward arrowhead) in a pair (ISI = 24 ms). Results were obtained when the leading sound was presented at c90° (top panel) and i90° (bottom panel), respectively. (B) The effect of strychnine on the waveform of an LFP elicited by the trailing sound presented alone at c90°. (C) The effect of strychnine on the normalized amplitude of response (NAR)-inter-stimulus interval (ISI) relationship obtained when the leading sound was at c90° (left panel) and i90° (right panel), respectively. The horizontal dash-and-dotted line indicates the value of NAR at 0.7. The characteristic frequency (CF) of the recording site (hence the frequency of the trailing sound) was 13.0 kHz. The frequency of the leading sound was 13.458 kHz.
FIGURE 10
FIGURE 10
Group results showing that strychnine reduced the suppressive aftereffect produced by a leading sound at some inter-stimulus intervals (ISIs). (A) Bar charts showing the effect of glycine on the normalized amplitude of response (NAR)-ISI relationship. Results were obtained when a leading sound was presented at c90° (left panel) and i90° (right panel). (B) A bar chart showing the effect of glycine on the ISI0.7 obtained at c90° and i90°. A post-hoc t-test (see text for the result from a two-way ANOVA test) indicates that strychnine significantly changed the NAR values at ISIs at 16 ms (p = 0.007), 24 ms (p < 0.001), 40 ms (p < 0.001), 72 ms (p = 0.023), 136 ms (p = 0.039), and 264 ms (p = 0.030) when a leading sound was at c90°. The drug significantly changed the NAR values at ISIs at 24 ms (p = 0.005) and 40 ms (p = 0.018) when a leading sound was at i90°. An error bar indicates a standard error of the mean. “*” indicates statistical significance at the level of 0.05, while “**” indicates statistical significance at the level of 0.005.

Similar articles

Cited by

References

    1. Alkhatib A., Biebel U. W., Smolders J. W. (2006). Inhibitory and excitatory response areas of neurons in the central nucleus of the inferior colliculus in unanesthetized chinchillas. Exp. Brain Res. 174 124–143. 10.1007/s00221-006-0424-8 - DOI - PubMed
    1. Arbogast T. L., Mason C. R., Kidd G., Jr. (2002). The effect of spatial separation on informational and energetic masking of speech. J. Acoust. Soc. Am. 112 2086–2098. 10.1121/1.1510141 - DOI - PubMed
    1. Batra R., Fitzpatrick D. C. (2002). Monaural and binaural processing in the ventral nucleus of the lateral lemniscus: A major source of inhibition to the inferior colliculus. Hear. Res. 168 90–97. 10.1016/S0378-5955(02)00368-4 - DOI - PubMed
    1. Bregman A. S. (1990). Auditory scene analysis: The perceptual organization of sound. Cambridge, MA: MIT Press. 10.7551/mitpress/1486.001.0001 - DOI
    1. Bronkhorst A. W. (2000). The cocktail party phenomenon: A review of speech intelligibility in multiple-talker condition. Acta Acust. United Acust. 86 117–128.