

TOR acts as a metabolic gatekeeper for auxin-dependent lateral root initiation in Arabidopsis thaliana
- PMID: 37021425
- PMCID: PMC10183831
- DOI: 10.15252/embj.2022111273
TOR acts as a metabolic gatekeeper for auxin-dependent lateral root initiation in Arabidopsis thaliana
Abstract
Plant organogenesis requires matching the available metabolic resources to developmental programs. In Arabidopsis, the root system is determined by primary root-derived lateral roots (LRs), and adventitious roots (ARs) formed from non-root organs. Lateral root formation entails the auxin-dependent activation of transcription factors ARF7, ARF19, and LBD16. Adventitious root formation relies on LBD16 activation by auxin and WOX11. The allocation of shoot-derived sugar to the roots influences branching, but how its availability is sensed for LRs formation remains unknown. We combine metabolic profiling with cell-specific interference to show that LRs switch to glycolysis and consume carbohydrates. The target-of-rapamycin (TOR) kinase is activated in the lateral root domain. Interfering with TOR kinase blocks LR initiation while promoting AR formation. The target-of-rapamycin inhibition marginally affects the auxin-induced transcriptional response of the pericycle but attenuates the translation of ARF19, ARF7, and LBD16. TOR inhibition induces WOX11 transcription in these cells, yet no root branching occurs as TOR controls LBD16 translation. TOR is a central gatekeeper for root branching that integrates local auxin-dependent pathways with systemic metabolic signals, modulating the translation of auxin-induced genes.
Keywords: Arabidopsis thaliana; TOR; auxin; lateral root; metabolism.
© 2023 The Authors. Published under the terms of the CC BY NC ND 4.0 license.
Conflict of interest statement
The authors declare that they have no conflict of interest.
Figures
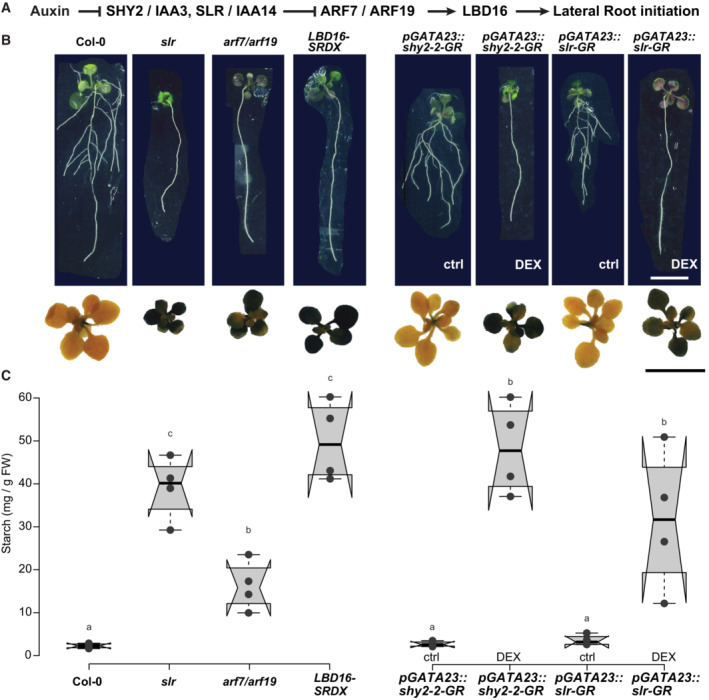
- A
Schematic representation of key components of the auxin signaling module acting during lateral root initiation.
- B
Images of rosettes and seedlings (15 DAG) of Col‐0, arf7/arf19, slr, and gLBD16‐SRDX as well as the inducible lateral‐root‐less lines pGATA23::shy2‐2‐GR and pGATA23::slr1‐GR grown on DMSO control medium or 30 μM Dexamethasone (DEX), Scale bar 1 cm. The rosettes were stained with a Lugol's Iodine solution for starch accumulation at the end of the dark period (representative images of n = 3 biological replicates).
- C
Box plots of starch quantification in rosette tissues at 15 DAG (n = 4 biological replicates). Comparison between samples was performed by one‐way ANOVA and post‐hoc Tukey HSD Test (α = 0.05); different letters indicate significant differences.
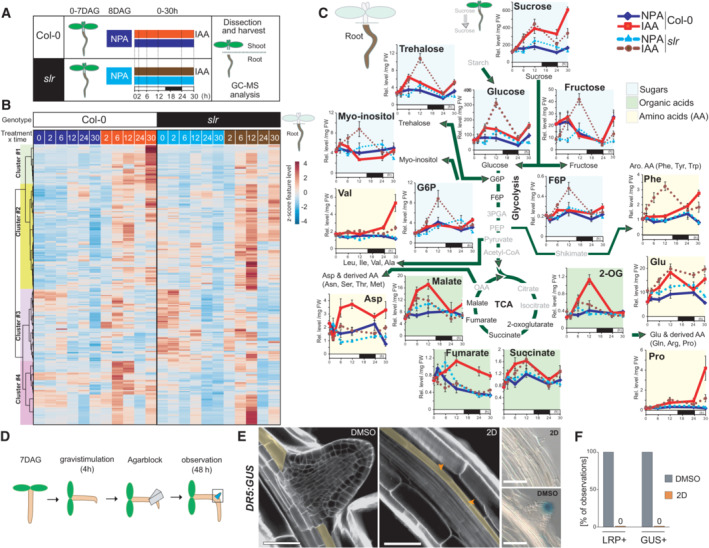
- A
Schematic of the experimental setup used for the GC–MS‐based metabolomics profiling.
- B
Heatmap from a hierarchical clustering analysis (HCA) with Ward's linkage showing z‐score normalized relative levels of top 250 most intense compound‐derived spectra (Dataset EV1) exhibiting non‐constant intensity (One‐way ANOVA & FDR‐adjusted P < 0.05) across experimental conditions in roots. Main HCA clusters are color labeled.
- C
Mean relative levels (± SE, n = 5 biological replicates, normalized to the ribitol internal standard and per mg fresh weight) for representative metabolites of sugar, glycolytic, tricarboxylic acid, amino acid metabolic pathways in root tissues of Col‐0 (solid lines) and slr (dashed lines) at the indicated time after IAA application. The white and black boxes below the x‐axis indicate light and dark phases during the sampling. Statistical differences for genotype × treatment (NPA‐ vs. IAA‐treated roots) are summarized in Dataset EV1.
- D
Schematic of the experimental setup for induction of LR formation upon local 2‐deoxy‐D‐glucose (2D, 10 mM) treatment.
- E
Representative confocal sections of calcofluor counterstained (E, n = 5 biological replicates) and differential interference contrast (DIC) images of GUS‐stained root bends (F, n = 16 biological replicates) in DR5:GUS seedlings treated as indicated 48 h after gravistimulation. In (E), orange arrows indicate the pericycle (marked in yellow). Scale bar: 50 μm.
- F
Fraction of root bends forming an LRP and showing DR5 GUS staining after treatment with either control or 2D containing agar blocks (n = 16 biological replicates, ± SE).
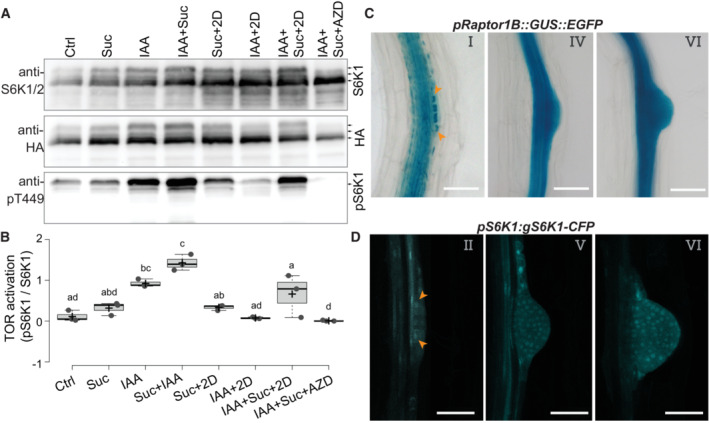
- A
Representative western blot of root tissues of pUB10:S6K1‐3xHA treated by the indicated combination of auxin (IAA, 10 μM), sucrose (Suc, 110 mM), 2‐deoxy‐d‐glucose (2D, 20 mM) and AZD8055 (AZD, 10 μM) and probed with anti‐S6K1/2, anti‐HA or anti‐S6K1‐T449P. Blot is one of three biological replicates.
- B
Quantification of the relative S6K activation. Box plots show three biological replicates, and comparison between samples was performed by one‐way ANOVA and post‐hoc Tukey HSD Test (α = 0.05); different letters indicate significant differences.
- C
Representative DIC images showing RPT1B promoter expression at different stages of LR development in 10 DAG seedlings. Orange arrowheads indicate the accumulation of reporter signals in the dividing lateral root founder cells. Scale bars: 50 μm.
- D
Representative confocal section showing S6K1 expression in different stages of LR development in 10 DAG pS6K1:gS6K1‐CFP seedlings. Orange arrowheads indicate the accumulation of reporter signals in the dividing lateral root founder cells. Scale bars: 50 μm.
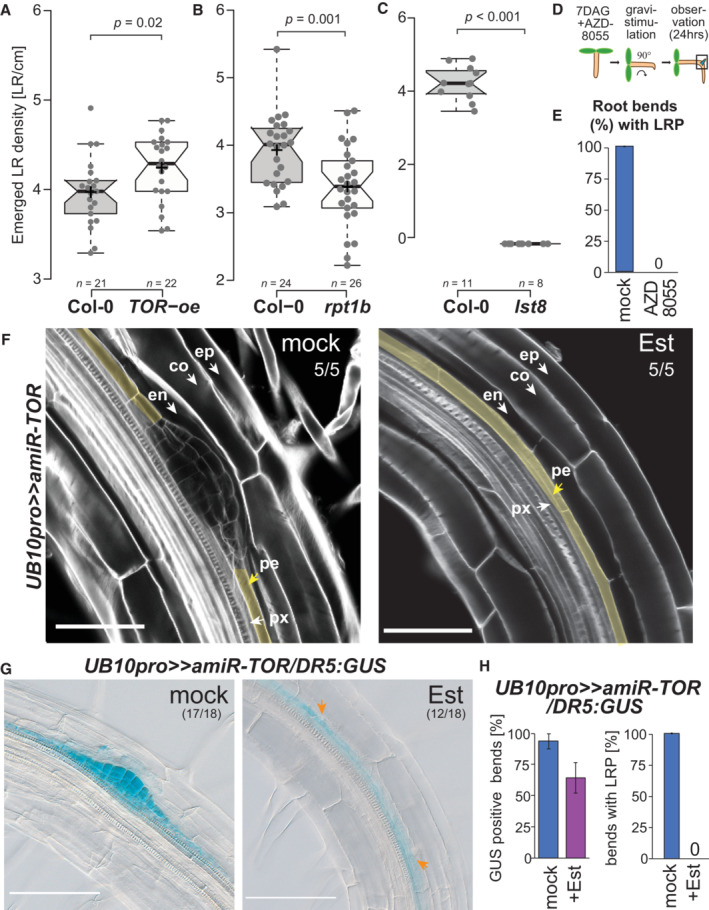
- A–C
Box plots of emerged LR in TOR‐oe (A), rpt1b (B), and lst8 (C) at 14 DAG. Comparison between samples was performed by one‐way ANOVA and post‐hoc Tukey HSD Test (α = 0.05); different letters indicate significant differences. The number of roots scored is indicated.
- D
Schematic of the experimental setup used for scoring LR formation by gravistimulation upon inhibition of TOR by AZD8055 (10 μM).
- E
Proportion of bends developing lateral root primordia after transfer to AZD8055 containing media and gravistimulation for 24 h (n = 10).
- F
Representative confocal images of calcofluor counterstained bends of 7DAG UB10pro>>amiR‐TOR seedlings following a 24 h pre‐treatment with mock (DMSO) or ß‐Estradiol (10 μM) and subsequent 24 h gravistimulation (ep: epidermis, co: cortex, en: endodermis, pe: pericycle, px: protoxylem). Numbers indicate the proportion of root bends with the depicted phenotype. Scale bar: 50 μm.
- G
Representative DIC images of bends in 7 DAG UB10pro>>amiR‐TOR/DR5:GUS seedlings stained for GUS activity after a 24 h pre‐treatment with mock (DMSO) or ß‐Estradiol (Est, 10 μM) and subsequent 24 h gravistimulation. The proportion of root bends showing the depicted phenotype is indicated. Scale bar: 100 μm.
- H
Fraction of bends developing lateral root primordia and stained for GUS activity in primary root vasculature of UB10pro>>amiR‐TOR/DR5:GUS, n = 18 bends.
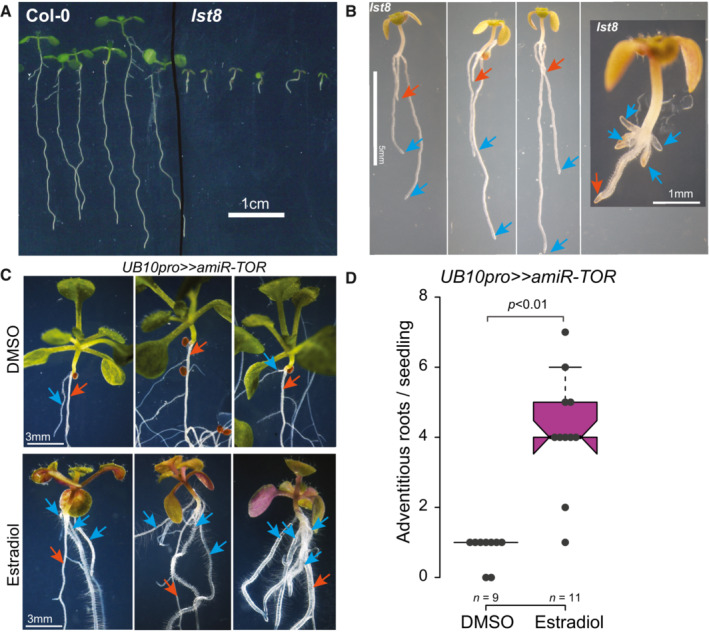
- A
Primary root growth in 14‐day‐old lst8 seedlings is reduced compared to Col‐0.
- B
Close‐ups of 14‐day‐old lst8 seedlings with numerous adventitious roots (blue arrows) on the hypocotyl; the primary root is indicated with a red arrow.
- C
TOR knockdown induces the formation of adventitious roots. 14‐day‐old UB10pro>>amiR‐TOR seedlings transferred at 8 DAG to Est develop more adventitious roots from the hypocotyl (blue arrows) than DMSO‐treated seedlings. The red arrows indicate the primary root.
- D
Distribution of the number of hypocotyl‐borne adventitious roots produced in 14‐day‐old UB10pro>>amiR‐TOR seedlings transferred at 8 DAG to Est or DMSO. The number of biological replicates is indicated. Unpaired t‐test.
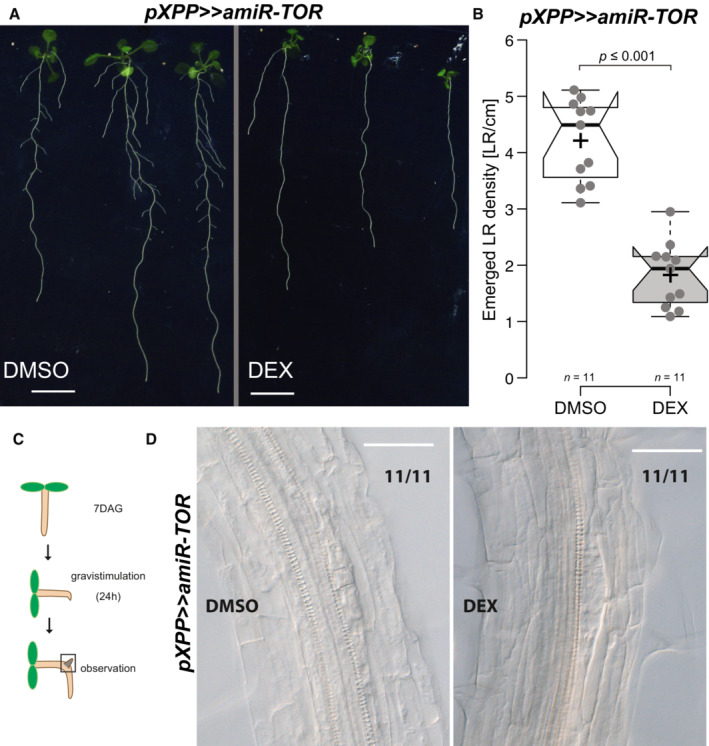
- A
Phenotype of pXPP>>amiR‐TOR seedlings grown on DMSO or 30 μM Dexamethasone (DEX) at 14 DAG. Scale bar: 5 mm.
- B
Density of emerged LR in pXPP>>amiR‐TOR upon control or DEX treatment in 14‐day‐old seedlings.
- C
Schematic of the experimental setup used for scoring LR initiation by gravistimulation for 24 h, upon control or DEX treatment.
- D
Representative DIC images of root bends of 7DAG pXPP>>>>amiR‐TOR seedlings raised on (DMSO) or DEX and subsequent 24 h gravistimulation. Numbers indicate the proportion of root bends with the depicted phenotype. Scale bar: 50 μm.
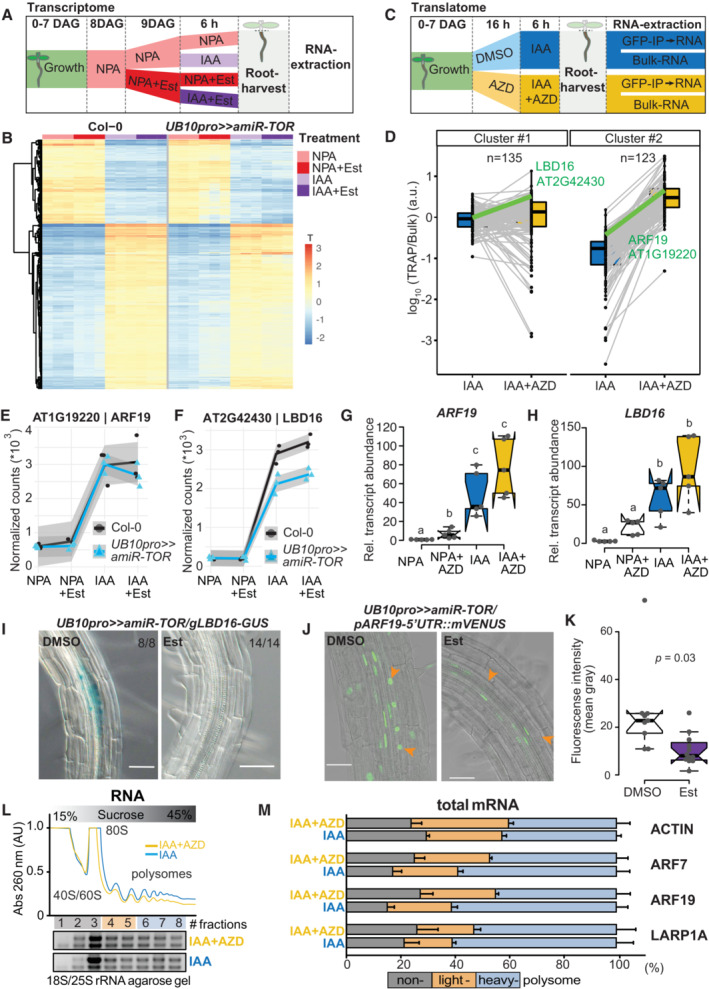
- A
Schematic of the experimental setup used to profile the impact of TOR knockdown on the transcriptome during LR formation. IAA, NPA, and Est were all used at 10 μM concentration.
- B
Heatmap from a k‐means clustering analysis for 1,141 IAA‐dependent transcripts (log fold change > 1 & FDR < 0.05). n = 3 biological replicates.
- C
Schematic of the experimental setup used to profile the impact of TOR inhibition on the translatome during LR formation. IAA and AZD8055 were used at 10 μM.
- D
Translational response (reads associated to ribosomes (TRAP) divided by reads in Bulk RNA) of 258 auxin‐induced genes. K‐means revealed two clusters, with mild (#1) to strong (#2) shifts in translation response upon TOR inhibition. The profiles of ARF19 and LBD16 are highlighted in green. n = 3 biological replicates.
- E, F
Abundance of ARF19 (E) and LBD16 (F) transcripts in RNAseq samples. mRNA accumulation in response to auxin is comparable for both, whether TOR is knocked down. n = 3 biological replicates.
- G, H
Relative expression levels (normalized to ACTIN) of ARF19 (G) and LBD16 (H) measured by RT–qPCR upon TOR activity inhibition with AZD8055. Comparison between samples was performed by one‐way ANOVA. Different letters indicate significant differences based on a post‐hoc Tukey HSD Test (n = 5 biological replicates, α = 0.05).
- I
Distribution of GUS‐staining in UB10pro>>amiR‐TOR/gLBD16‐GUS seedlings 24 h after bending is absent if previously treated for 24 with Est. The proportion of root bends with the depicted phenotype is indicated.
- J
Representative confocal images of bends of 7 DAG UB10pro>>amiR‐ TOR/pARF19‐5′UTR::mVENUS seedlings following a 24 h pre‐treatment with mock (DMSO) or ß‐ Estradiol and subsequent 24 h gravistimulation. Scale bar: 50 μm, n = 9 root bends.
- K
Signal (mean gray values) in the nuclei of the pericycle cells of UB10pro>>amiR‐TOR/pARF19‐5′UTR::mVENUS. Significant differences between DMSO and Est‐treated roots based on paired t‐test, n = 9 root bends.
- L, M
Total lysates prepared from lateral roots treated or not with IAA and AZD were fractionated through sucrose gradients, and the relative redistribution (percentage of total) of ACTIN, ARF7, ARF19, and LARP1 mRNAs in every 8 fractions were studied by RT–qPCR analysis. (L) Polysome profiles. 40S, small ribosomal subunit; 60S, large ribosomal subunit; 80S, mono‐ribosome; polysomes, polyribosomes. AU is arbitrary units of RNA absorbance at A260 nanometers. (M) RT–qPCR analysis of mRNA redistribution through a sucrose gradient (8 fractions collected). Translation efficiency was computed as a percentage of mRNA in non‐polysome fractions (40/60/80S; fractions 1–3) against both lights (fractions 4–5) and heavy polysomes (fractions 6–8). The plot is representative of three independently performed experiments with similar results. Data are mean ± SEM.
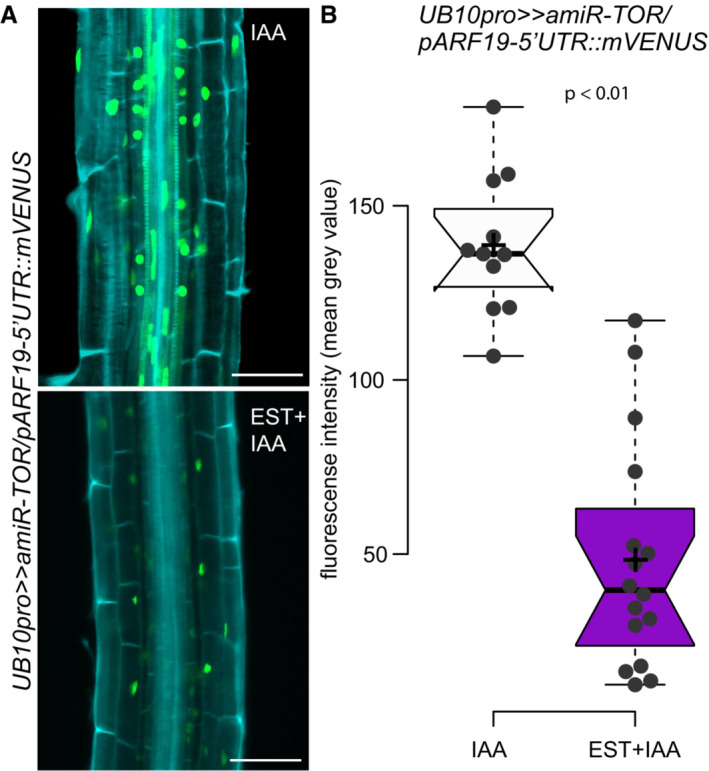
- A
Representative confocal images of mVenus accumulation in 7 DAG UB10pro>>amiR‐TOR/pARF19‐5′UTR::mVENUS seedlings. Seedlings were pre‐treated for 24 h with mock (DMSO) or 10 μM ß‐Estradiol to induce TOR knockdown and then transferred to 10 μM IAA to induce LR formation synchronously. Scale bar: 50 μm, n ≥ 11 individual roots.
- B
Quantification of mean gray values in the nuclei of the pericycle cells. Significant differences between mVENUS‐signal of 10 μM IAA treated seedlings either DMSO or Est pre‐treated roots based on paired t‐test.
- A
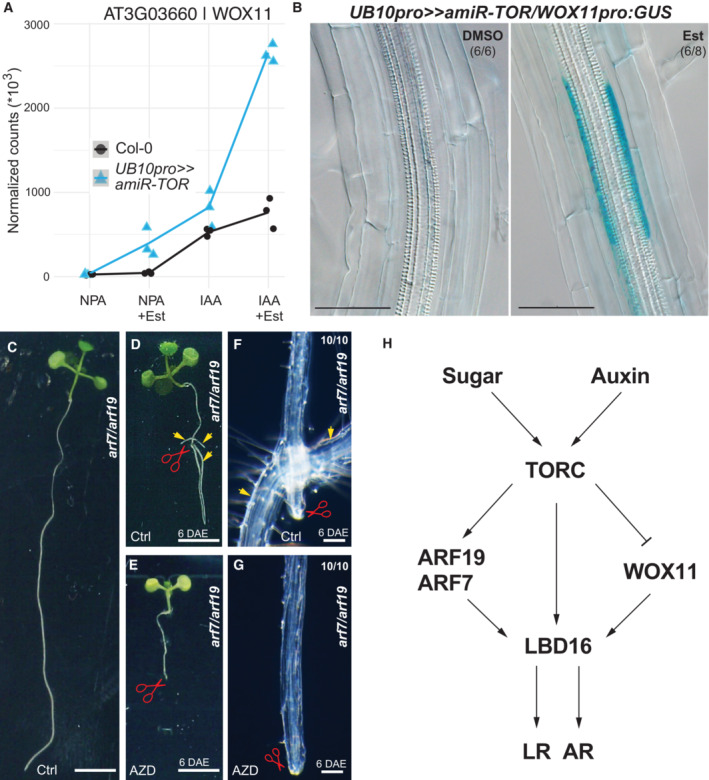
Abundance of WOX11 transcripts in RNAseq samples. mRNA accumulation in response to auxin is elevated when TOR is knocked down. n = 3 biological replicates.
- B
Distribution of GUS‐staining in UB10pro>>amiR‐TOR/WOX11pro::GUS seedlings 6 days after transfer to 10 μM Est. The proportion of root bends with the depicted phenotype is indicated.
- C
The arf7/arf19 mutant shows defective LR initiation.
- D
Formation of roots (arrows) close to the wound site of arf7/arf19 primary roots 6 days after excision (DAE).
- E
Blocking TOR‐activity via exposure to 10 μM AZD8055 (AZD) resulted in the loss of rooting capability on the wound site of arf7/arf19 primary roots at 6 DAE. Scale bars = 3 mm.
- F, G
Close‐ups indicate root formation location or absence of root formation on ctrl media and AZD‐containing media, respectively, in arf7/arf19 primary roots at 6 DAE. The proportion of root wound sites with the depicted phenotype is indicated. Scale bars = 100 μm.
- H
Model for TOR dependency of root branching in Arabidopsis.
References
-
- Arrivault S, Guenther M, Ivakov A, Feil R, Vosloh D, van Dongen JT, Sulpice R, Stitt M (2009) Use of reverse‐phase liquid chromatography, linked to tandem mass spectrometry, to profile the Calvin cycle and other metabolic intermediates in Arabidopsis rosettes at different carbon dioxide concentrations. Plant J 59: 826–839 - PubMed
-
- Bellini C, Pacurar DI, Perrone I (2014) Adventitious roots and lateral roots: similarities and differences. Annu Rev Plant Biol 65: 639–666 - PubMed
-
- Benková E, Michniewicz M, Sauer M, Teichmann T, Seifertová D, Jürgens G, Friml J (2003) Local, efflux-dependent auxin gradients as a common module for plant organ formation. Cell 115: 591–602 - PubMed
Publication types
MeSH terms
Substances
Associated data
- Actions
LinkOut - more resources
Full Text Sources
Molecular Biology Databases
Research Materials
