. 2023 Sep 1;108(9):2343-2357.
doi: 10.3324/haematol.2022.281894.

Simultaneous inhibition of Sirtuin 3 and cholesterol homeostasis targets acute myeloid leukemia stem cells by perturbing fatty acid β-oxidation and inducing lipotoxicity

Affiliations

Simultaneous inhibition of Sirtuin 3 and cholesterol homeostasis targets acute myeloid leukemia stem cells by perturbing fatty acid β-oxidation and inducing lipotoxicity

Cristiana O'Brien et al. Haematologica. .

Abstract

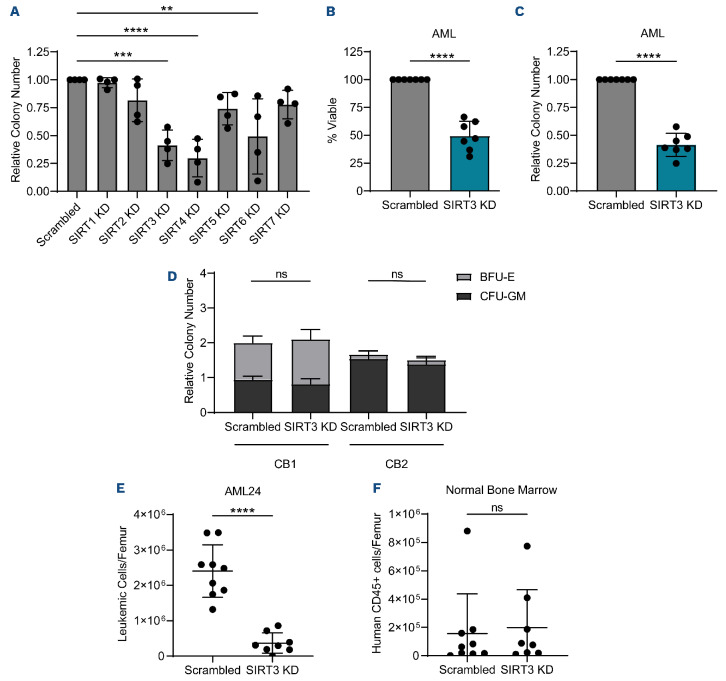
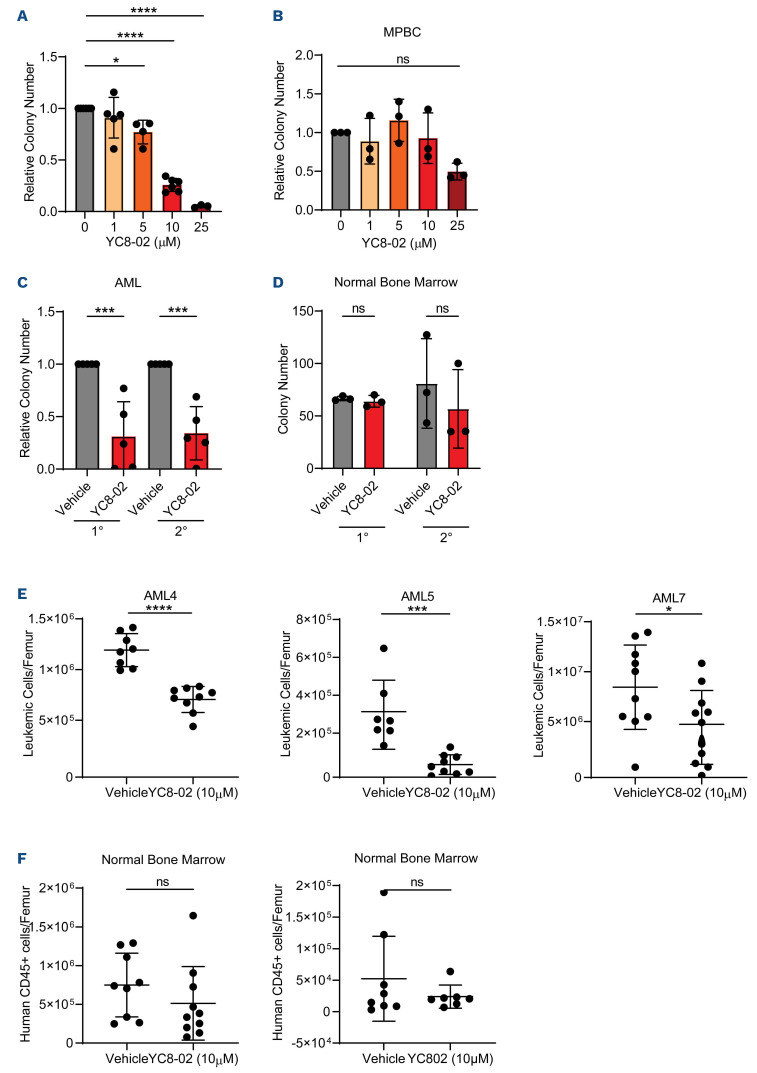
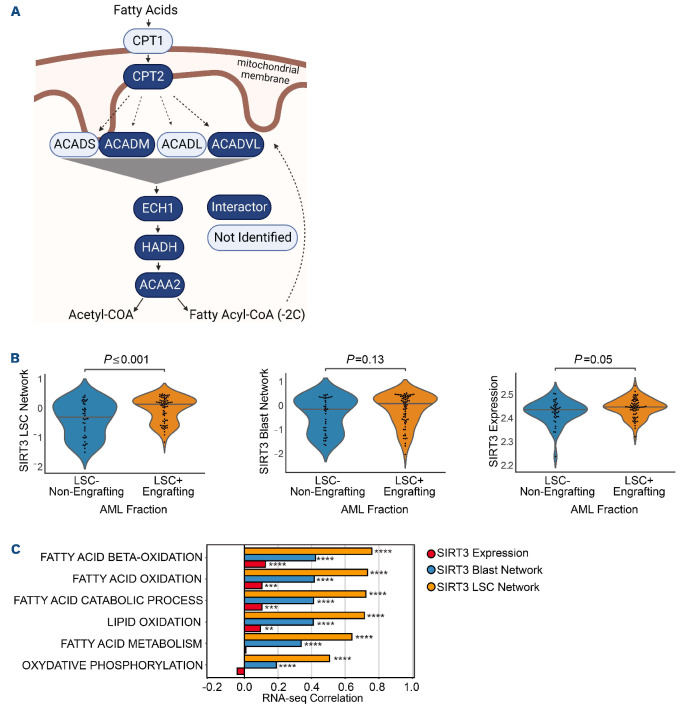
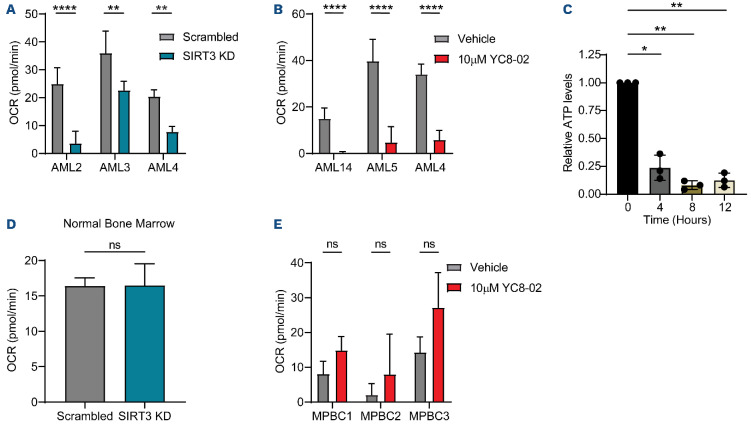
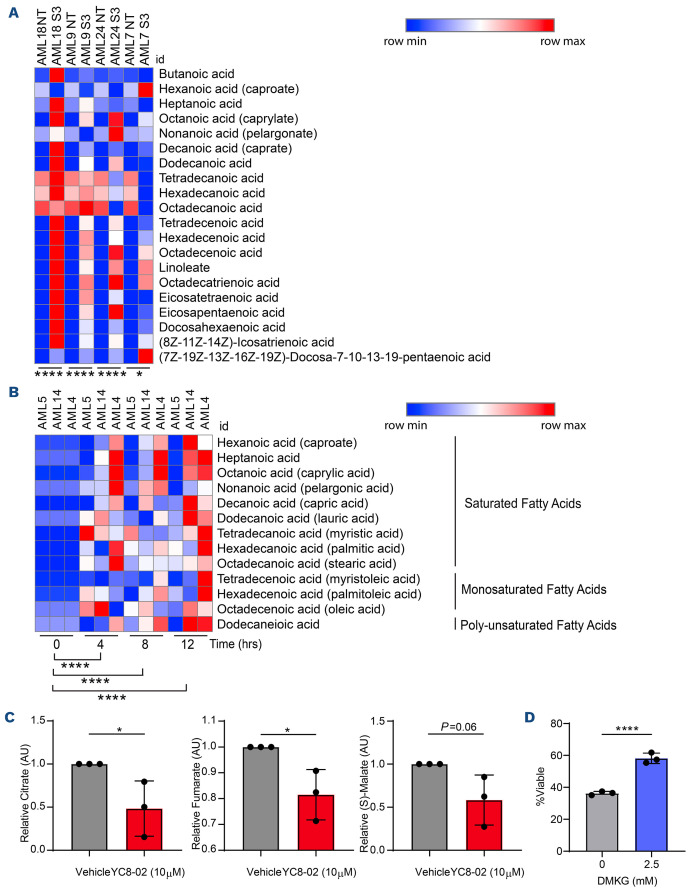
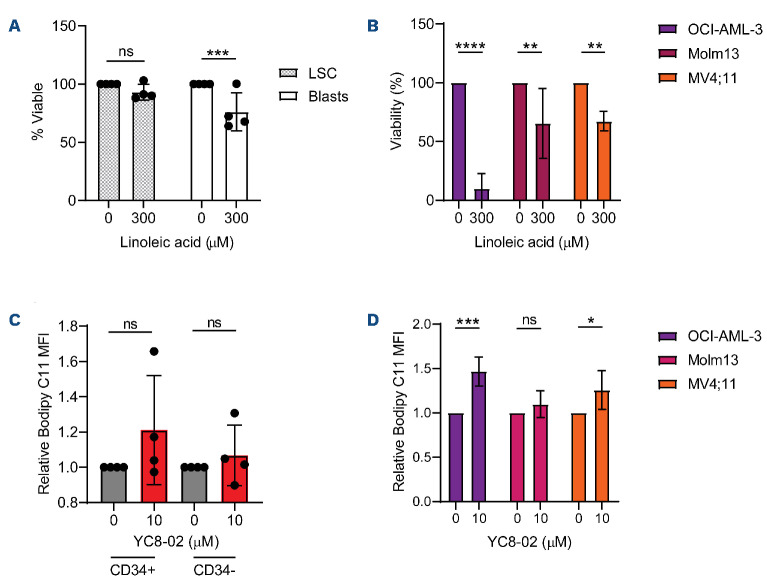
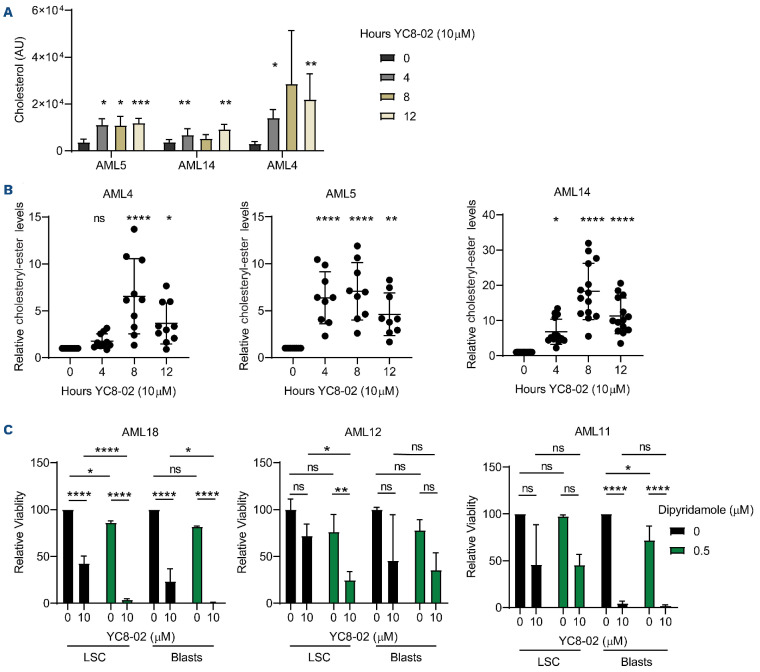
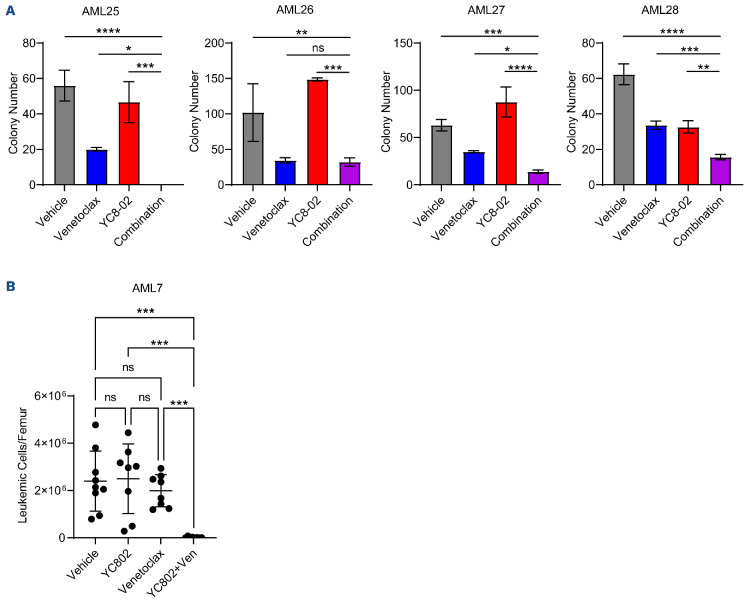
Outcomes for patients with acute myeloid leukemia (AML) remain poor due to the inability of current therapeutic regimens to fully eradicate disease-initiating leukemia stem cells (LSC). Previous studies have demonstrated that oxidative phosphorylation (OXPHOS) is an essential process that is targetable in LSC. Sirtuin 3 (SIRT3), a mitochondrial deacetylase with a multi-faceted role in metabolic regulation, has been shown to regulate OXPHOS in cancer models; however, it has not yet been studied in the context of LSC. Thus, we sought to identify if SIRT3 is important for LSC function. Using RNAi and a SIRT3 inhibitor (YC8-02), we demonstrate that SIRT3 is a critical target for the survival of primary human LSC but is not essential for normal human hematopoietic stem and progenitor cell function. In order to elucidate the molecular mechanisms by which SIRT3 is essential in LSC we combined transcriptomic, proteomic, and lipidomic approaches, showing that SIRT3 is important for LSC function through the regulation of fatty acid oxidation (FAO) which is required to support OXPHOS and ATP production in human LSC. Further, we discovered two approaches to further sensitize LSC to SIRT3 inhibition. First, we found that LSC tolerate the toxic effects of fatty acid accumulation induced by SIRT3 inhibition by upregulating cholesterol esterification. Disruption of cholesterol homeostasis sensitizes LSC to YC8-02 and potentiates LSC death. Second, SIRT3 inhibition sensitizes LSC to the BCL-2 inhibitor venetoclax. Together, these findings establish SIRT3 as a regulator of lipid metabolism and potential therapeutic target in primitive AML cells.


Figures

Figure 1.
Figure 1.
SIRT3 knockdown targets acute myeloid leukemia but not hematopoietic stem and progenitor cells. (A) Colony-forming ability of four primary acute myeloid leukemia (AML) specimens (AML1-4) post scrambled and sirturin (SIRT) targeting small interfering RNA (siRNA) transfection. Colony-forming unit (CFU) assay was prepared immediately after electroporation. Statistical significance was determined by one-way ANOVA analysis. Each dot represents a primary AML specimen. (B) Viability of bulk AML 48 hours post scrambled or SIRT3 targeting siRNA transfection in 7 primary AML specimens (AML 1-5, 14 and 15). Statistical significance was determined using a paired t-test. Each dot represents a primary AML specimen. (C) Colony-forming potential of bulk AML post scrambled or SIRT3 targeting siRNA transfection in 7 primary AML specimens (AML. 1-5, 14, and 15). CFU assay was prepared immediately after electroporation. Statistical significance was determined using a paired t-test. Each dot represents a primary AML specimen. (D) Colony-forming potential of 2 CD34-enriched cord blood samples post scrambled or SIRT3 targeting siRNA transfection. CFU assay was prepared immediately after electroporation. Statistical significance was determined using a paired t-test. (E) Engraftment of AML24 post scrambled or SIRT3 targeting siRNA transfection. Each point represents a single mouse. Statistical significance was determined using an unpaired t-test. (F) Engraftment of normal bone marrow post scrambled or SIRT3 targeting siRNA transfection. Each point represents a single mouse. Statistical significance was determined using an unpaired t-test. All error bars represent standard deviation. *P<0.05, **P<0.01, ***P<0.005, ****P<0.001; ns: not significant.
Figure 2.
Figure 2.
SIRT3 inhibition perturbs leukemia stem cell function and spares normal hematopoietic stem and progenitor cells. (A) Colony-forming ability of reactive-oxygen species (ROS) low leukemia stem cells (LSC) was assessed from 6 primary acute myeloid leukemia (AML) (AML 4, 5, 7, 8, 9, 14) and treated with YC8-02 for 24 hours at increasing doses, when possible, prior to performing the colony-forming unit (CFU) assay. Each dot represents a unique AML. Statistical significance was determined using ordinary one-way ANOVA. (B) Colony-forming ability of representative mobilized peripheral blood cells (MPBC) following treatment with YC8-02 for 24 hours at increasing doses prior to performing the CFU assay. Statistical significance was determined using two-way ANOVA. (C) Serial colony-forming ability of primary AML 7, 9, 10, and 24 treated with 10 µM YC8-02 for 24 hours. Each dot represents a unique AML. Statistical significance was determined using an unpaired t-test. (D) Serial colony-forming ability of normal bone marrow treated with 10 µM YC8-02 for 24 hours. Statistical significance was determined using an unpaired t-test. (E) Engraftment of 3 primary AML treated with YC8-02. Each point represents a single mouse. Statistical significance was determined using an unpaired t-test. (F) Engraftment of 2 normal bone marrow specimens in NSG-SGM3 mice following treatment with YC8-02. Each point represents a single mouse. Statistical significance was determined using an unpaired t-test. All error bars represent standard deviation. *P<0.05, **P<0.01, ***P<0.005, ****P<0.001; ns: not significant.
Figure 3.
Figure 3.
SIRT3 regulates mitochondrial energy metabolism in acute myeloid leukemia. (A) Fatty acid oxidation proteins identified as proximity interactors of SIRT3 (dark blue) or not identified as interactors (light blue). (B) Expression of SIRT3 leukemia stem cells (LSC) network, SIRT3 blast network and SIRT3 individually in functional LSC and non-LSC based using GSVA on quantile normalized microarray data (for the networks) or quantile normalized microarray (for SIRT3 alone). Data derived from 220 sorted fractions. (C) Correlation of metabolic pathways with SIRT3 LSC network, SIRT3 blast network and SIRT3 individually. Bars represent the Pearson correlation across 812 diagnostic acute myeloid leukemia (AML) patients from TCGA, Beat-AML and Leucegene databases. Network data was generated by using GSVA on transcript per million (TPM) normalized RNA sequencing (RNA-seq) data and the SIRT3 data was generated using variance stabilizing transformation (VST) normalized RNA-seq data and COMBAT batch corrected. *P<0.05, **P<0.01, ***P<0.005, ****P<0.001; ns: not significant.
Figure 4.
Figure 4.
SIRT3 regulates oxidative phosphorylation. (A) Basal respiration of 3 bulk primary acute myeloid leukemia (AML) transfected with small interfering RNA (siRNA) targeting SIRT3 or a non-targeting scrambled siRNA. Measurements taken 24 hours post electroporation. Statistical significance was determined using an unpaired t-test. (B) Basal respiration of leukemia stem cells (LSC) enriched from 3 primary AML treated with YC8-02 for 12 hours prior to read out. Statistical significance was determined using an unpaired t-test. (C) Total cellular ATP quantified from bulk AML (AML 4, 5, and 14) treated with 10 µM of YC8-02 for 4, 8, or 12 hours. ATP quantities are normalized to the baseline measurement. Each dot represents an AML specimen. Statistical significance was determined using RM one-way ANOVA. (D) Basal respiration of normal bone marrow samples transfected with siRNA targeting SIRT3 or a non-targeting scrambled siRNA. Measurements taken 24 hours post electroporation. Statistical significance was determined using an unpaired t-test. (E) Basal respiration of three mobilized peripheral blood cell (MPBC) samples treated with YC8-02 for 12 hours prior to readout. Statistical significance was determined using an unpaired t-test. All error bars represent standard deviation. *P<0.05, **P<0.01, ***P<0.005, ****P<0.001; ns: not significant. OCR: oxygen consumption rate; KD: knockout.
Figure 5.
Figure 5.
SIRT3 inhibition results in faty acid accumulation in leukemia stem cells. (A) Fatty acids measured by steady state mass spectrometry lipidomics on 4 bulk acute myeloid leukemia (AML) transfected with small interfering RNA (siRNA) targeting SIRT3 or a non-targeting scrambled siRNA. Samples were collected 24 hours post transfection. Significance was determined using a paired t-test. (B) Fatty acids in leukemia stem cells (LSC) enriched from three primary AML and treated with 10 µM YC8-02 for 4, 8 or 12 hours. Significance was determined using a paired t-test. (C) Stable isotope tracing analysis of LSC enriched from 3 primary AML specimens (AML 8, 10 and 12) treated with vehicle or 10 µM YC8-02 prior to introduction of C16-palmitate. Three TCA intermediates were detected in these analyses. Each point represents a unique AML specimen. Statistical significance was determined using an unpaired t-test. (D) Result of tricarboxylic acid cycle (TCA) cycle rescue on viability using bulk AML (AML 11). Cells were treated with dimethyl-2-oxoglutarate (DMKG) at 0 mM or 2.5 mM for 1 hour prior to introduction of 25 µM of YC8-02. Cells were incubated for 48 hours prior to analysis. Statistical significance was determined using ordinary one-way ANOVA. All error bars represent standard deviation. *P<0.05, **P<0.01, ***P<0.005, ****P<0.001; ns: not significant.
Figure 6.
Figure 6.
Leukemia stem cells are resistant to cell death induced by lipid accumulation. (A) Viability of leukemia stem cells (LSC) and acute myeloid leukemia (AML) blasts enriched from three primary AML (AML 6, 9, and 10) treated with linoleic acid for 48 hours. Statistical significance was determined using two-way ANOVA. (B) Viability of 3 AML cell lines (OCI-AML-3, Molm13, and MV4;11) treated with linoleic acid for 48 hours. Statistical significance was determined using ordinary one-way ANOVA. (C) BODIPY C11 mean florescence intensity (MFI) of primary AML 20, AML 21, AML 22, and AML 23 treated with 10 µM of YC8-02 for 8 hours. Statistical significance was determined using two-way ANOVA. (D) BODIPY C11 MFI of primary AML cell lines treated with 10 µM of YC8-02 for 8 hours. Statistical significance was determined using an unpaired t-test. All error bars represent standard deviation. *P<0.05, **P<0.01, ***P<0.005, ****P<0.001; ns: not significant.
Figure 7.
Figure 7.
Combined inhibition of SIRT3 and cholesterol metabolism increases cell death. (A) Cholesterol levels detected by steady state mass-spectrometry lipidomic analysis in leukemia stem cells (LSC) enriched from 3 primary acute myeloid leukemia (AML) specimens and treated with 10 µM YC8-02 for 4, 8 or 12 hours. Statistical significance was determined using ordinary one-way ANOVA. (B) Cholesteryl-ester levels detected by steady state mass-spectrometry lipidomic analysis in LSC enriched from 3 primary AML specimens and treated with 10 µM YC8-02 for 4, 8 or 12 hours. Quantities are normalized to baseline control. Statistical significance was determined using ordinary one-way ANOVA. (C) Viability of LSC and AML blasts enriched from 3 primary AML specimens and treated with 10 µM YC8-02 alone or in combination with 0.5 µM dipyridamole. Statistical significance was determined using two-way ANOVA. All error bars represent standard deviation. *P<0.05, **P<0.01, ***P<0.005, ****P<0.001; ns: not significant.
Figure 8.
Figure 8.
SIRT3 inhibition improves response to venetoclax. (A) Colony-forming ability of 4 primary acute myeloid leukemia (AML) specimens treated with 10 µM YC8-02, 100 nM of venetoclax or a combination of the two, treated for 72 hours prior to performing colony-forming unit (CFU) assay. Statistical significance was determined using an ordinary one-way ANOVA. (B) Engraftment of AML 7 treated with with 10 µM YC8-02, 100 nM of venetoclax, or a combination of the two for 24 hours prior to engraftment. Each point represents a single mouse. Statistical significance was determined using ordinary one-way ANOVA. All error bars represent standard deviation. *P<0.05, **P<0.01, ***P<0.005, ****P<0.001; ns: not significant.

References

    1. Pollyea DA, Jordan CT. Therapeutic targeting of acute myeloid leukemia stem cells. Blood. 2017;129(12):1627-1635. - PubMed
    1. Shlush LI, Mitchell A, Heisler L, et al. Tracing the origins of relapse in acute myeloid leukaemia to stem cells. Nature. 2017;547(7661):104-108. - PubMed
    1. Jones CL, Inguva A, Jordan CT. Targeting energy metabolism in cancer stem cells: progress and challenges in leukemia and solid tumors. Cell Stem Cell. 2021;28(3):378-393. - PMC - PubMed
    1. Imai S, Guarente L. NAD+ and sirtuins in aging and disease. Trends Cell Biol. 2014;24(8):464-471. - PMC - PubMed
    1. Chen X, Sun K, Jiao S, et al. High levels of SIRT1 expression enhance tumorigenesis and associate with a poor prognosis of colorectal carcinoma patients. Sci Rep. 2014;4:7481. - PMC - PubMed

Publication types