. 2023 Aug 3;192(4):3030-3048.
doi: 10.1093/plphys/kiad212.

Chloroplastic Sec14-like proteins modulate growth and phosphate deficiency responses in Arabidopsis and rice

Affiliations

Chloroplastic Sec14-like proteins modulate growth and phosphate deficiency responses in Arabidopsis and rice

Mailun Yang et al. Plant Physiol. .

Abstract

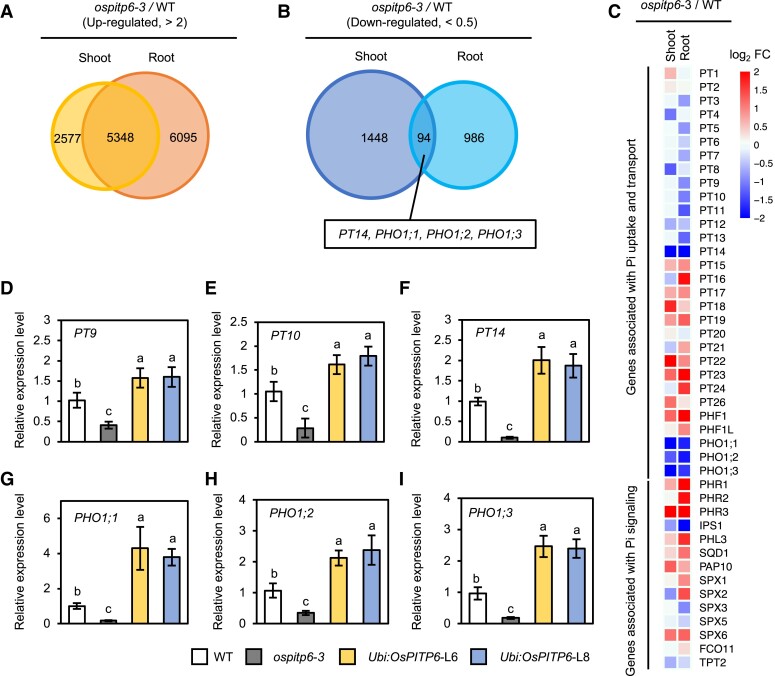
Phosphorus is an essential nutrient acquired from soil as phosphate (Pi), and its deficiency severely reduces plant growth and crop yield. Here, we show that single nucleotide polymorphisms (SNPs) at the PHOSPHATIDYLINOSITOL TRANSFER PROTEIN7 (AtPITP7) locus, which encodes a chloroplastic Sec14-like protein, are associated with genetic diversity regarding Pi uptake activity in Arabidopsis (Arabidopsis thaliana). Inactivation of AtPITP7 and its rice (Oryza sativa) homolog (OsPITP6) through T-DNA insertion and CRISPR/Cas9-mediated gene editing, respectively, decreased Pi uptake and plant growth, regardless of Pi availability. By contrast, overexpression of AtPITP7 and OsPITP6 enhanced Pi uptake and plant growth, especially under limited Pi supply. Importantly, overexpression of OsPITP6 increased the tiller number and grain yield in rice. Targeted metabolome analysis of glycerolipids in leaves and chloroplasts revealed that inactivation of OsPITP6 alters phospholipid contents, independent of Pi availability, diminishing the reduction in phospholipid content and increase in glycolipid content induced by Pi deficiency; meanwhile, overexpression of OsPITP6 enhanced Pi deficiency-induced metabolic alterations. Together with transcriptome analysis of ospitp6 rice plants and phenotypic analysis of grafted Arabidopsis chimeras, these results suggest that chloroplastic Sec14-like proteins play an essential role in growth modulations in response to changes in Pi availability, although their function is critical for plant growth under any Pi condition. The superior traits of OsPITP6-overexpressing rice plants also highlight the potential of OsPITP6 and its homologs in other crops as additional tools for improving Pi uptake and plant growth in low Pi environments.


Conflict of interest statement

Conflict of interest statement. None declared.

Figures

Figure 1.
Figure 1.
Effects of the knockout mutation and overexpression of AtPITP7 on Pi uptake and growth of Arabidopsis seedlings under Pi-deficient conditions. A) Visualization and B) quantification of 33P-labeled Pi uptake by 10-d-old WT, atpitp7-2, and 35S:AtPITP7/atpitp7-2/(L1) seedlings grown on 1/2 MS agar plates for 5 d and then subjected to Pi deficiency treatment for 5 d. C) Quantification of Pi in 12-d-old WT, atpitp7-2, and 35S:AtPITP7/atpitp7-2 (L1 to L3) seedlings grown on 1/2 MS agar plates. D) Phenotype, E) fresh shoot weight, F) fresh root weight, and G) root length of 15-d-old WT, atpitp7-2, and 35S:AtPITP7/atpitp7-2 (L1) seedlings grown on 1/2 MS agar plates for 5 d and then on control Pi (500 μM Pi) or low Pi (5 μM Pi) agar plates for 10 d. In B), C), and E to G), data represent mean ± standard deviation (Sd) of 5 biological replicates, and different letters above bars indicate statistically significant differences (P < 0.05; Tukey's multiple comparison test). Scale bar = 1 cm D).
Figure 2.
Figure 2.
Natural variation in AtPITP7 expression among 26 Arabidopsis accessions. A) Expression levels of AtPITP7 in 8-d-old Arabidopsis seedlings. Transcript levels of AtPITP7 were normalized against that of ACT2. B) Correlation between AtPITP7 expression level and Pi uptake activity. C) Relative LUC activity derived from the expression of LUC reporter gene under the control of Col-0-, Ler-0-, Ws-0-, Old-1-, Sorbo-, or Rsch-4-type AtPITP7 promoter in Arabidopsis protoplasts. In A, C), data represent mean ± Sd of 4 biological replicates, and different letters above bars indicate statistically significant differences (P < 0.05; Tukey's multiple comparison test).
Figure 3.
Figure 3.
Pi uptake and Pi deficiency responses of ospitp6-3 mutant and OsPITP6 overexpression (Ubi:OsPITP6) rice lines. A) Image and B) quantification of 32P-labeled Pi uptake in WT, ospitp6-3, and UBI:OsPITP6 seedlings grown in 0.5× Yoshida nutrient solution for 7 d (after germination) and then in low Pi nutrient solution for 5 d. C) Pi concentration in shoots and roots of WT, ospitp6-3, and Ubi:OsPITP6 seedlings grown in 0.5× Yoshida nutrient solution for 7 d (after germination) and then in the control Pi nutrient solution for 5 d. D) Phenotype, E) height, F) fresh shoot weight, G) root length, and H) fresh root weight of WT, ospitp6-3, and Ubi:OsPITP6 seedlings grown in 0.5× Yoshida solution for 7 d and then in the control Pi (100 µM) nutrient solution for 10 d. The seedlings were finally grown in the control Pi or low Pi (2 µM) nutrient solution for 25 d. Scale bar = 10 cm. In B), C), and E to H), data represent mean ± Sd of 4 C) or 5 B) and E to H) biological replicates, and different letters above bars indicate statistically significant differences (P < 0.05; Tukey's multiple comparison test).
Figure 4.
Figure 4.
Characterization of the necrotic phenotype of ospitp6-3 leaves. A) Photographs of 3-w-old WT, ospitp6-3, and Ubi:OsPITP6 (L6) seedlings grown in soil in the greenhouse under long-day conditions (16 h light/8 h dark) with a halide lamp (light intensity: 1,100 μmol m−2 s−1). B) Leaf color and Fv/Fm image, C)Fv/Fm ratio, D) total chlorophyll (Chl) content, and E) levels of photosynthesis-associated proteins (CP43, Lhcb1, Lhca1, RbcL, and α-tubulin) in the base, middle (mid), and tip regions of leaf blades of 45-d-old WT, ospitp6-3, and Ubi:OsPITP6 (L6) plants grown in the soil. F) Singlet Oxygen Sensor Green (SOSG) fluorescence image showing singlet oxygen production in the base, middle (mid), and tip regions of the leaf blades of 45-d-old WT and ospitp6-3 rice plants. G) RT-qPCR analysis of cell-death marker genes (OsACD1 and OsNAC4) in the base, middle (mid), and tip regions of the leaf blades of 45-d-old WT and ospitp6-3 plants. Gene transcript levels were normalized first against the transcript level of OsUBQ5 and then against the value obtained from the base of WT leaf blades. Data represent the mean ± Sd of 5 C) or 4 D) biological replicates. In C, D), asterisks indicate significant differences between WT and ospitp6-3 samples (*P < 0.05, **P < 0.01; Student's t-test). In G), different letters above bars indicate statistically significant differences (P < 0.05; Tukey's multiple comparison test).
Figure 5.
Figure 5.
Agronomic traits of ospitp6-3 and UBI:OsPITP6 rice plants. A) Photographs of 50-d-, and 120-d-old WT, ospitp6-3, and Ubi:OsPITP6 (L8) rice plants grown in soil. B) Tiller number of 15-d-, 35-d-, 50-d-, 65-d-, 75-d-, 100-d-, and 120-d-old soil-grown WT, ospitp6-3, and Ubi:OsPITP6 (L6 and L8) plants. Horizontal lines in the box denote median values. Boxes extend from the 25th percentile to the 75th percentile of each line's distribution of values. Dots denote observations outside the range of adjacent values. C) Height, D) panicle length, E) seed fertility, F) panicle phenotype, and G) grain number per H) panicle 100-grain weight, I) tiller number, J) and yield per plant of 150-d-old WT, ospitp6-3, and Ubi:OsPITP6 (L6 and L8) plants grown in soil. In B), C to E), and G to J), data represent mean ± Sd of 5 biological replicates, and different letters above bars indicate statistically significant differences (P < 0.05; Tukey's multiple comparison test).
Figure 6.
Figure 6.
Phospholipid and glycolipid contents of the leaves and chloroplasts of WT, ospitp6-3, and UBI:OsPITP6 plants. A, B) Relative phospholipid and glycolipid contents of A) leaves and B) chloroplasts of 4-w-old WT, ospitp6-3, and Ubi:OsPITP6 (L8) seedlings that were grown in 0.5× Yoshida nutrient solution for 2 w and then in the control or low Pi nutrient solution for 2 w. Values obtained in ospitp6-3 and Ubi:OsPITP6 (L8) seedlings were normalized relative to those obtained in WT seedlings grown in the control nutrient solution. PI, phosphatidylinositol; PA, phosphatidic acid; PG, phosphatidylglycerol; PC, phosphatidylcholine; MGDG, monogalactosyldiacylglycerol; DGDG, digalactosyldiacylglycerol; SQDG, sulfoquinovosyldiacylglycerol. C) Glucuronosyl diacylglycerol (GlcADG) content in whole leaf samples. In A) to C), data represent mean ± Sd of 5 biological replicates, and different letters above bars indicate statistically significant differences (P < 0.05; Tukey's multiple comparison test). Principal component analysis (PCA) of PI, PA, PG, PC, MGDG, DGDG, and SQDG in D) leaves and E) chloroplasts of 4-w-old WT, ospitp6-3, and Ubi:OsPITP6 (L8) seedlings. PC1 and PC2 explained 64.32% and 13.05% of the variation, respectively, in D) and 50.33% and 16.63% of the variation, respectively, in E).
Figure 7.
Figure 7.
Antagonistic effects of OsPITP6 overexpression and inactivation on Pi-related gene expression. Venn diagrams representing numbers of A) upregulated (FC > 2) genes and B) downregulated (FC < 0.5) genes in the DNA microarray analysis of shoots and roots of WT and ospitp6-3 plants grown first in 0.5× Yoshida solution for 7 d and then grown in soil for 3 w. Pi-responsive genes downregulated in both the shoots and roots of ospitp6-3 plants are indicated. C)ospitp6-3 allele-dependent modulations in the expression levels of Pi uptake-, translocation-, and signaling-related genes. RT-qPCR analysis of the expression levels of D)PT9, E)PT10, F)PT14, G)PHO1;1, H)PHO1;2, and I)PHO1;3 in the roots of WT, ospitp6-3, and Ubi:OsPITP6 (L6 and L8) plants grown in 0.5× Yoshida solution for 7 d and then in soil for 3 w. Data represent mean ± Sd of 5 biological replicates, and different letters above bars indicate statistically significant differences (P < 0.05; Tukey's multiple comparison test).
Figure 8.
Figure 8.
AtPITP7 inactivation in shoots causes root growth impairment and reduced Pi uptake in roots. A) Phenotype, B) fresh root weight, C) root length, D)33P-labeled Pi uptake, and E) Pi content of grafted Arabidopsis seedlings generated using WT and atpitp7-2 scions and rootstocks. Grafted seedlings were grown on 1/2 MS agar plates for 3 d and then on control or low Pi agar plates for 5 d. F) RT-qPCR analysis of PHT1;1, PHT1;9, and PHO1;H1 in the rootstocks of grafted seedlings treated with Pi deficiency stress for 5 d. Expression levels of these genes were normalized first against the transcript level of ACT2 and then against the values obtained from WT/WT grafted seedlings grown on control Pi agar plates. Data represent mean ± Sd of 6 B), C), and E); 5 D); and 4 F) biological replicates. Different letters above bars indicate statistically significant differences (P < 0.05 level; Tukey's multiple comparison test).

Comment in

References

    1. Abel S, Ticconi CA, Delatorre CA. Phosphate sensing in higher plants. Physiol Plant. 2002:115(1):1–8. 10.1034/j.1399-3054.2002.1150101.x - DOI - PubMed
    1. Allen-Baume V, Se B, Cockcroft S, Dennis EA, Varela-Nieto I, Alonso A. Current thoughts on the phosphatidylinositol transfer protein family. FEBS Lett. 2002:531(1):74–80. 10.1016/S0014-5793(02)03412-9 - DOI - PubMed
    1. Apel K, Hirt H. Reactive oxygen species: metabolism, oxidative stress, and signal transduction. Annu Rev Plant Biol. 2004:55(1):373–399. 10.1146/annurev.arplant.55.031903.141701 - DOI - PubMed
    1. Bari R, Pant BD, Stitt M, Scheible WR. PHO2, microRNA399, and PHR1 define a phosphate-signaling pathway in plants. Plant Physiol. 2006:141(3):988–999. 10.1104/pp.106.079707 - DOI - PMC - PubMed
    1. Böhme K, Li Y, Charlot F, Grierson C, Marrocco K, Okada K, Laloue M, Nogué F. The Arabidopsis COW1 gene encodes a phosphatidylinositol transfer protein essential for root hair tip growth. Plant J. 2004:40(5):686–698. 10.1111/j.1365-313X.2004.02245.x - DOI - PubMed

Publication types

MeSH terms