. 2023 Oct 1;78(4):1168-1181.
doi: 10.1097/HEP.0000000000000383. Epub 2023 Apr 10.

Global and national prevalence of nonalcoholic fatty liver disease in adolescents: An analysis of the global burden of disease study 2019

Affiliations

Global and national prevalence of nonalcoholic fatty liver disease in adolescents: An analysis of the global burden of disease study 2019

Phillipp Hartmann et al. Hepatology. .

Abstract

Background and aims: NAFLD in adolescents is an increasing health crisis worldwide, but its exact global, continental, and national prevalence, its relationship with other metabolic conditions, and the human development index (HDI) globally are not known.

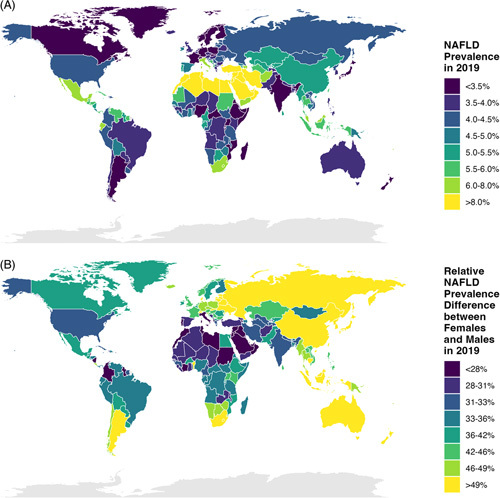
Approach and results: We analyzed data from the Global Burden of Disease Study 2019 to compare global, continental, and national prevalence rates of adolescent NAFLD and associations with other metabolic conditions and HDI. The global NAFLD prevalence in adolescents increased from 3.73% in 1990 to 4.71% in 2019 (a relative increase of 26.27%). The prevalence for the male and female populations was 5.84% and 3.52% in 2019, respectively. The Oceanian and North American continents had the highest adolescent NAFLD prevalence (median: 6.54% and 5.64%, respectively), whereas Europe had the lowest prevalence (median: 3.98%). South America and North America had the highest relative increase in adolescent NAFLD prevalence from 1990 to 2019 (median: 39.25% and 36.87%, respectively). High body mass index and type 2 diabetes mellitus increased significantly in adolescents worldwide. However, only high body mass index and not type 2 diabetes mellitus correlated with NAFLD prevalence in adolescents globally. Countries with a higher HDI had larger increases in adolescent NAFLD prevalence from 1990 to 2019 although countries with the highest HDI (HDI: > 0.9) had the lowest NAFLD prevalence in 2019.

Conclusions: NAFLD in adolescents is an increasing health problem on all continents. Improving environmental factors, including lifestyle but also healthcare policies, can help to prevent NAFLD from developing in children and adolescents and help to improve outcomes in children and adolescents with NAFLD.


Conflict of interest statement

Bernd Schnabl consults for Ambys Medicines, Ferring Research Institute, Gelesis, HOST Therabiomics, Intercept Pharmaceuticals, Mabwell Therapeutics, Patara Pharmaceuticals and Takeda. Bernd Schnabl’s institution UC San Diego has received grant support from Artizan Biosciences, Axial Biotherapeutics, BiomX, CymaBay Therapeutics, NGM Biopharmaceuticals, Prodigy Biotech and Synlogic Operating Company. The remaining authors have no conflicts to report.

Figures

None
Graphical abstract
FIGURE 1
FIGURE 1
Countries on the Arabian Peninsula and African and Asian countries bordering the Mediterranean Sea have the highest global prevalence of NAFLD in adolescents. Countries and territories, n = 202. (A) Prevalence of adolescent NAFLD per country and territory in 2019. (B) Relative prevalence difference of adolescent NAFLD between female population and male population per country and territory in 2019.
FIGURE 2
FIGURE 2
The NAFLD prevalence in adolescents increased consistently on a global level from 1990 to 2019. (A) Global NAFLD prevalence in adolescents from 1990 to 2019. (B) Global relative annual increase in NAFLD prevalence in adolescents between 1990 and 2019. (C) Relative increase in adolescent NAFLD prevalence per country and territory between 1990 and 2019 (n = 202). Total adolescent population is in the black, male population is in the blue, and female population is in the red. For A and B, the Pearson correlation coefficient R indicates the strength of correlation and adjusted p values after the Bonferroni correction is shown. Statistical significance is indicated by p < 0.05. Abbreviation: NAFLD, nonalcoholic fatty liver disease; prev, prevalence.
FIGURE 3
FIGURE 3
Oceania and North America have the highest NAFLD prevalence in adolescents. Countries and territories overall, n = 202. Africa (n = 54), Asia (n = 47), Europe (n = 46), North America (n = 28), Oceania (n = 15), and South America (n = 12). (A) Prevalence of adolescent NAFLD per continent in 2019. (B) Relative annual change in adolescent NAFLD prevalence medians per continent between 1990 and 2019. (C) Relative increase in NAFLD prevalence in adolescents per continent from 1990 to 2019. (D) Absolute increase in adolescent NAFLD prevalence per continent from 1990 to 2019. (E) Longitudinal comparison of medians in 1990, 2000, 2010, and 2019 separately by continent. North America [median2019 5.64% (IQR: 0.91%) vs median1990 4.06% (IQR: 0.83%), p < 0.001; median2019 vs median2000 4.71% (IQR: 0.95%), p = 0.036; and median2010 5.24% (IQR: 0.82%) vs median1990, p = 0.002], Europe [median2019 3.98% (IQR: 0.85%) vs median1990 3.14% (IQR: 0.71%), p < 0.001; median2019 vs median2000 3.40% (IQR: 0.59%), p = 0.029; and median2010 3.71% (IQR: 0.63%) vs median1990, p = 0.002], and Africa [median2019 4.20% (IQR: 1.43%) vs median1990 3.55% (IQR: 0.83%), p = 0.031] were the only continents, for which the prevalences in 2010 and/or 2019 were significantly increased compared with the years 1990 and/or 2000. For the box and whisker plots (A, C, and D), the box extends from the 25th to 75th percentiles, with the center line indicating the median; the bottom whiskers indicate the minimum values, and the top whiskers indicate the 75th percentile plus 1.5-fold the interquartile distance (the distance between the 25th and 75th percentiles). For A, C, D, and E, the Kruskal-Wallis test was statistically significant, and significantly adjusted p values per pairwise (A, C, and D) unpaired or (E) paired Wilcoxon-Whitney-Mann rank-sum test with the Bonferroni correction are shown as indicated. For B, the Pearson correlation coefficient R indicates the strength of correlation and adjusted p values after the Bonferroni correction is shown. (A–D) Statistical significance is present if p < 0.05 and is indicated for E by “a” = significant difference between the respective column and 1990, and “b” = significant difference between the respective column and 2000. Abbreviations: NAFLD, nonalcoholic fatty liver disease; prev, prevalence; rel, relative.
FIGURE 4
FIGURE 4
High BMI and T2DM prevalence increased significantly globally in adolescents from 1990 to 2019. (A) Global rate of overweight/obesity marker SEV-high BMI from 1990 to 2019. (B) Rate of SEV-high BMI per country and territory in 2019 (n = 202). (C) Global T2DM prevalence in adolescents from 1990 to 2019. (D) T2DM prevalence in adolescents per country and territory in 2019 (n = 201). Total adolescent population is in the black, male population is in the blue, and female population is in the red. For A and C, the Pearson correlation coefficient R indicates the strength of correlation and adjusted p values after the Bonferroni correction is shown. Statistical significance is indicated by p < 0.05. Abbreviation: BMI, body-mass index; NAFLD, nonalcoholic fatty liver disease; SEV, summary exposure value; T2DM, type 2 diabetes mellitus.
FIGURE 5
FIGURE 5
High BMI but not T2DM correlates with NAFLD prevalence in adolescents overall, but T2DM correlates with NAFLD on certain continents. Countries and territories overall, n = 202 [except (C and D) n = 201]. Africa (n = 54), Asia (n = 47), Europe (n = 46), North America (n = 28), Oceania (n = 15), and South America [n = 12, except (C and D) n = 11]. (A and B) Relationship between rate of overweight/obesity marker SEV-high BMI and NAFLD prevalence in adolescents in 2019 (A) with overall correlation and (B) correlation per continent. (C and D) Relationship between prevalence of T2DM and NAFLD in adolescents in 2019 (C) with overall correlation and (D) correlation per continent. The Pearson correlation coefficient R indicates the strength of correlation (overall in black, other colors per continent), and (B and D) adjusted p values after the Bonferroni correction are shown. Statistical significance is indicated by p < 0.05. Abbreviation: BMI, body-mass index; NAFLD, nonalcoholic fatty liver disease; SEV, summary exposure value; T2DM, type 2 diabetes mellitus.
FIGURE 6
FIGURE 6
Countries with higher HDIs have greater increases in NAFLD prevalence, although countries with the highest HDIs (HDI > 0.9) have the lowest NAFLD prevalence in adolescents. Countries and territories overall, n = 187. “Low HDI”, HDI < 0.55 (n = 33); “medium HDI”, HDI 0.55- < 0.70 (n = 37); “high HDI”, HDI 0.70- < 0.80 (n = 53); and “very high HDI”, HDI ≥ 0.80 (n = 64). (A–C) Relationship between (A) HDI and prevalence of NAFLD in adolescents in 2019, (B) HDI and relative increase in NAFLD prevalence in adolescents from 1990 to 2019, and (C) HDI and absolute increase in NAFLD prevalence in adolescents from 1990 to 2019. (D) Prevalence of adolescent NAFLD per HDI group in 2019. (E) Relative increase in NAFLD prevalence in adolescents per HDI group from 1990 to 2019. (F) Absolute increase in adolescent NAFLD prevalence per HDI group from 1990 to 2019. (G) Prevalence of NAFLD in adolescents between HDI > 0.9 and HDI ≤ 0.9 groups in 2019. (H) Relative increase in adolescent NAFLD prevalence between HDI > 0.9 and HDI ≤ 0.9 groups from 1990 to 2019. (I) Absolute increase in adolescent NAFLD prevalence between HDI > 0.9 and HDI ≤ 0.9 groups from 1990 to 2019. For the box and whisker plots (D–I), the box extends from the 25th to 75th percentiles, with the center line indicating the median; the bottom whiskers indicate the minimum values, and the top whiskers indicate the 75th percentile plus 1.5-fold the interquartile distance (the distance between the 25th and 75th percentiles). For D–F, the Kruskal-Wallis test was statistically significant, and significantly adjusted p values per the pairwise Wilcoxon-Whitney-Mann rank-sum test with the Bonferroni correction are shown as indicated. For G–I, p values per the Wilcoxon-Whitney-Mann rank-sum test are shown. The Pearson correlation coefficient R indicates the strength of correlation. Statistical significance is indicated by p < 0.05. Abbreviation: HDI, human development index; NAFLD, nonalcoholic fatty liver disease; prev, prevalence.

Comment in

Similar articles

Cited by

References

    1. Eslam M, Alkhouri N, Vajro P, Baumann U, Weiss R, Socha P, et al. Defining paediatric metabolic (dysfunction)-associated fatty liver disease: an international expert consensus statement. Lancet Gastroenterol Hepatol. 2021;6:864–73. - PubMed
    1. Angulo P. Nonalcoholic fatty liver disease. N Engl J Med. 2002;346:1221–31. - PubMed
    1. Vos MB, Abrams SH, Barlow SE, Caprio S, Daniels SR, Kohli R, et al. NASPGHAN Clinical Practice Guideline for the Diagnosis and Treatment of Nonalcoholic Fatty Liver Disease in Children: Recommendations from the Expert Committee on NAFLD (ECON) and the North American Society of Pediatric Gastroenterology, Hepatology and Nutrition (NASPGHAN). J Pediatr Gastroenterol Nutr. 2017;64:319–34. - PMC - PubMed
    1. Nobili V, Alisi A, Valenti L, Miele L, Feldstein AE, Alkhouri N. NAFLD in children: new genes, new diagnostic modalities and new drugs. Nat Rev Gastroenterol Hepatol. 2019;16:517–30. - PubMed
    1. Schwimmer JB, Pardee PE, Lavine JE, Blumkin AK, Cook S. Cardiovascular risk factors and the metabolic syndrome in pediatric nonalcoholic fatty liver disease. Circulation. 2008;118:277–83. - PMC - PubMed

Publication types