Comprehensive Surface Histology of Fresh Resection Margins With Rapid Open-Top Light-Sheet (OTLS) Microscopy
- PMID: 37021859
- PMCID: PMC10324671
- DOI: 10.1109/TBME.2023.3237267
Comprehensive Surface Histology of Fresh Resection Margins With Rapid Open-Top Light-Sheet (OTLS) Microscopy
Abstract
Objective: For tumor resections, margin status typically correlates with patient survival but positive margin rates are generally high (up to 45% for head and neck cancer). Frozen section analysis (FSA) is often used to intraoperatively assess the margins of excised tissue, but suffers from severe under-sampling of the actual margin surface, inferior image quality, slow turnaround, and tissue destructiveness.
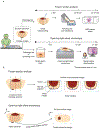
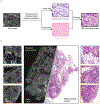
Methods: Here, we have developed an imaging workflow to generate en face histologic images of freshly excised surgical margin surfaces based on open-top light-sheet (OTLS) microscopy. Key innovations include (1) the ability to generate false-colored H&E-mimicking images of tissue surfaces stained for < 1 min with a single fluorophore, (2) rapid OTLS surface imaging at a rate of 15 min/cm2 followed by real-time post-processing of datasets within RAM at a rate of 5 min/cm2, and (3) rapid digital surface extraction to account for topological irregularities at the tissue surface.
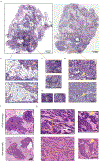
Results: In addition to the performance metrics listed above, we show that the image quality generated by our rapid surface-histology method approaches that of gold-standard archival histology.
Conclusion: OTLS microscopy has the feasibility to provide intraoperative guidance of surgical oncology procedures.
Significance: The reported methods can potentially improve tumor-resection procedures, thereby improving patient outcomes and quality of life.
Figures


Similar articles
-
Intraoperative frozen section analysis for the diagnosis of early stage ovarian cancer in suspicious pelvic masses.Cochrane Database Syst Rev. 2016 Mar 1;3(3):CD010360. doi: 10.1002/14651858.CD010360.pub2. Cochrane Database Syst Rev. 2016. PMID: 26930463 Free PMC article.
-
Accuracy of Frozen Section Analysis of Urethral and Ureteral Margins During Radical Cystectomy for Bladder Cancer: A Systematic Review and Diagnostic Meta-Analysis.Eur Urol Focus. 2022 May;8(3):752-760. doi: 10.1016/j.euf.2021.05.010. Epub 2021 Jun 12. Eur Urol Focus. 2022. PMID: 34127436
-
Comparison of Two Modern Survival Prediction Tools, SORG-MLA and METSSS, in Patients With Symptomatic Long-bone Metastases Who Underwent Local Treatment With Surgery Followed by Radiotherapy and With Radiotherapy Alone.Clin Orthop Relat Res. 2024 Dec 1;482(12):2193-2208. doi: 10.1097/CORR.0000000000003185. Epub 2024 Jul 23. Clin Orthop Relat Res. 2024. PMID: 39051924
-
Magnetic resonance perfusion for differentiating low-grade from high-grade gliomas at first presentation.Cochrane Database Syst Rev. 2018 Jan 22;1(1):CD011551. doi: 10.1002/14651858.CD011551.pub2. Cochrane Database Syst Rev. 2018. PMID: 29357120 Free PMC article.
-
What Are the Complications, Function, and Survival of Tumor-devitalized Autografts Used in Patients With Limb-sparing Surgery for Bone and Soft Tissue Tumors? A Japanese Musculoskeletal Oncology Group Multi-institutional Study.Clin Orthop Relat Res. 2023 Nov 1;481(11):2110-2124. doi: 10.1097/CORR.0000000000002720. Epub 2023 Jun 14. Clin Orthop Relat Res. 2023. PMID: 37314384 Free PMC article.
Cited by
-
Perspective on the use of fluorescence molecular imaging for peripheral and deep en face margin assessment.J Biomed Opt. 2025 Jan;30(Suppl 1):S13711. doi: 10.1117/1.JBO.30.S1.S13711. Epub 2025 May 2. J Biomed Opt. 2025. PMID: 40321301 Free PMC article. Review.
-
Open-top Bessel beam two-photon light sheet microscopy for three-dimensional pathology.Elife. 2024 Mar 15;12:RP92614. doi: 10.7554/eLife.92614. Elife. 2024. PMID: 38488831 Free PMC article.
-
An end-to-end workflow for non-destructive 3D pathology.bioRxiv [Preprint]. 2023 Aug 6:2023.08.03.551845. doi: 10.1101/2023.08.03.551845. bioRxiv. 2023. Update in: Nat Protoc. 2024 Apr;19(4):1122-1148. doi: 10.1038/s41596-023-00934-4. PMID: 37577615 Free PMC article. Updated. Preprint.
-
Deep-learning triage of 3D pathology datasets for comprehensive and efficient pathologist assessments.bioRxiv [Preprint]. 2025 Jul 22:2025.07.20.665804. doi: 10.1101/2025.07.20.665804. bioRxiv. 2025. PMID: 40777412 Free PMC article. Preprint.
-
Single color digital H&E staining with In-and-Out Net.Comput Med Imaging Graph. 2024 Dec;118:102468. doi: 10.1016/j.compmedimag.2024.102468. Epub 2024 Nov 20. Comput Med Imaging Graph. 2024. PMID: 39579455
References
Publication types
MeSH terms
Grants and funding
LinkOut - more resources
Full Text Sources
Research Materials

