

Extracellular Vesicle ITGAM and ITGB2 Mediate Severe Acute Pancreatitis-Related Acute Lung Injury
- PMID: 37022097
- PMCID: PMC10134486
- DOI: 10.1021/acsnano.2c12722
Extracellular Vesicle ITGAM and ITGB2 Mediate Severe Acute Pancreatitis-Related Acute Lung Injury
Abstract
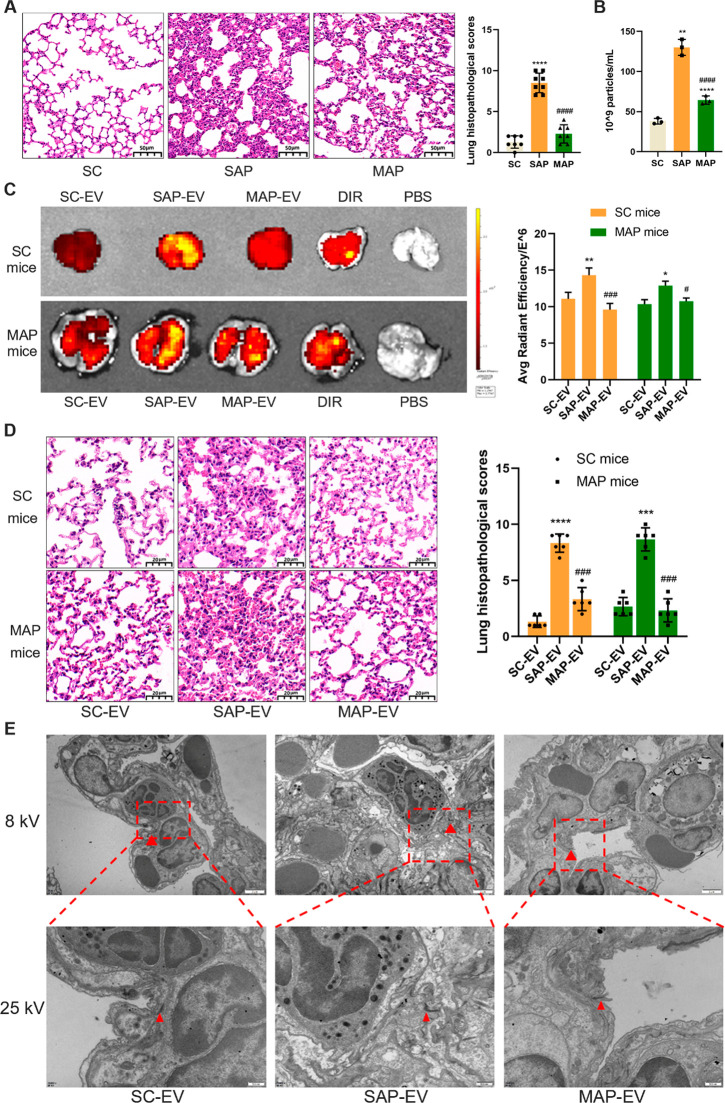
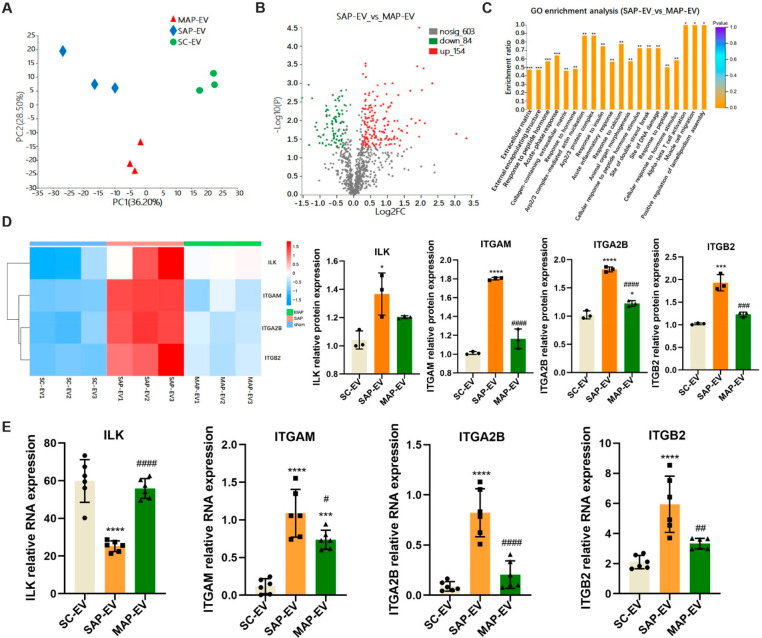
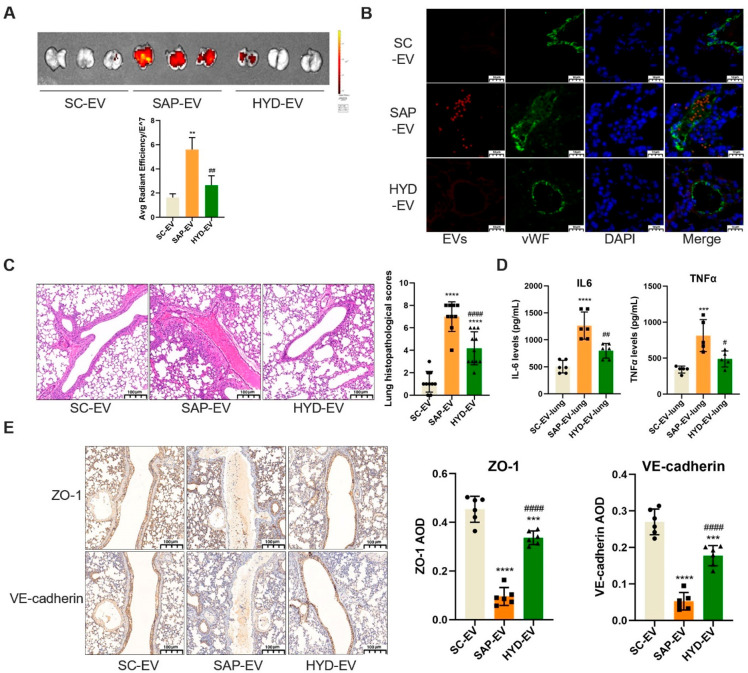
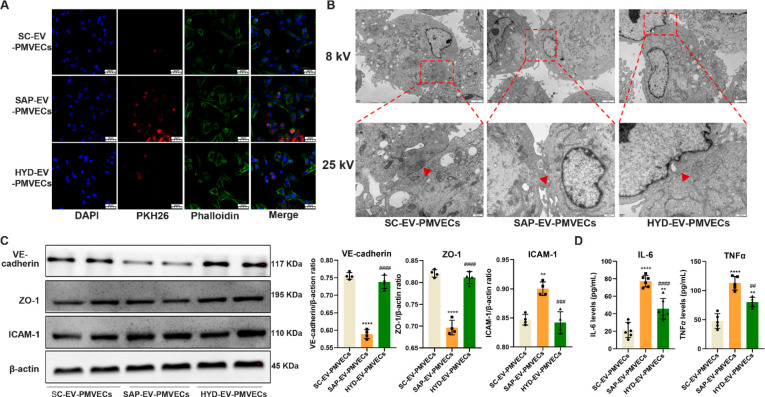
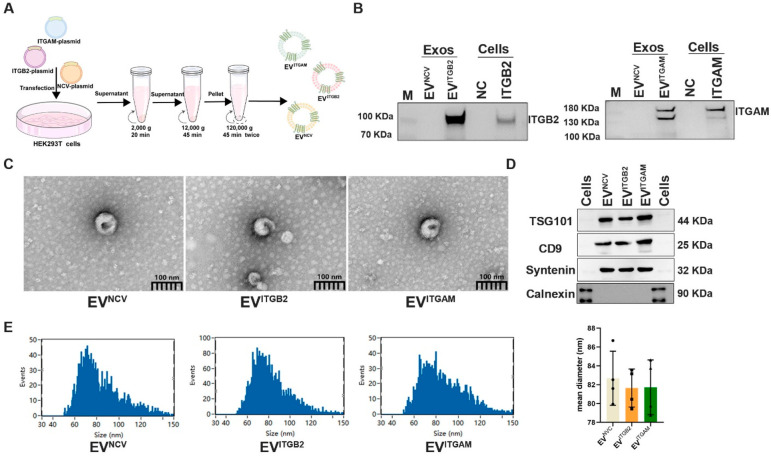
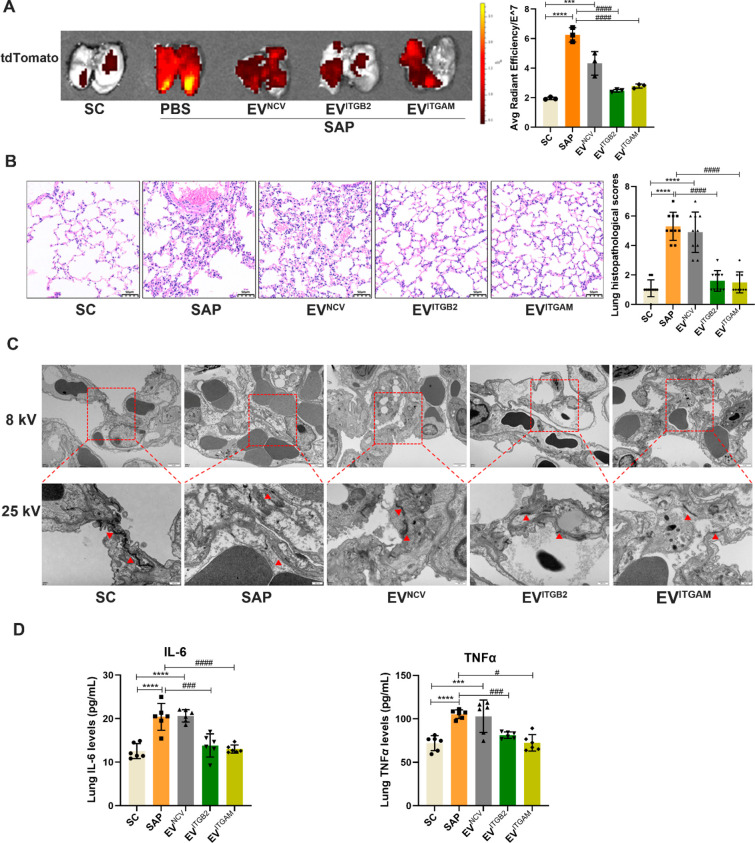
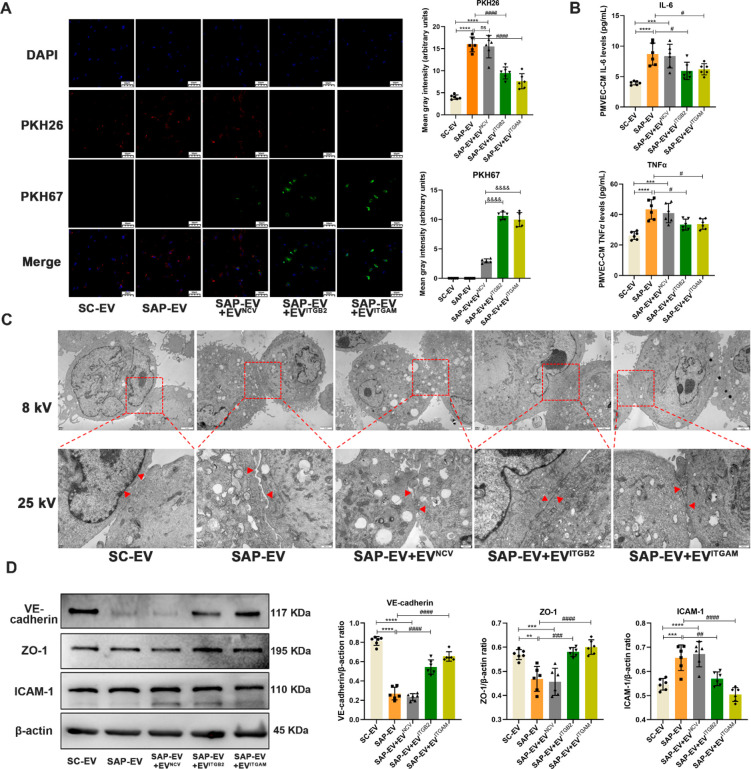
Integrins expressed on extracellular vesicles (EVs) secreted by various cancers are reported to mediate the organotropism of these EVs. Our previous experiment found that pancreatic tissue of mice with severe cases of acute pancreatitis (SAP) overexpresses several integrins and that serum EVs of these mice (SAP-EVs) can mediate acute lung injury (ALI). It is unclear if SAP-EV express integrins that can promote their accumulation in the lung to promote ALI. Here, we report that SAP-EV overexpress several integrins and that preincubation of SAP-EV with the integrin antagonist peptide HYD-1 markedly attenuates their pulmonary inflammation and disrupt the pulmonary microvascular endothelial cell (PMVEC) barrier. Further, we report that injecting SAP mice with EVs engineered to overexpress two of these integrins (ITGAM and ITGB2) can attenuate the pulmonary accumulation of pancreas-derived EVs and similarly decrease pulmonary inflammation and disruption of the endothelial cell barrier. Based on these findings, we propose that pancreatic EVs can mediate ALI in SAP patients and that this injury response could be attenuated by administering EVs that overexpress ITGAM and/or ITGB2, which is worthy of further study due to the lack of effective therapies for SAP-induced ALI.
Keywords: acute lung injury; extracellular vesicles; integrin α M; integrin β 2; pulmonary microvascular endothelial cells; severe acute pancreatitis.
Conflict of interest statement
The authors declare no competing financial interest.
Figures
Similar articles
-
Stem Cell-Derived Extracellular Vesicles for Acute Pancreatitis: a Systematic Review and Meta-analysis of Preclinical Studies.Stem Cell Rev Rep. 2025 Apr;21(3):767-778. doi: 10.1007/s12015-025-10852-5. Epub 2025 Feb 14. Stem Cell Rev Rep. 2025. PMID: 39964640 Free PMC article.
-
MicroRNA-339-3p alleviates inflammation and edema and suppresses pulmonary microvascular endothelial cell apoptosis in mice with severe acute pancreatitis-associated acute lung injury by regulating Anxa3 via the Akt/mTOR signaling pathway.J Cell Biochem. 2018 Aug;119(8):6704-6714. doi: 10.1002/jcb.26859. Epub 2018 Apr 25. J Cell Biochem. 2018. Retraction in: J Cell Biochem. 2021 Nov;122 Suppl 1:S107. doi: 10.1002/jcb.30087. PMID: 29693276 Retracted.
-
Alleviation of acute pancreatitis-associated lung injury by inhibiting the p38 mitogen-activated protein kinase pathway in pulmonary microvascular endothelial cells.World J Gastroenterol. 2021 May 14;27(18):2141-2159. doi: 10.3748/wjg.v27.i18.2141. World J Gastroenterol. 2021. PMID: 34025070 Free PMC article.
-
Calycosin attenuates severe acute pancreatitis-associated acute lung injury by curtailing high mobility group box 1 - induced inflammation.World J Gastroenterol. 2021 Nov 28;27(44):7669-7686. doi: 10.3748/wjg.v27.i44.7669. World J Gastroenterol. 2021. PMID: 34908806 Free PMC article.
-
Intestinal barrier damage, systemic inflammatory response syndrome, and acute lung injury: A troublesome trio for acute pancreatitis.Biomed Pharmacother. 2020 Dec;132:110770. doi: 10.1016/j.biopha.2020.110770. Epub 2020 Oct 2. Biomed Pharmacother. 2020. PMID: 33011613 Review.
Cited by
-
ITGAM sustains MAPK signaling and serves as an adverse prognostic factor and therapeutic target in acute myeloid leukemia.Transl Cancer Res. 2024 Jun 30;13(6):3062-3074. doi: 10.21037/tcr-24-810. Epub 2024 Jun 27. Transl Cancer Res. 2024. PMID: 38988941 Free PMC article.
-
MiRNAs and Neutrophil-Related Membrane Proteins from Plasma-Derived Extracellular Vesicles for Early Prediction of Organ Dysfunction and Prognosis in Septic Patients.J Inflamm Res. 2024 Dec 4;17:10347-10369. doi: 10.2147/JIR.S492902. eCollection 2024. J Inflamm Res. 2024. PMID: 39649421 Free PMC article.
-
Stem Cell-Derived Extracellular Vesicles for Acute Pancreatitis: a Systematic Review and Meta-analysis of Preclinical Studies.Stem Cell Rev Rep. 2025 Apr;21(3):767-778. doi: 10.1007/s12015-025-10852-5. Epub 2025 Feb 14. Stem Cell Rev Rep. 2025. PMID: 39964640 Free PMC article.
-
NOD1 promotes leukocyte clearance and limits inflammation in female mice during obesity-associated acute lung injury.Physiol Rep. 2025 Jul;13(13):e70446. doi: 10.14814/phy2.70446. Physiol Rep. 2025. PMID: 40616268 Free PMC article.
-
hP-MSCs attenuate severe acute pancreatitis in mice via inhibiting NLRP3 inflammasome-mediated acinar cell pyroptosis.Apoptosis. 2024 Jun;29(5-6):920-933. doi: 10.1007/s10495-024-01946-5. Epub 2024 Apr 16. Apoptosis. 2024. PMID: 38625481
References
-
- Banks P. A.; Bollen T. L.; Dervenis C.; Gooszen H. G.; Johnson C. D.; Sarr M. G.; Tsiotos G. G.; Vege S. S. Classification of acute pancreatitis--2012: revision of the Atlanta classification and definitions by international consensus. Gut 2013, 62 (1), 102–11. 10.1136/gutjnl-2012-302779. - DOI - PubMed
Publication types
MeSH terms
Substances
LinkOut - more resources
Full Text Sources
Medical
Research Materials
Miscellaneous
