. 2023 Jul 1;34(7):1279-1291.
doi: 10.1681/ASN.0000000000000141. Epub 2023 Apr 5.

Unbiased Human Kidney Tissue Proteomics Identifies Matrix Metalloproteinase 7 as a Kidney Disease Biomarker

Affiliations

Unbiased Human Kidney Tissue Proteomics Identifies Matrix Metalloproteinase 7 as a Kidney Disease Biomarker

Daigoro Hirohama et al. J Am Soc Nephrol. .

Abstract

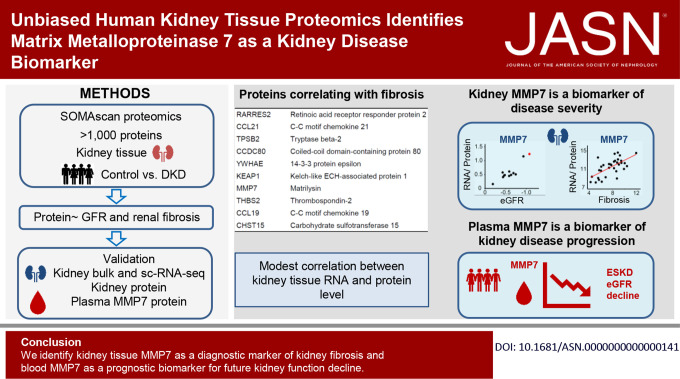
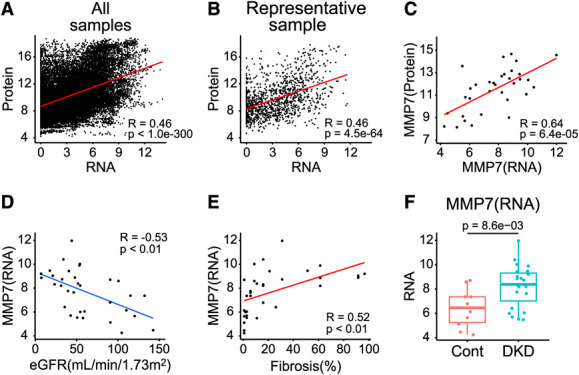
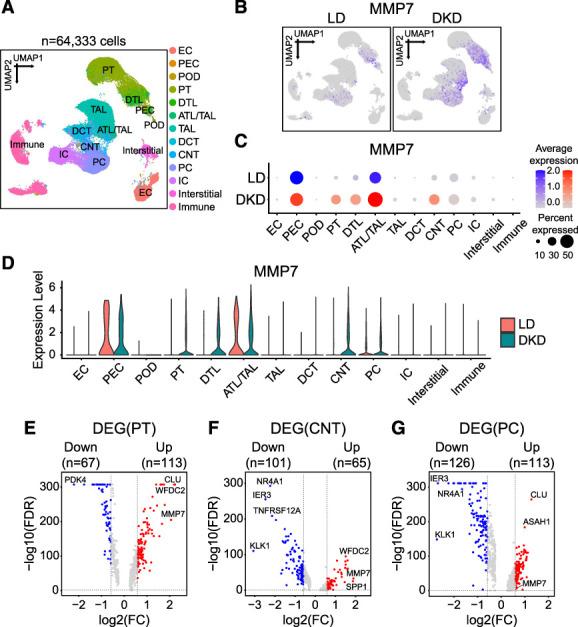
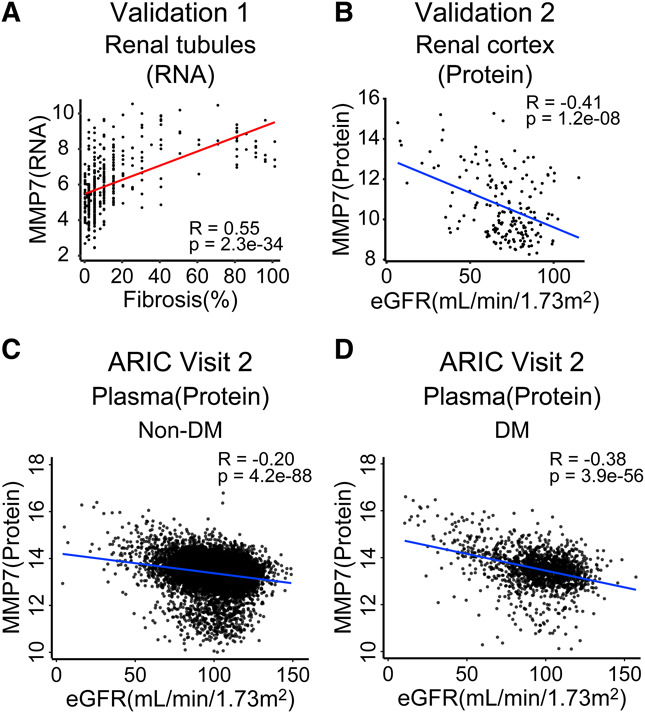
Significance statement: Although gene expression changes have been characterized in human diabetic kidney disease (DKD), unbiased tissue proteomics information for this condition is lacking. The authors conducted an unbiased aptamer-based proteomic analysis of samples from patients with DKD and healthy controls, identifying proteins with levels that associate with kidney function (eGFR) or fibrosis, after adjusting for key covariates. Overall, tissue gene expression only modestly correlated with tissue protein levels. Kidney protein and RNA levels of matrix metalloproteinase 7 (MMP7) strongly correlated with fibrosis and with eGFR. Single-cell RNA sequencing indicated that kidney tubule cells are an important source of MMP7. Furthermore, plasma MMP7 levels predicted future kidney function decline. These findings identify kidney tissue MMP7 as a biomarker of fibrosis and blood MMP7 as a biomarker for future kidney function decline.

Background: Diabetic kidney disease (DKD) is responsible for close to half of all ESKD cases. Although unbiased gene expression changes have been extensively characterized in human kidney tissue samples, unbiased protein-level information is not available.

Methods: We collected human kidney samples from 23 individuals with DKD and ten healthy controls, gathered associated clinical and demographics information, and implemented histologic analysis. We performed unbiased proteomics using the SomaScan platform and quantified the level of 1305 proteins and analyzed gene expression levels by bulk RNA and single-cell RNA sequencing (scRNA-seq). We validated protein levels in a separate cohort of kidney tissue samples as well as in 11,030 blood samples.

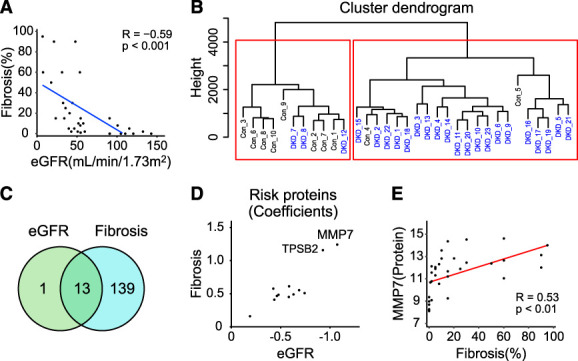
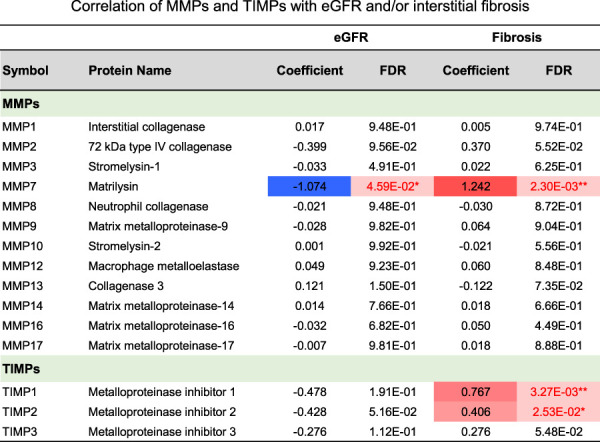
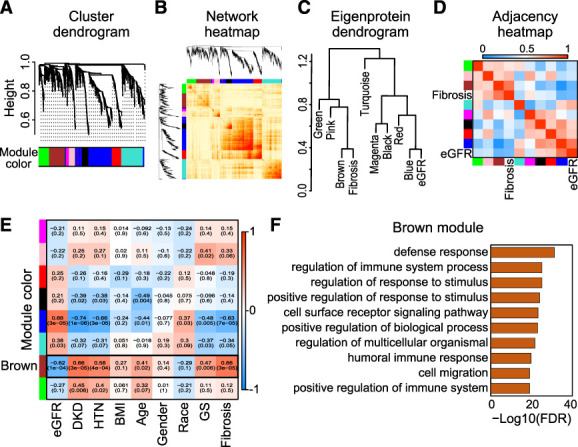
Results: Globally, human kidney transcript and protein levels showed only modest correlation. Our analysis identified 14 proteins with kidney tissue levels that correlated with eGFR and found that the levels of 152 proteins correlated with interstitial fibrosis. Of the identified proteins, matrix metalloprotease 7 (MMP7) showed the strongest association with both fibrosis and eGFR. The correlation between tissue MMP7 protein expression and kidney function was validated in external datasets. The levels of MMP7 RNA correlated with fibrosis in the primary and validation datasets. Findings from scRNA-seq pointed to proximal tubules, connecting tubules, and principal cells as likely cellular sources of increased tissue MMP7 expression. Furthermore, plasma MMP7 levels correlated not only with kidney function but also associated with prospective kidney function decline.

Conclusions: Our findings, which underscore the value of human kidney tissue proteomics analysis, identify kidney tissue MMP7 as a diagnostic marker of kidney fibrosis and blood MMP7 as a biomarker for future kidney function decline.


Figures

None
Graphical abstract
Figure 1
Figure 1
Unbiased proteomics analysis of human DKD kidney samples. (A) Scatterplot of eGFR (ml/min per 1.73 m2) and degree of interstitial fibrosis (Pearson R of −0.59). (B) Hierarchical clustering on the basis of proteomics data. (C) Venn diagram of proteins correlated with eGFR and interstitial fibrosis. (D) Scatterplot of correlation of coefficients between 12 proteins and eGFR and fibrosis. (E) Scatterplots of Matrix Metalloproteinase 7 (MMP7) expression measured by SOMAmer array (x axis) and degree of interstitial fibrosis (y axis) (Pearson R of 0.53). Figure 1 can be viewed in color online at www.jasn.org.
Figure 2
Figure 2
Correlation of matrix metalloproteases (MMPs) and inhibitor tissue inhibitor of metalloproteinases (TIMPs) with eGFR and/or interstitial fibrosis. Coefficients were derived using the linear regression model adjusted for age, sex, race, and BMI; P values were adjusted for FDR. *P < 0.05; **P < 0.01. Figure 2 can be viewed in color online at www.jasn.org.
Figure 3
Figure 3
WGCNA of human DKD kidney samples. (A) Hierarchical clustering dendrogram of the proteins. (B) Heatmap representing the topological overlap matrix among all proteins in the analysis. (C) Dendrogram of eight module eigenproteins and two clinical traits (eGFR and interstitial fibrosis). (D) Eigenprotein adjacency heatmap with eGFR and interstitial fibrosis (see Methods section). (E) Correlation of module eigenproteins with clinical characteristics. Each row corresponds to a module eigenprotein, and the columns are clinical traits. The values in the cells are presented as “Pearson R (P value)” and color-coded by direction and degree of the correlation (red=positive correlation; blue=negative correlation). (F) Gene ontology pathway analysis of the top pathways enriched in the protein sets of the WGCNA brown module. Con, control; GS, glomerular sclerosis; HTN, hypertension. Figure 3 can be viewed in color online at www.jasn.org.
Figure 4
Figure 4
Bulk RNA-seq displayed modest correlation with proteomics. (A) Correlation between kidney bulk RNA-seq and proteomics using all samples. (B) Correlation between bulk RNA-seq and proteomics using a representative sample. (C) Correlation of MMP7 expression between RNA and protein, with Pearson R of 0.64. (D) Correlation between MMP7 expression examined by bulk RNA-seq and eGFR, with Pearson R of −0.53. (E) Correlation between MMP7 expression examined by bulk RNA-seq and interstitial fibrosis, with Pearson R of 0.52. (F) Box plots showing MMP7 expression examined by bulk RNA-seq in DKD and control subjects. P values were calculated with the Wilcoxon rank-sum test (for two group comparison). Figure 4 can be viewed in color online at www.jasn.org.
Figure 5
Figure 5
Cellular expression of MMP7 in human kidney single-cell RNA-seq. (A) UMAP showing 13 cell clusters (see Methods section). Assigned cell types are summarized in the Supplemental Spreadsheet 6. (B) Feature plots showing the expression of MMP7 in DKD subjects and LD. (C) Bubble plots showing MMP7 expression across 13 clusters between DKD subjects and LD. The size of the circle indicates the percent of positive cells, and the color indicates the level of expression. (D) Violin plots showing the MMP7 expression across 13 clusters between DKD subjects and LD. (E–G) Volcano plots of DEGs between DKD and LD in PT (E), CNT (F), and PC (G) clusters identified in the single-cell data. The x axis is log2-FC, and y axis is the statistical significance FDR=−log10. FDR <0.05 and |log2FC|>0.58 (=FC of 1.5) were considered criteria for DEG selection. Genes above the horizontal dotted gray line had FDR <0.05. DEG, differentially expressed gene; FC, fold change. Figure 5 can be viewed in color online at www.jasn.org.
Figure 6
Figure 6
Validation of the association of MMP7 with eGFR and interstitial fibrosis in other human kidney datasets. (A) Scatterplots of the MMP7 transcript level and the degree of fibrosis in 433 microdissected human kidney tubules (validation dataset 1). (B) Scatterplots of MMP7 protein expression and eGFR (ml/min per 1.73 m2) in 186 human DKD and control kidneys (validation dataset 2). (C) Scatterplot of plasma MMP7 protein levels and eGFR (ml/min per 1.73 m2) in nondiabetic participants of ARIC (validation dataset 3). (D) Scatterplot of plasma MMP7 protein levels and eGFR (ml/min per 1.73 m2) in diabetic participants of ARIC (validation dataset 3). Figure 6 can be viewed in color online at www.jasn.org.

References

    1. Tangri N Stevens LA Griffith J, et al. . A predictive model for progression of chronic kidney disease to kidney failure. JAMA. 2011;305(15):1553–1559. doi:10.1001/jama.2011.451 - DOI - PubMed
    1. Tangri N Grams ME Levey AS, et al. . Multinational assessment of accuracy of equations for predicting risk of kidney failure: a meta-analysis. JAMA. 2016;315(2):164–174. doi:10.1001/jama.2015.18202 - DOI - PMC - PubMed
    1. Quinn GZ Abedini A Liu H, et al. . Renal histologic analysis provides complementary information to kidney function measurement for patients with early diabetic or hypertensive disease. J Am Soc Nephrol. 2021;32(11):2863–2876. doi:10.1681/ASN.2021010044 - DOI - PMC - PubMed
    1. Niewczas MA Gohda T Skupien J, et al. . Circulating TNF receptors 1 and 2 predict ESRD in type 2 diabetes. J Am Soc Nephrol. 2012;23(3):507–515. doi:10.1681/ASN.2011060627 - DOI - PMC - PubMed
    1. Hayek SS Sever S Ko YA, et al. . Soluble urokinase receptor and chronic kidney disease. N Engl J Med. 2015;373(20):1916–1925. doi:10.1056/nejmoa1506362 - DOI - PMC - PubMed

Publication types