

Contribution of the Oral and Gastrointestinal Microbiomes to Bloodstream Infections in Leukemia Patients
- PMID: 37022173
- PMCID: PMC10269818
- DOI: 10.1128/spectrum.00415-23
Contribution of the Oral and Gastrointestinal Microbiomes to Bloodstream Infections in Leukemia Patients
Abstract
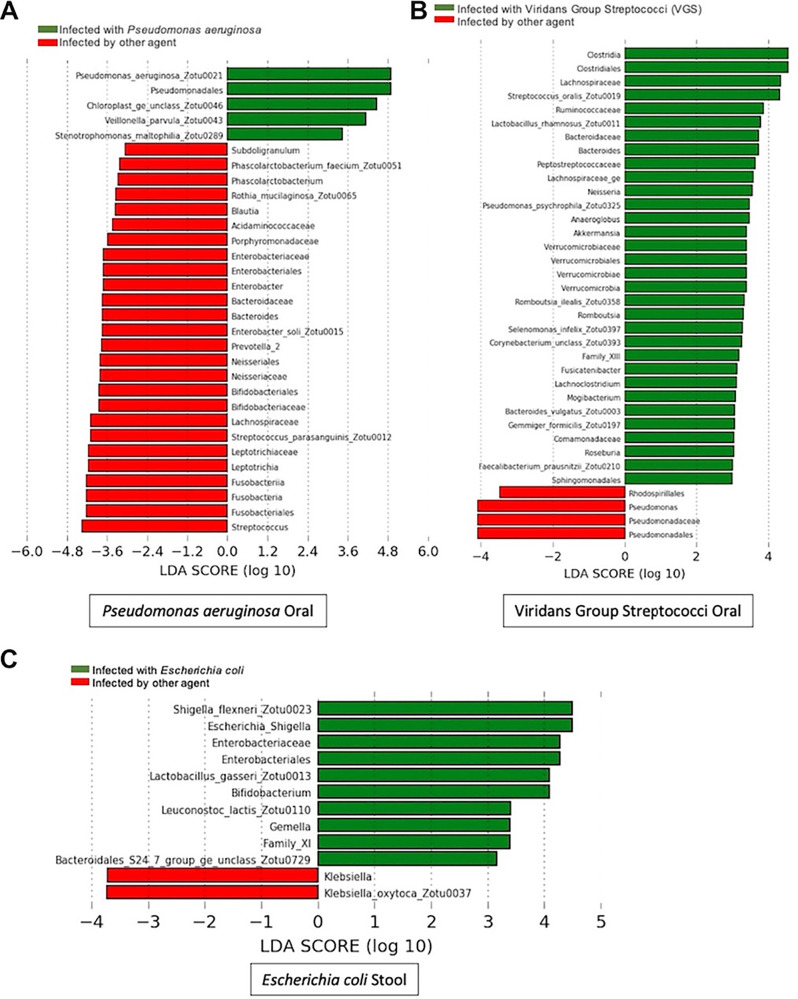
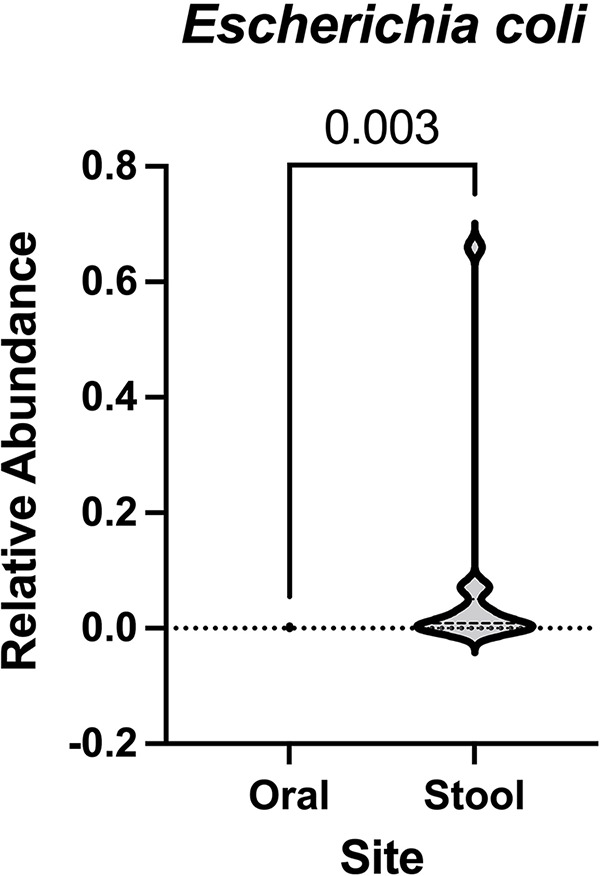
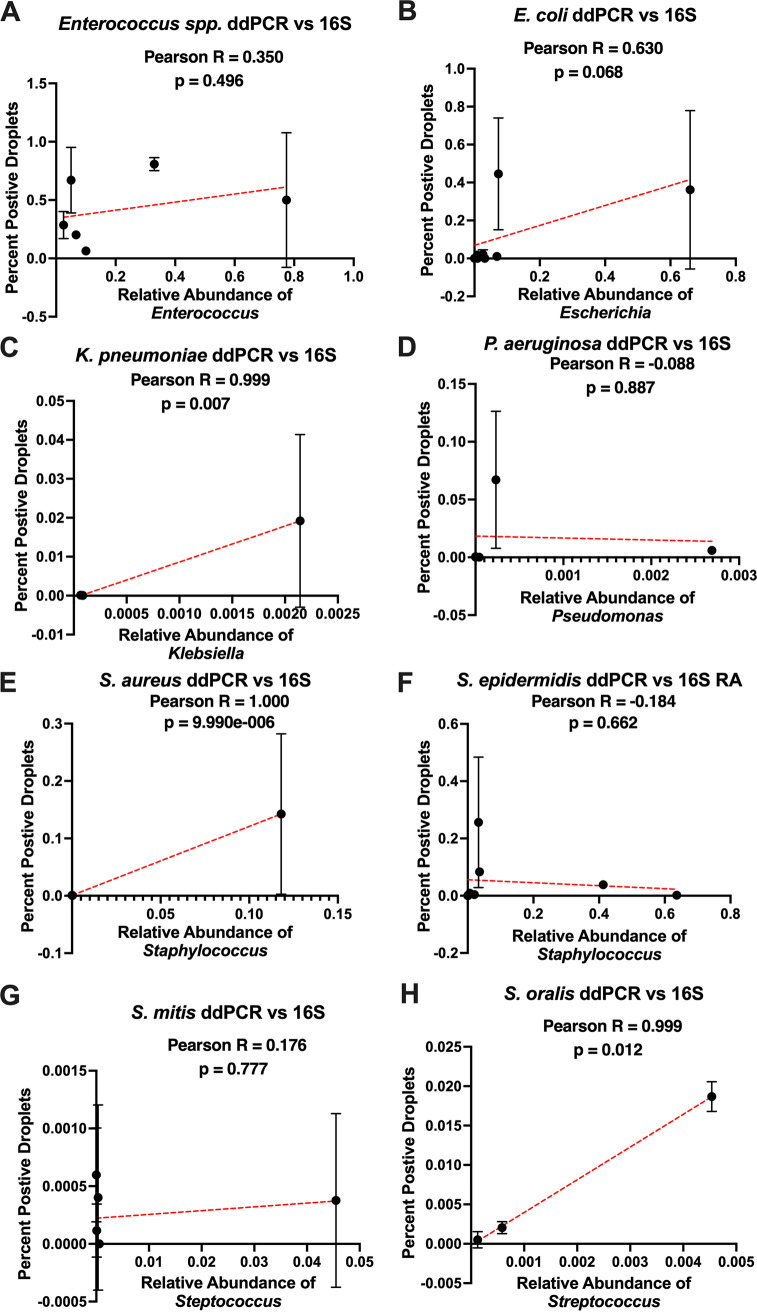
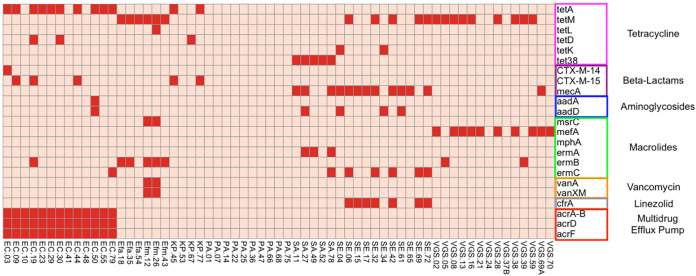
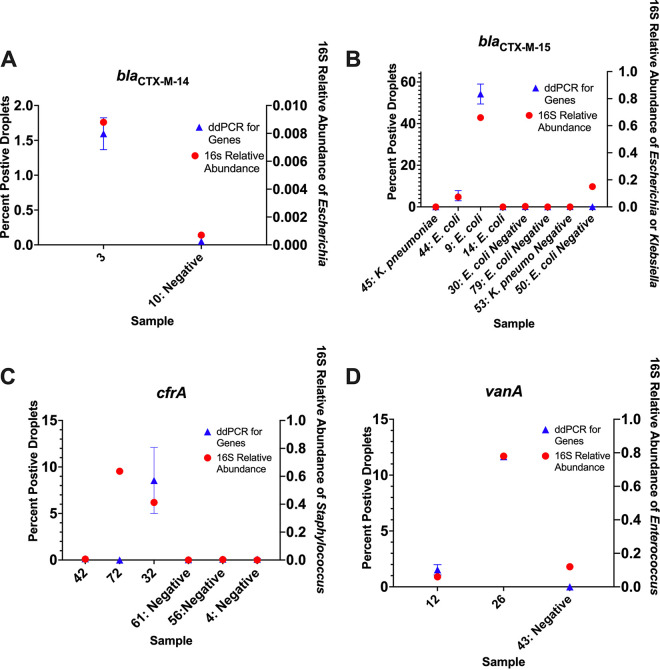
Bloodstream infections (BSIs) pose a significant mortality risk for acute myeloid leukemia (AML) patients. It has been previously reported that intestinal domination (>30% relative abundance [RA] attributed to a single taxon) with the infecting taxa often precedes BSI in stem cell transplant patients. Using 16S rRNA amplicon sequencing, we analyzed oral and stool samples from 63 AML patients with BSIs to determine the correlation between the infectious agent and microbiome composition. Whole-genome sequencing and antimicrobial susceptibilities were performed on all BSI isolates. Species-level detection of the infectious agent and presence of antibiotic resistance determinants in the stool (blaCTX-M-15, blaCTX-M-14, cfrA, and vanA) were confirmed via digital droplet PCR (ddPCR). Individuals with Escherichia coli (stool P < 0.001), Pseudomonas aeruginosa (oral P = 0.004, stool P < 0.001), and viridans group streptococci (VGS) (oral P = 0.001) bacteremia had a significantly higher relative abundance of those respective genera than other BSI patients, which appeared to be site specific. Although 78% of patients showed presence of the infectious genera in the stool and/or saliva, only 7 exhibited microbiome domination. ddPCR confirmed species specificity of the 16S data and detected the antibiotic resistance determinants found in the BSI isolates within concurrent stools. Although gastrointestinal (GI) domination by an infecting organism was not present at the time of most BSIs in AML, the pathogens, along with AMR elements, were detectable in the majority of patients. Thus, rapid genetic assessment of oral and stool samples for the presence of potential pathogens and AMR determinants might inform personalized therapeutic approaches in immunocompromised patients with suspected infection. IMPORTANCE A major cause of mortality in hematologic malignancy patients is BSI. Previous studies have demonstrated that bacterial translocation from the GI microbiome is a major source of BSIs and is often preceded by increased levels of the infectious taxa in the GI (>30% abundance by 16S rRNA sequencing). In this study, we sought to better understand how domination and abundance levels of the oral and gut microbiome relate to bacteremia occurrence in acute myeloid leukemia patients. We conclude that analyses of both oral and stool samples can help identify BSI and antimicrobial resistance determinants, thus potentially improving the timing and tailoring of antibiotic treatment strategies for high-risk patients.
Keywords: bacteremia; colonization; intestinal domination; leukemia; oral microbiome.
Conflict of interest statement
The authors declare a conflict of interest. R.R.J. is an inventor on a U.S. provisional patent application (serial no. 63/273,05) submitted by the University of Texas MD Anderson Cancer Center that covers methods and compositions for treating cancer therapy-induced neutropenic fever or GVHD. R.R.J. is on the advisory board for MaaT Pharma, LISCure Biosciences, Seres Therapeutics, Kaleido Biosciences, and Prolacta Bioscience. R.R.J. has consulted for Da Volterra, Merck, Microbiome Dx, and Karius. R.R.J. is an inventor on a patent (PCT/US2015/062734) that was licensed to Seres Therapeutics.
Figures
References
-
- Ali AM, Weisel D, Gao F, Uy GL, Cashen AF, Jacoby MA, Wartman LD, Ghobadi A, Pusic I, Romee R, Fehniger TA, Stockerl-Goldstein KE, Vij R, Oh ST, Abboud CN, Schroeder MA, Westervelt P, DiPersio JF, Welch JS. 2017. Patterns of infectious complications in acute myeloid leukemia and myelodysplastic syndromes patients treated with 10-day decitabine regimen. Cancer Med 6:2814–2821. doi: 10.1002/cam4.1231. - DOI - PMC - PubMed
-
- Lech-Maranda E, Seweryn M, Giebel S, Holowiecki J, Piatkowska-Jakubas B, Wegrzyn J, Skotnicki A, Kielbinski M, Kuliczkowski K, Paluszewska M, Jedrzejczak WW, Dutka M, Hellmann A, Flont M, Zdziarska B, Palynyczko G, Konopka L, Szpila T, Gawronski K, Sulek K, Sokolowski J, Kloczko J, Warzocha K, Robak T. 2010. Infectious complications in patients with acute myeloid leukemia treated according to the protocol with daunorubicin and cytarabine with or without addition of cladribine. A multicenter study by the Polish Adult Leukemia Group (PALG). Int J Infect Dis 14:e132–e140. doi: 10.1016/j.ijid.2009.02.021. - DOI - PubMed
-
- Rolston KVI. 2014. Infections in patients with acute leukemia. Infect Hematol 3–23. doi: 10.1007/978-3-662-44000-1_1. - DOI
Publication types
MeSH terms
Substances
Grants and funding
LinkOut - more resources
Full Text Sources
Medical
