. 2023 Jun 15;11(3):e0532322.
doi: 10.1128/spectrum.05323-22. Epub 2023 Apr 6.

Combined Methylation and Transcriptome Analysis of Liver Injury of Nonalcoholic Fatty Liver Disease Induced by High Alcohol-Producing Klebsiella pneumoniae

Affiliations

Combined Methylation and Transcriptome Analysis of Liver Injury of Nonalcoholic Fatty Liver Disease Induced by High Alcohol-Producing Klebsiella pneumoniae

Rui Zhang et al. Microbiol Spectr. .

Abstract

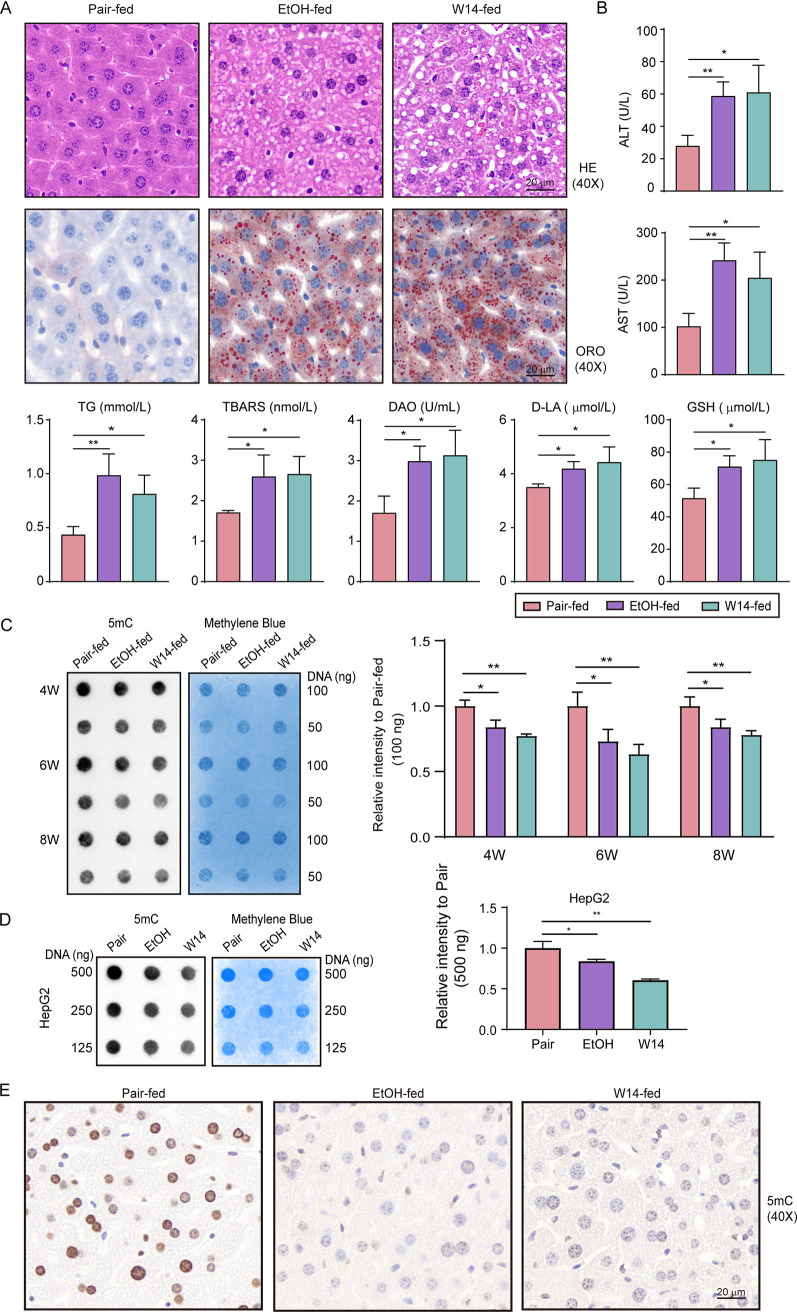
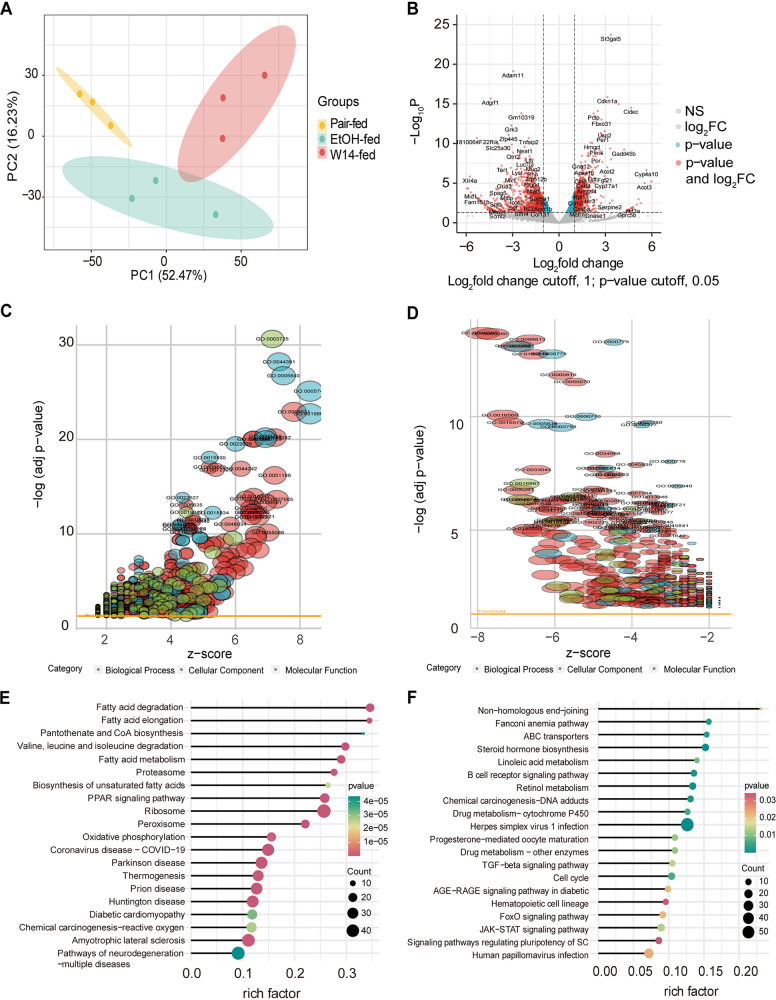
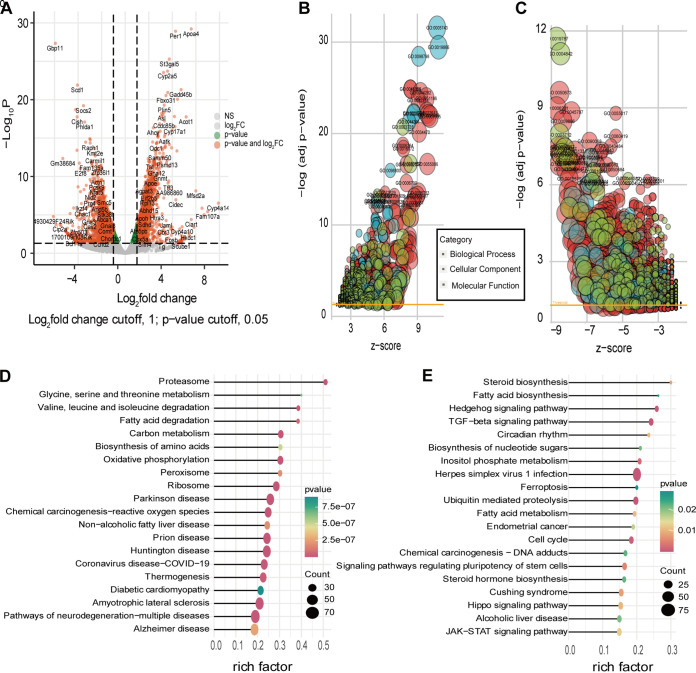
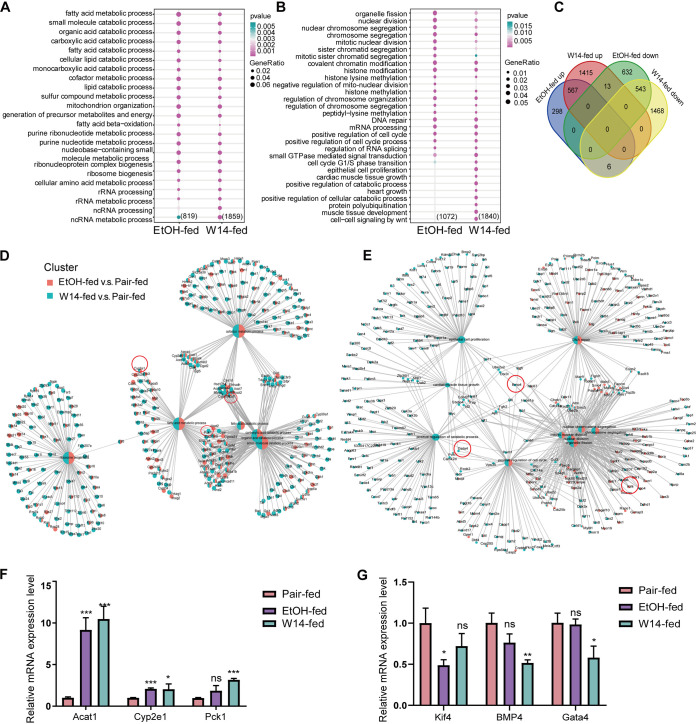
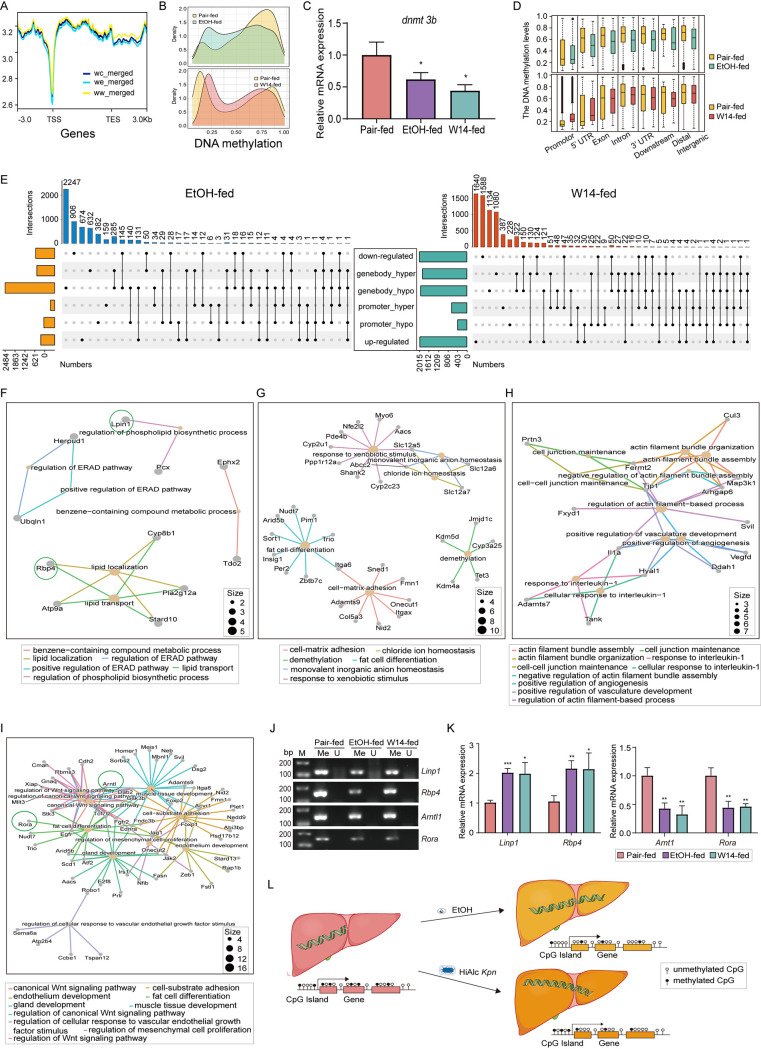
It has been known that high alcohol-producing Klebsiella pneumoniae (HiAlc Kpn) is one of causative agents of nonalcoholic fatty liver disease (NAFLD). However, how HiAlc Kpn promotes liver injury remains unclear. Recent findings suggest that DNA methylation might associate with the pathogenesis of NAFLD. Herein, the role of DNA methylation in HiAlc Kpn-induced liver injury was investigated. Murine models of NAFLD were established in C57BL/6N wild-type mice by gavaging HiAlc Kpn for 8 weeks. The liver injury was assessed based on the liver histopathology and biochemical indicators. In addition, DNA methylation in hepatic tissue was assessed by using dot bolt of 5-mC. RNA sequencing analysis and whole-genome bisulfite sequencing (WGBS) analysis were also performed. HiAlc Kpn significantly increased the activity of aspartate transaminase (AST), alanine transaminase (ALT), triglycerides (TGs), and glutathione (GSH), while hypomethylation was associated with liver injury in the experimental mice induced by HiAlc Kpn. The GO and KEGG pathway enrichment analysis of the transcriptome revealed that HiAlc Kpn induced fat metabolic disorders and DNA damage. The conjoint analysis of methylome and transcriptome showed that hypomethylation regulated related gene expression in signal pathways of lipid formation and circadian rhythm, including Rorα and Arntl1genes, which may be the dominant cause of NAFLD induced by HiAlc Kpn. Data suggest that DNA hypomethylation might play an important role in liver injury of NAFLD induced by HiAlc Kpn. Which possibly provides a new sight for understanding the mechanisms of NAFLD and selecting the potential therapeutic targets. IMPORTANCE High alcohol-producing Klebsiella pneumoniae (HiAlc Kpn) is one of causative agents of nonalcoholic fatty liver disease (NAFLD) and could induce liver damage. DNA methylation, as a common epigenetic form following contact with an etiologic agent and pathogenesis, can affect chromosome stability and transcription. We conjointly analyzed DNA methylation and transcriptome levels in the established murine models to explore the potential mechanisms for further understanding the role of DNA methylation in the liver damage of HiAlc Kpn-induced NAFLD. The analysis of the DNA methylation landscape contributes to our understanding of the entire disease process, which might be crucial in developing treatment strategies.

Keywords: DNA methylation; HiAlc Kpn; endogenous ethanol; liver injury.


Conflict of interest statement

The authors declare no conflict of interest.

Figures

FIG 1
FIG 1
HiAlcKpn (W14) induced liver injury and DNA hypomethylation in NAFLD mice. (A) Liver histology for the assessment of hepatic steatosis induced by HiAlc Kpn W14 for 8 weeks visualized by H&E (40×) and Oil Red O staining (40×). (B) Biochemical indicators (ALT, AST, TG, TBARS, and GSH) of the liver injury induced by HiAlc Kpn W14 in mice for 8 weeks. (C) The 5-mC-specific dot blot. gDNA was isolated from liver tissues, and 100 ng and 50 ng of gDNA were loaded per dot. Dot intensity analysis by the ImageJ is shown on the right. (D) The 5-mC-specific dot blot. The liver cells (HepG2) were treated by EtOH or the culture supernatant of HiAlc Kpn for 48 h, respectively. The cells were collected and gDNA was extracted for the dot blot experiment. A total of 500 ng (top), 250 ng (middle), and 125 ng (bottom) of gDNA were loaded per dot. Dot intensity analysis by the ImageJ is shown on the right. (E) Immunohistochemical analysis of 5-mC levels in sections of the liver tissues of mice for 8 weeks feeding. All experiments were performed in triplicates, and data represent mean ± SD. n = 6, *, P < 0.05; **, P < 0.01.
FIG 2
FIG 2
Transcriptome analysis of liver tissues of EtOH-fed mice. (A) Correlation analysis of differentially expressed genes (DEGs) of liver tissues from pair-, EtOH-, and W14-fed mice. (B) Volcano plot of DEGs analysis between EtOH- and pair-fed mice. Gene Ontology (GO) enrichment analysis of upregulated (C) and downregulated (D) DEGs in the liver tissues between EtOH- and pair-fed mice. Kyoto Encyclopedia of Genes and Genome (KEGG) pathway enrichment analysis of upregulated (E) and downregulated DEGs (F) in liver tissues of EtOH- and pair-fed mice.
FIG 3
FIG 3
Transcriptome analysis of liver tissues of mice with W14-induced NAFLD. (A) Volcano plot of DEGs between W14- and pair-fed mice. GO enrichment analysis of upregulated (B) and downregulated (C) DEGs in liver tissues of W14- and pair-fed mice. KEGG pathway enrichment analysis of upregulated (D) and downregulated DEGs (E) in liver tissues of W14- and pair-fed mice.
FIG 4
FIG 4
Integrative GO enrichment analysis of DEGs in liver tissues of mice with NAFLD induced by HiAlc Kpn and EtOH relative to the pair-fed mice. Integrative of GO enrichment analysis of upregulated (A) and downregulated (B) DEGs between W14- and EtOH-fed mice relative to the pair-fed mice. (C) Venn diagram showing the overlap of upregulated and downregulated DEGs between W14- and EtOH-fed mice compared to the pair-fed mice. List of upregulated (D) and downregulated (E) DEGs between W14- and EtOH-fed mice compared to the pair-fed mice. (F and G) RT-qPCR results showing the relative expression of upregulated (F) and downregulated (G) DEGs. These data represent the mean ± SD of three separate experiments. n = 3; *, P < 0.05; **, P < 0.01; ***, P < 0.001; ns, no statistical significance.
FIG 5
FIG 5
Integrative global methylation and transcriptome analyses. (A) The overall DNA methylation levels in pair-, EtOH-, and W14-fed mice were shown as wc_merged, we_merged, and ww_merged, respectively. (B) The whole DNA methylation level in EtOH- (top) and W14-fed mice (bottom), relative to the pair-fed mice. (C) The mRNA of dnmt3b was verified by real-time qPCR. (D) The DNA methylation level of DMRs at indicated genomic regions in EtOH- (top) and W14-fed mice (bottom), compared to the pair-fed mice. (E) The visualized upset image of DNA methylation and transcriptome data from EtOH-fed mice (left) and W14-fed mice (right), compared to the pair-fed mice. GO pathways enrichment of promoter hypomethylation associated with the significantly upregulated DEGs (F) and gene-body hypomethylation associated with downregulated DEGs (G) in EtOH-fed mice, compared to the pair-fed mice. GO pathways enrichment of promoter hypermethylation associated with the significantly downregulated DEGs (H) and gene-body, except for 5’UTR hypomethylation associated with downregulated DEGs (I) in W14-fed mice, compared to the pair-fed mice. (J) Agarose gel electrophoresis of methylation-specific PCR of Linp1, Rbp4, Arntl1, and Rorα genes (Me, Methylation primer; U, un-Methylation primer). (K) RT-qPCR results showing the relative expression of upregulated (left) and downregulated (right) genes. The data represent the mean ± SD of three separate experiments. n = 3; *, P < 0.05; **, P < 0.01; ***, P < 0.001. (L) Schematic diagram of DNA methylation in mice with NAFLD induced by W14.

Similar articles

Cited by

References

    1. Powell EE, Wong VW, Rinella M. 2021. Non-alcoholic fatty liver disease. Lancet 397:2212–2224. doi:10.1016/S0140-6736(20)32511-3. - DOI - PubMed
    1. Divella R, Mazzocca A, Daniele A, Sabba C, Paradiso A. 2019. Obesity, nonalcoholic fatty liver disease and adipocytokines network in promotion of cancer. Int J Biol Sci 15:610–616. doi:10.7150/ijbs.29599. - DOI - PMC - PubMed
    1. Loomba R, Friedman SL, Shulman GI. 2021. Mechanisms and disease consequences of nonalcoholic fatty liver disease. Cell 184:2537–2564. doi:10.1016/j.cell.2021.04.015. - DOI - PubMed
    1. Kleiner DE, Makhlouf HR. 2016. Histology of nonalcoholic fatty liver disease and nonalcoholic steatohepatitis in adults and children. Clin Liver Dis 20:293–312. doi:10.1016/j.cld.2015.10.011. - DOI - PMC - PubMed
    1. Yuan J, Chen C, Cui J, Lu J, Yan C, Wei X, Zhao X, Li N, Li S, Xue G, Cheng W, Li B, Li H, Lin W, Tian C, Zhao J, Han J, An D, Zhang Q, Wei H, Zheng M, Ma X, Li W, Chen X, Zhang Z, Zeng H, Ying S, Wu J, Yang R, Liu D. 2019. Fatty liver disease caused by high-alcohol-producing Klebsiella pneumoniae. Cell Metab 30:1172. doi:10.1016/j.cmet.2019.11.006. - DOI - PubMed

Publication types