. 2023 Apr 27;8(2):e0011823.
doi: 10.1128/msystems.00118-23. Epub 2023 Apr 6.

Quantifying Shared and Unique Gene Content across 17 Microbial Ecosystems

Affiliations

Quantifying Shared and Unique Gene Content across 17 Microbial Ecosystems

Samuel Zimmerman et al. mSystems. .

Abstract

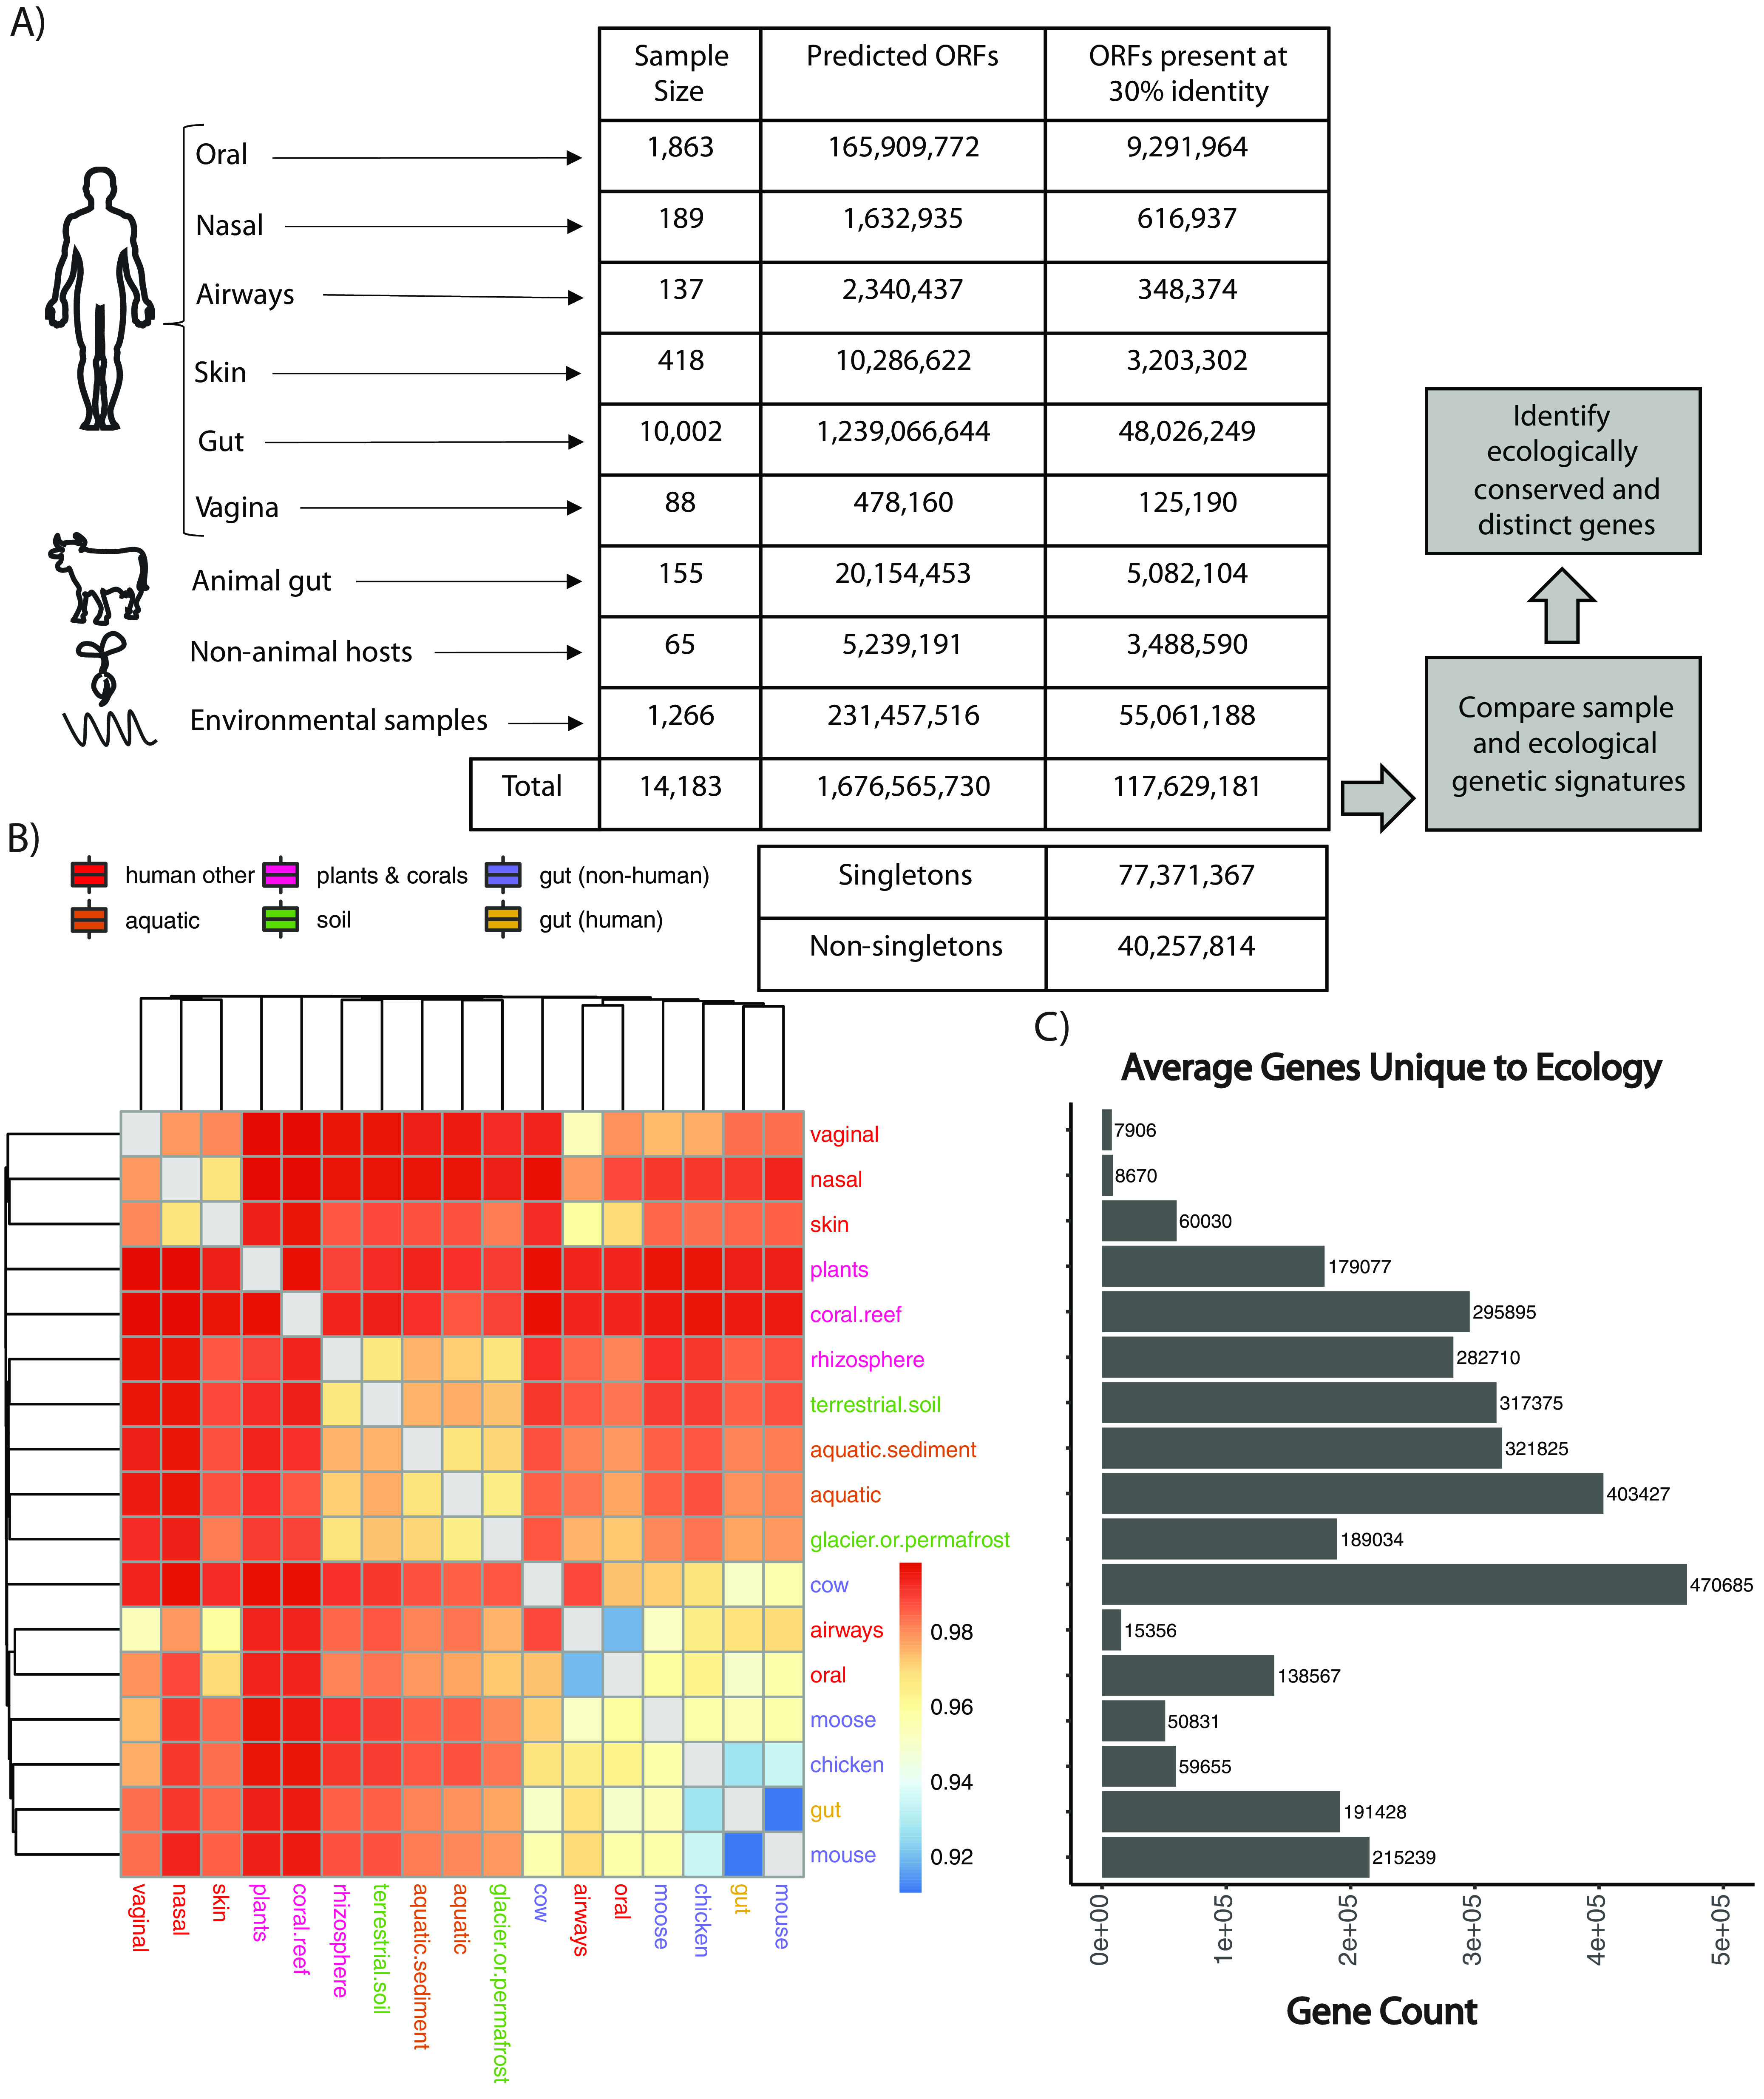
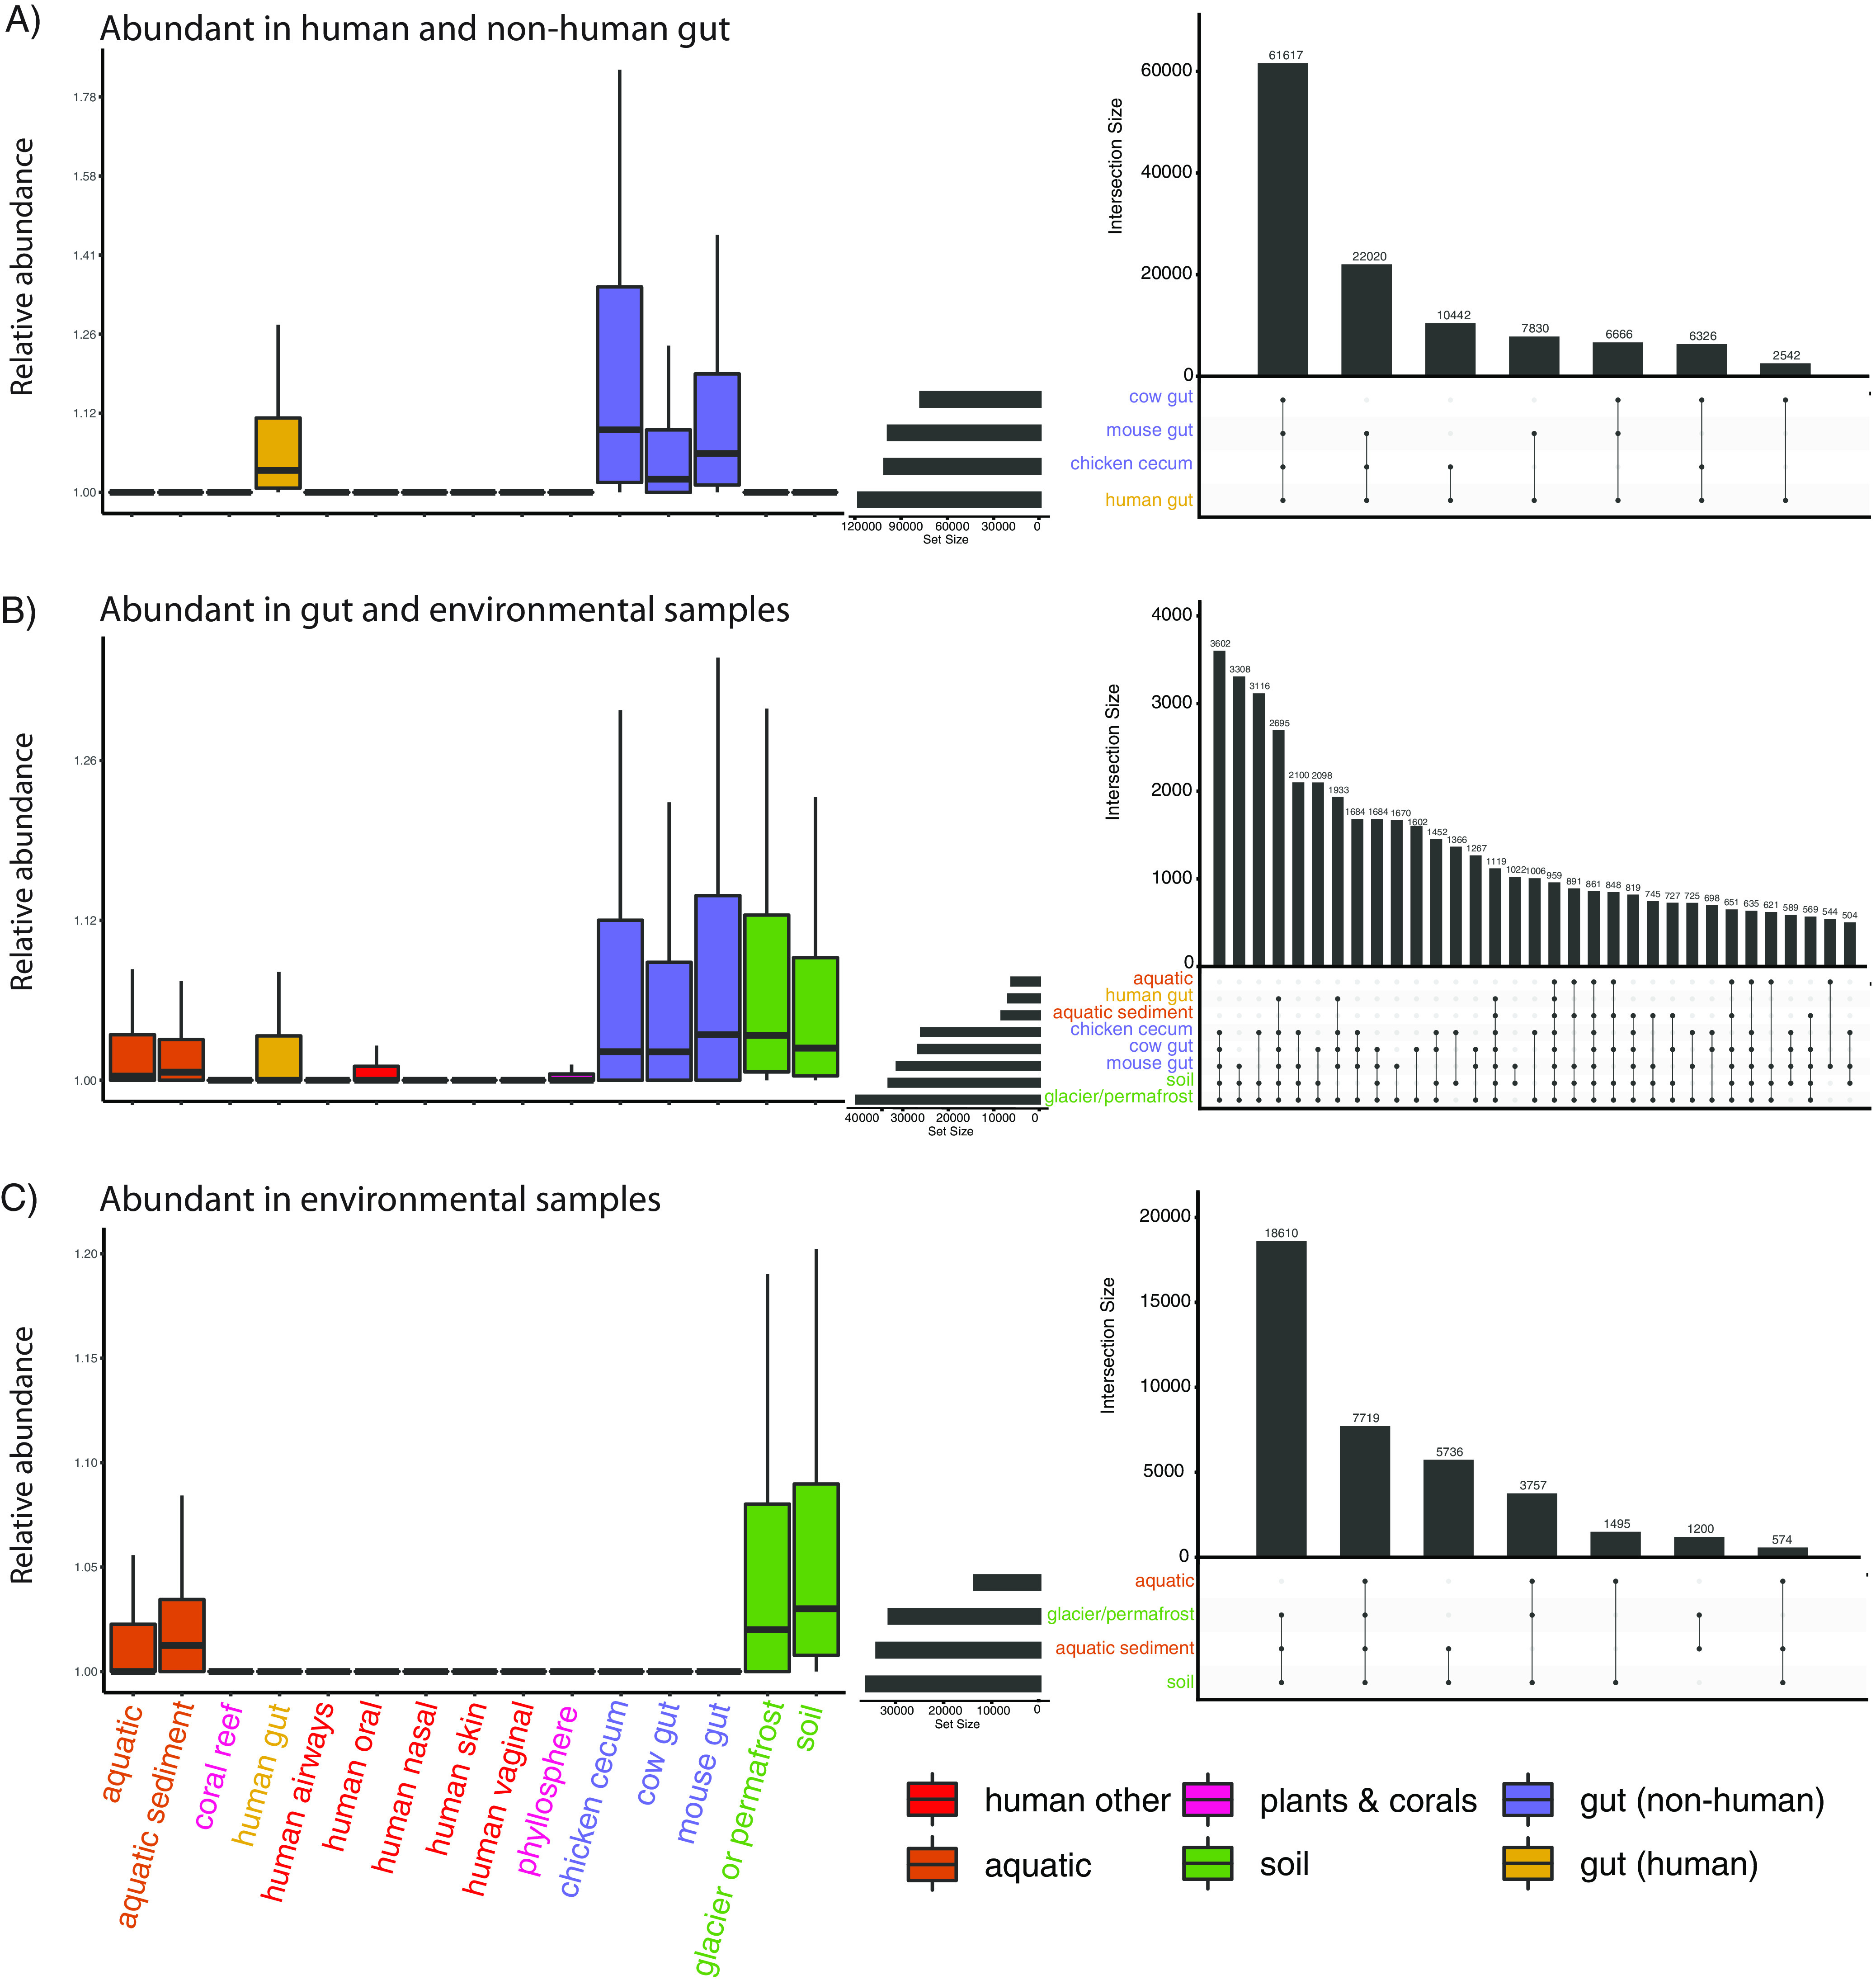
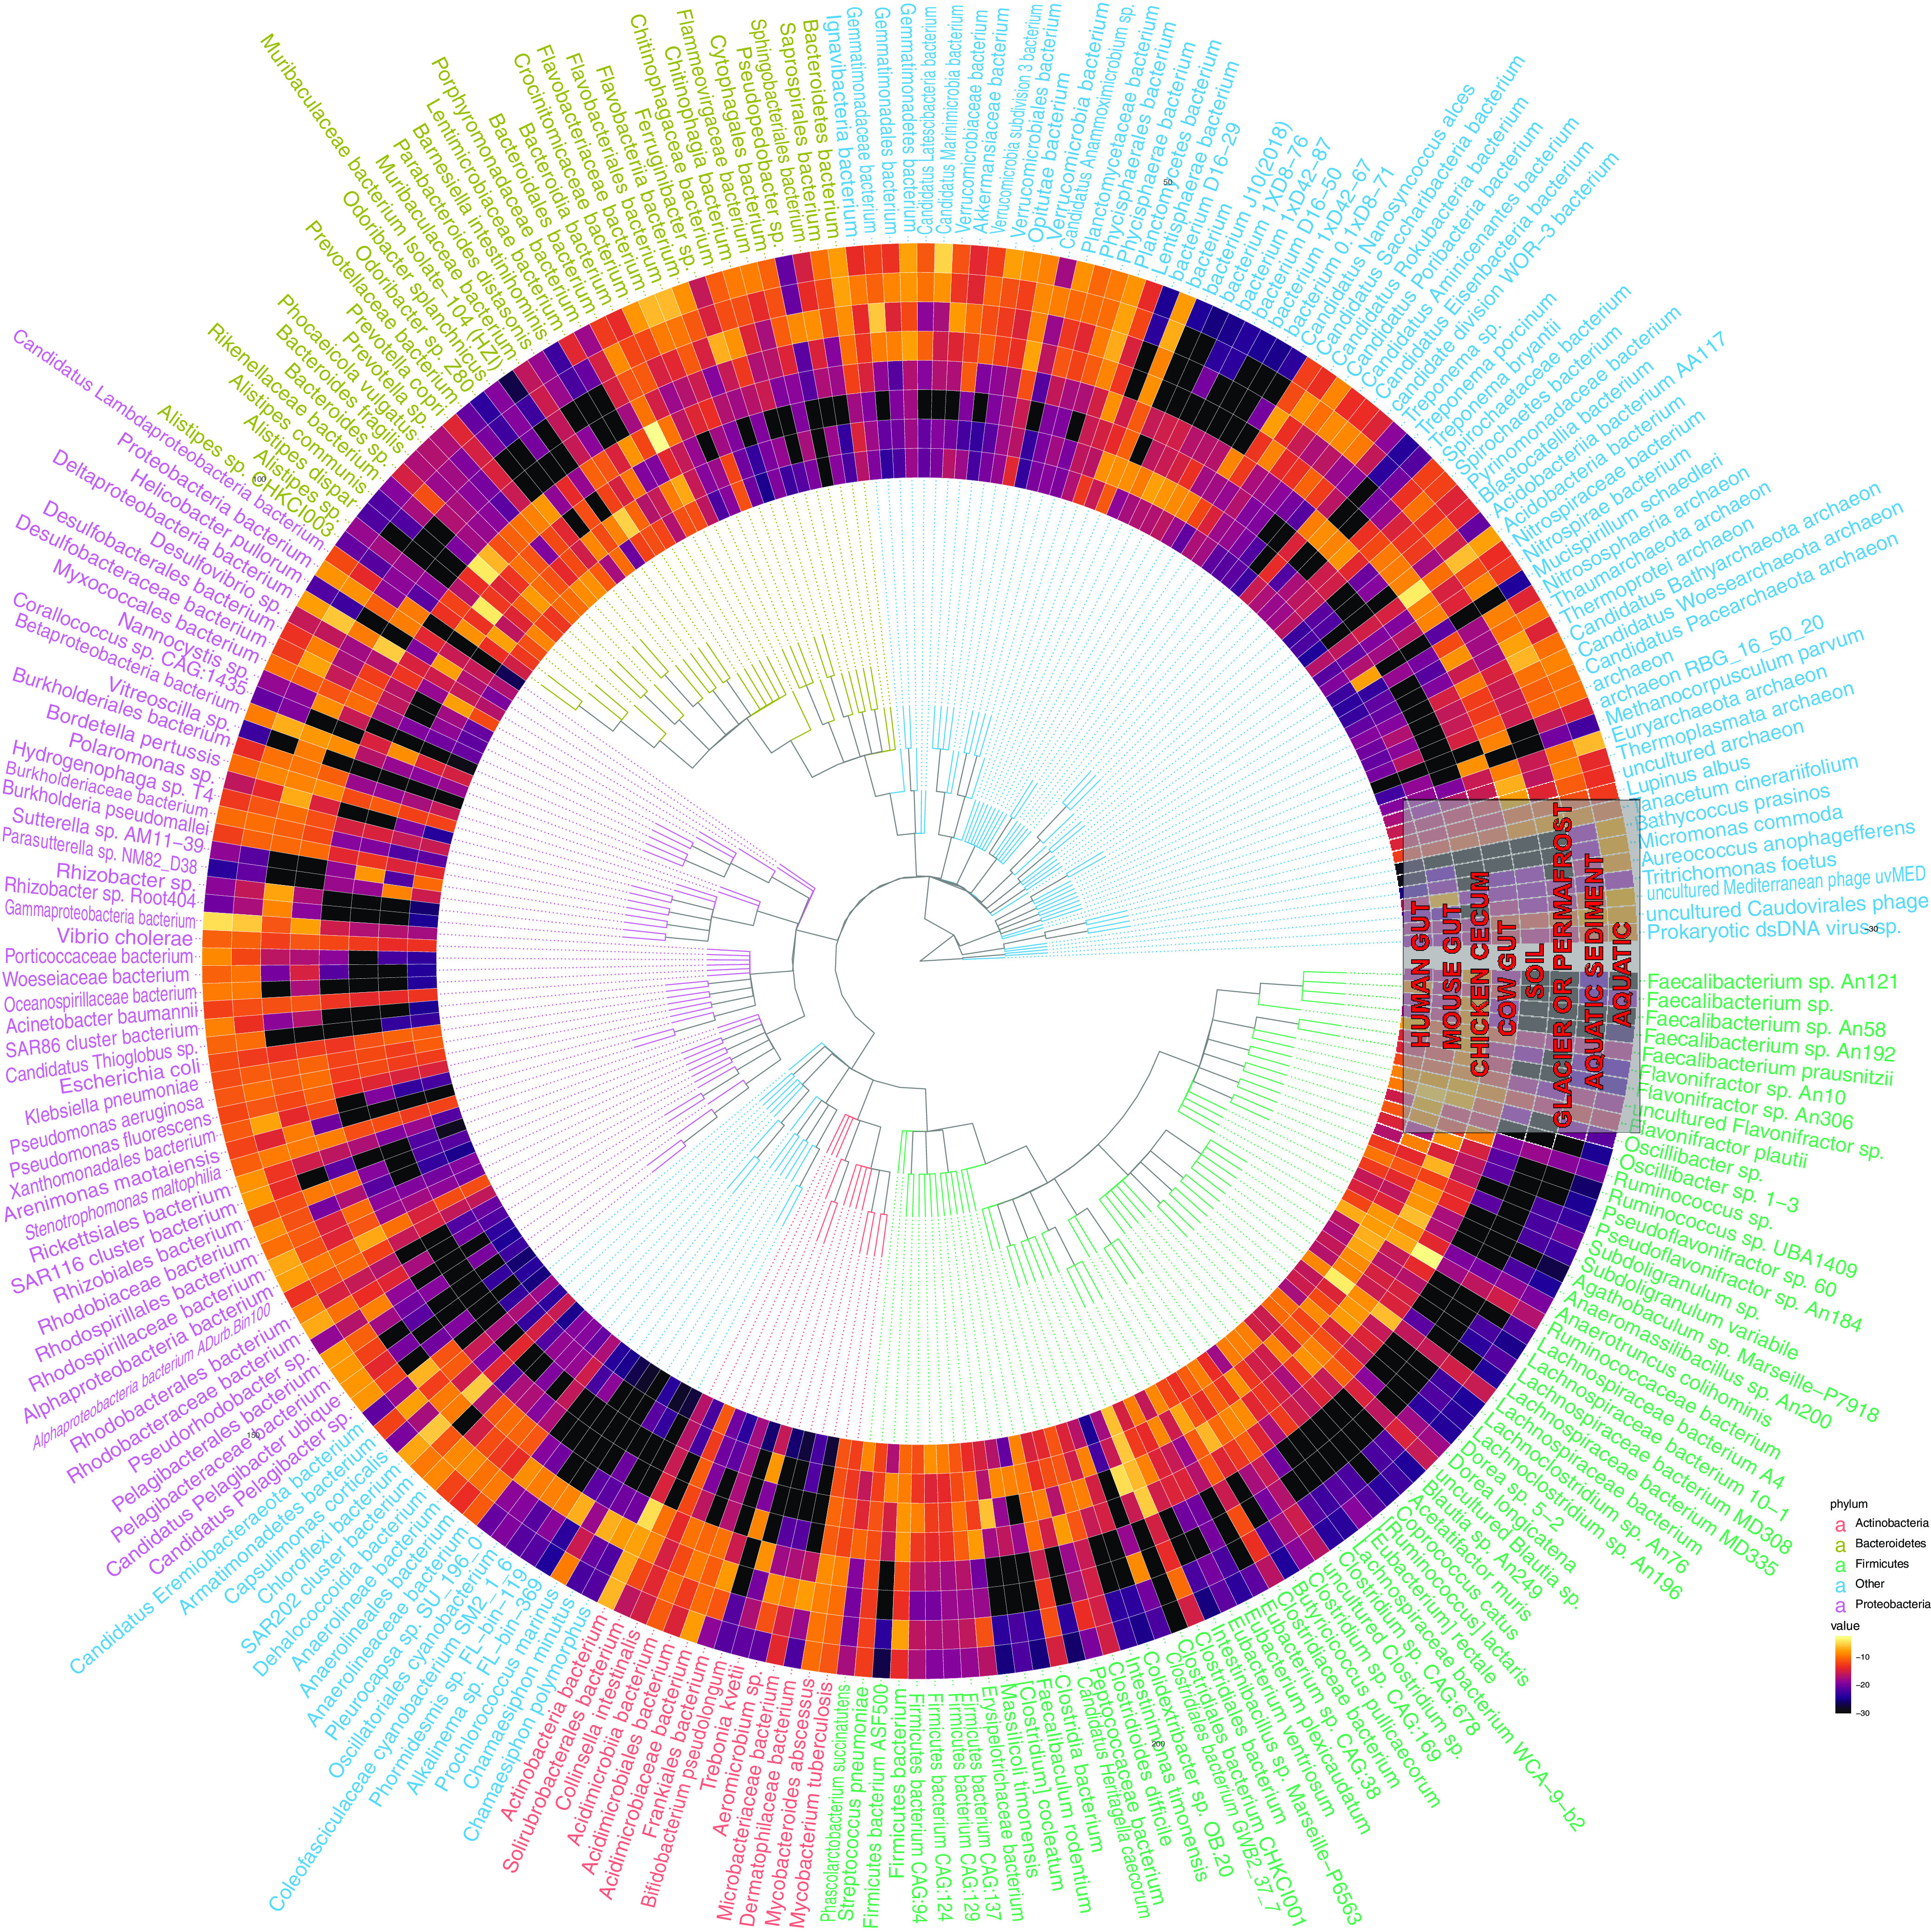
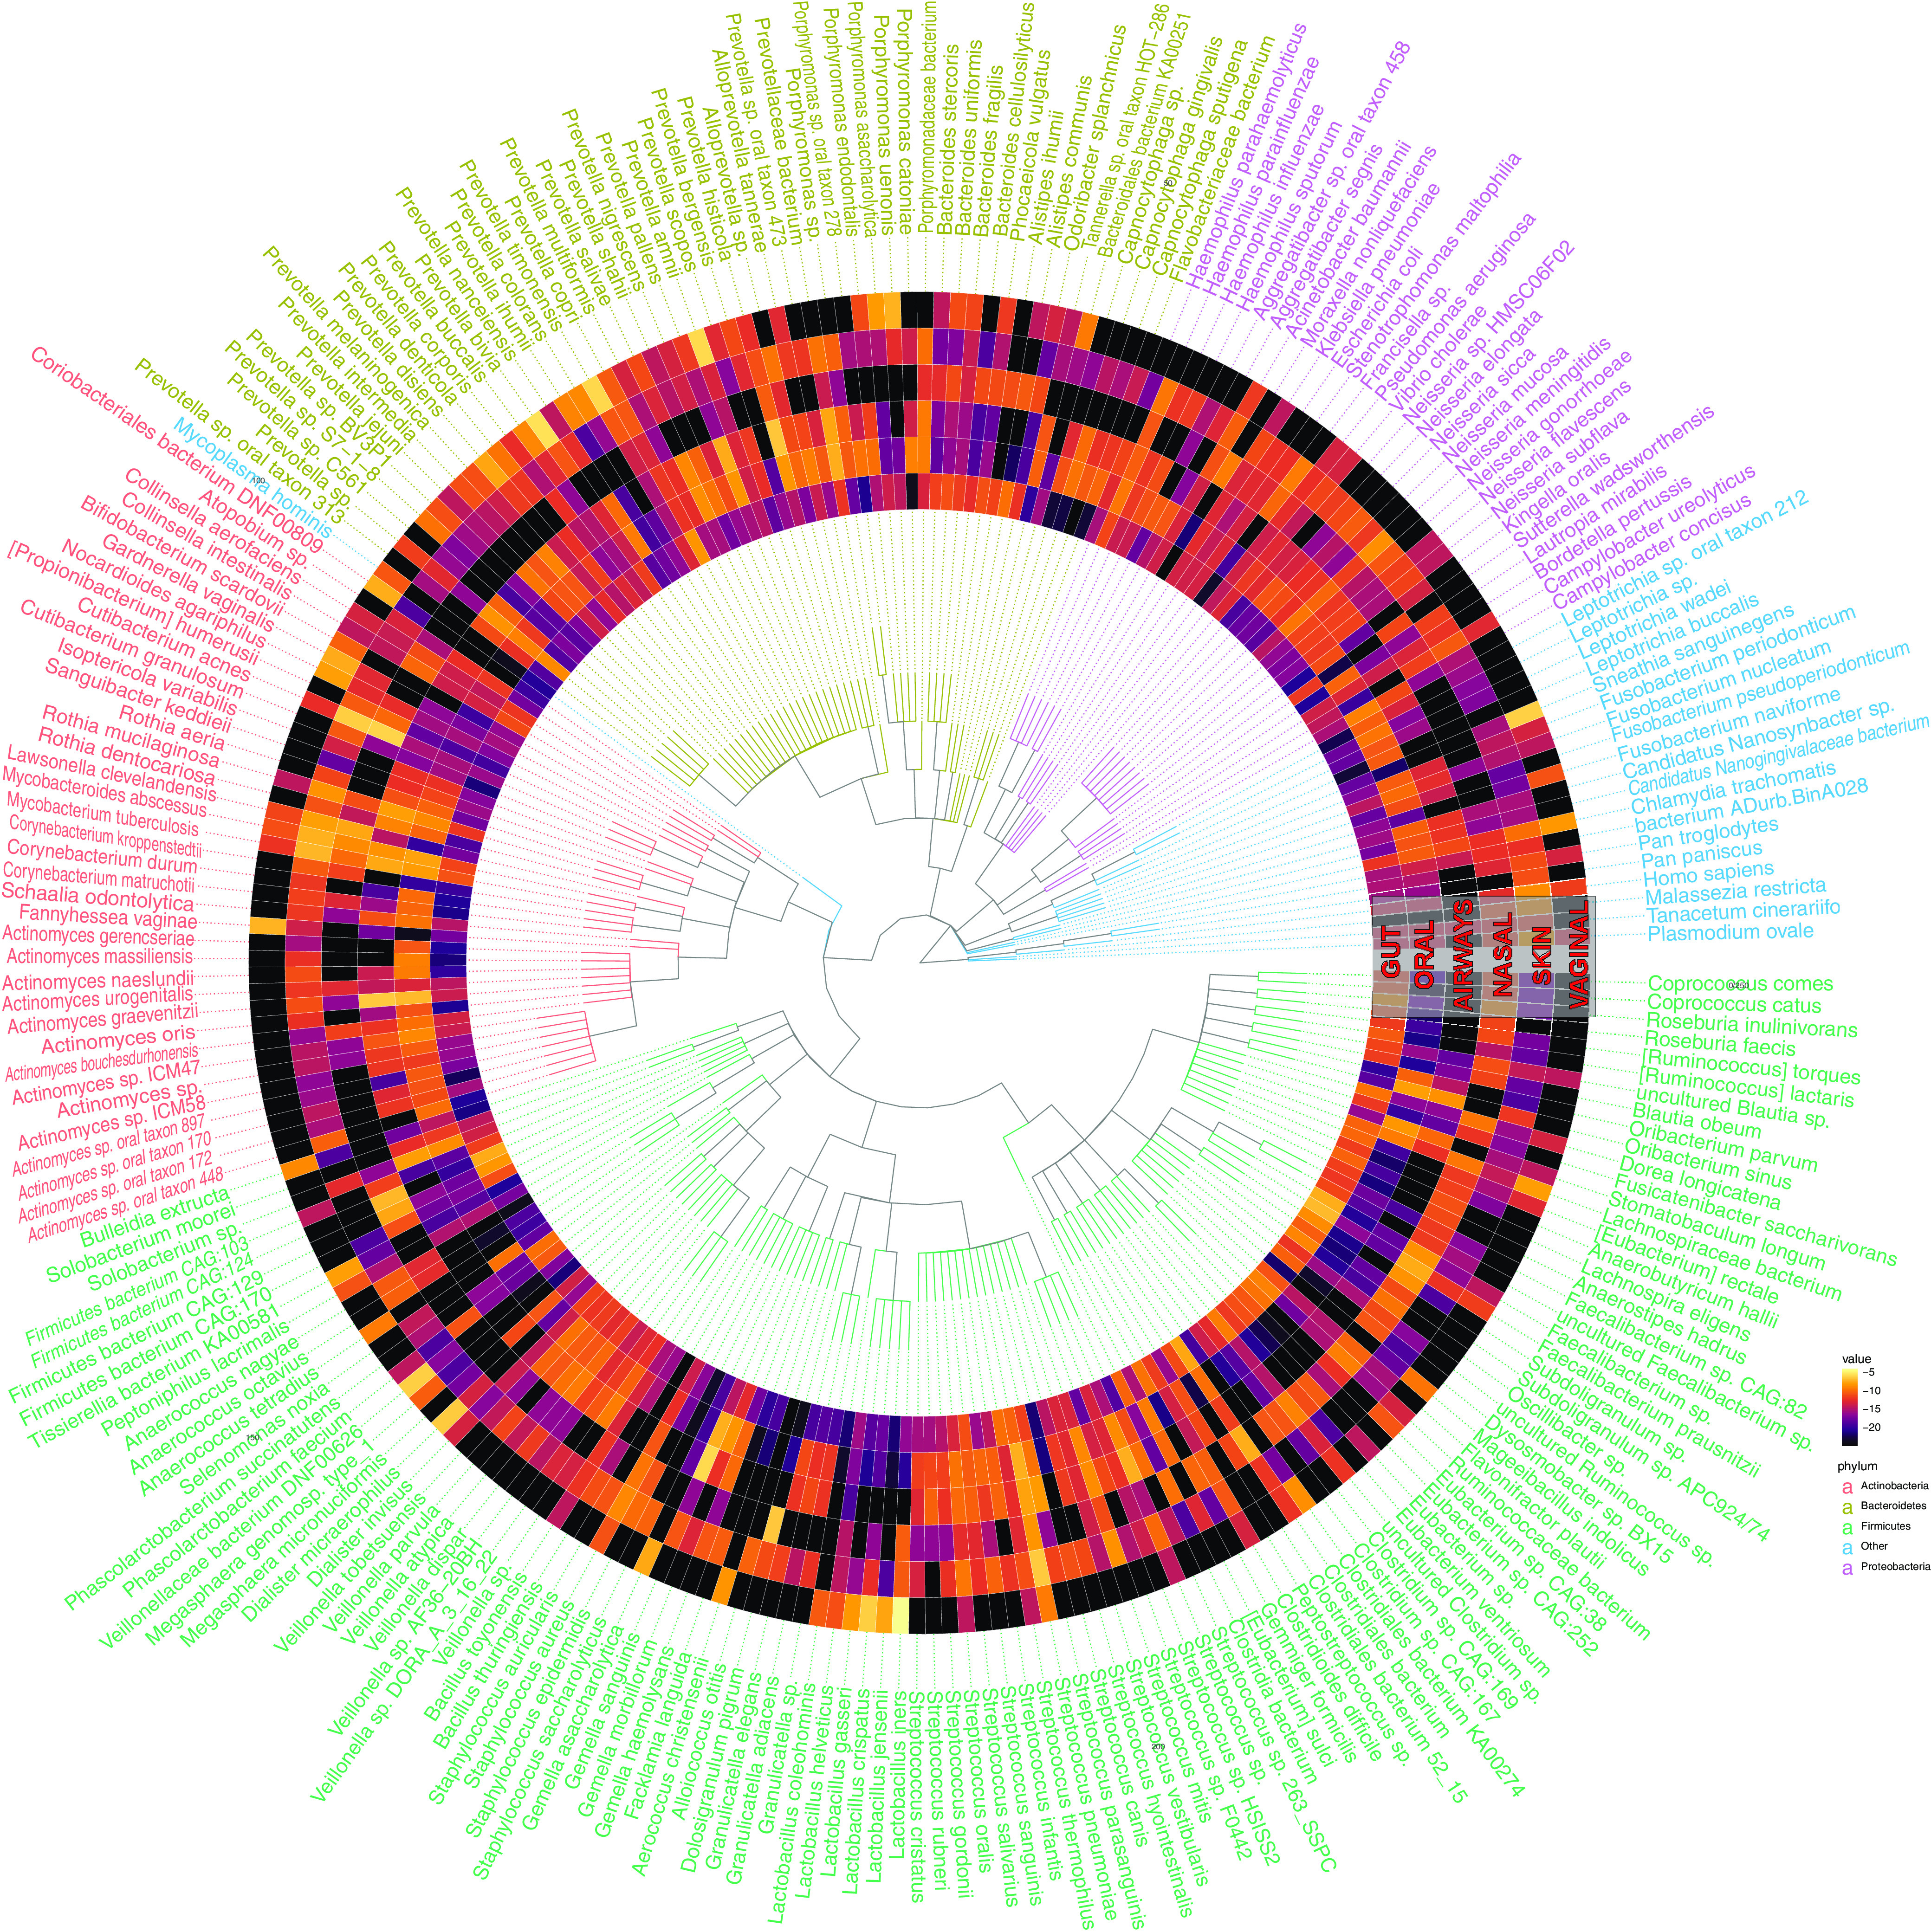
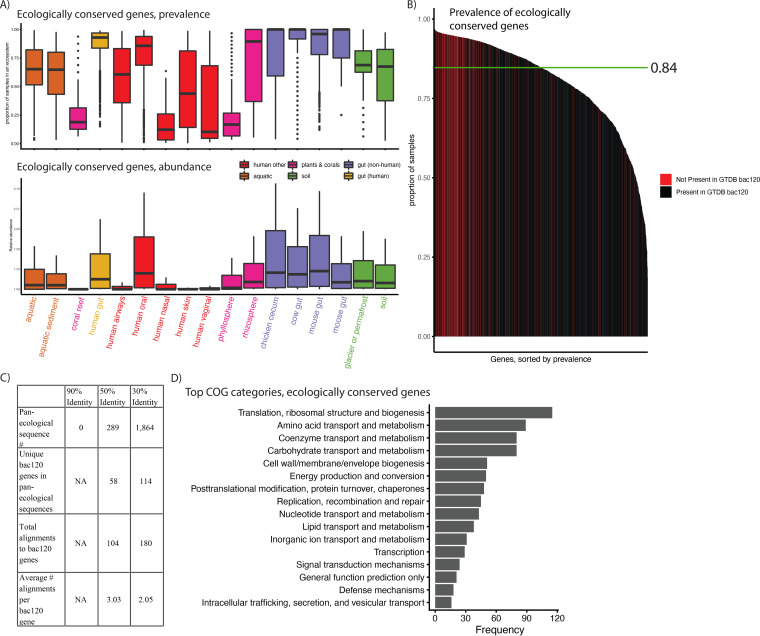
Measuring microbial diversity is traditionally based on microbe taxonomy. Here, in contrast, we aimed to quantify heterogeneity in microbial gene content across 14,183 metagenomic samples spanning 17 ecologies, including 6 human associated, 7 nonhuman host associated, and 4 in other nonhuman host environments. In total, we identified 117,629,181 nonredundant genes. The vast majority of genes (66%) occurred in only one sample (i.e., "singletons"). In contrast, we found 1,864 sequences present in every metagenome, but not necessarily every bacterial genome. Additionally, we report data sets of other ecology-associated genes (e.g., abundant in only gut ecosystems) and simultaneously demonstrated that prior microbiome gene catalogs are both incomplete and inaccurately cluster microbial genetic life (e.g., at gene sequence identities that are too restrictive). We provide our results and the sets of environmentally differentiating genes described above at http://www.microbial-genes.bio. IMPORTANCE The amount of shared genetic elements has not been quantified between the human microbiome and other host- and non-host-associated microbiomes. Here, we made a gene catalog of 17 different microbial ecosystems and compared them. We show that most species shared between environment and human gut microbiomes are pathogens and that prior gene catalogs described as "nearly complete" are far from it. Additionally, over two-thirds of all genes only appear in a single sample, and only 1,864 genes (0.001%) are found in all types of metagenomes. These results highlight the large diversity between metagenomes and reveal a new, rare class of genes, those found in every type of metagenome, but not every microbial genome.

Keywords: bioinformatics; human microbiome; metagenomics.


Conflict of interest statement

The authors declare a conflict of interest. Aleksandar D. Kostic is an advisor at FitBiomics. Chirag J. Patel is a cofounder of XY.ai. Braden T. Tierney consults for Seed Health on microbiome study design and analysis.

Figures

FIG 1
FIG 1
Overview of approach and results and genetic similarity between ecologies. (A) Statistics regarding the gene and sample content of our database at the 30% clustered sequence identity and the high-level analytical steps we took in the manuscript. (B) Hierarchical clustering on the Jaccard distance between ecologies as a function of iterative sampling. Each cell represents the average Jaccard distance between two ecologies (in rows and columns) after 50 random samplings. Cell color is in units of Jaccard distance. The color of text corresponds to broader ecology class. (C) Average number of genes unique to (found only in) a given ecology.
FIG 2
FIG 2
Alpha and within-ecology beta diversity of samples in each ecology. (Top left) Jaccard distance between each pair of samples used in Fig. 1B computed through shared gene content. (Bottom left) Bray-Curtis distance between each pair of samples in each ecology calculated via species abundance from Table S4 in the supplemental material. (Top right) Chao2 richness estimator of each sample used in Fig. 1B. (Bottom right) The Chao1 richness estimator of 4 samples from each ecology from Table S4 calculated via species abundance.
FIG 3
FIG 3
Results of our unsupervised gene-level clustering analysis. (A) Output of our UMAP analysis displaying all seven clusters we identified. Cluster composition corresponds to color. (B and C) Using the same color scheme as in panel A for the bars, the proportion of samples in different ecologies and with different disease states in our identified clusters. (D) Top 10 enriched genera, colored by phyla, in each cluster. (E) Distribution of Westernized versus non-Westernized samples across clusters. (F) Distribution of age categories across clusters.
FIG 4
FIG 4
Functional analysis of genes abundant in different ecological contexts. (A) Total number of genes captured in the differential abundance analysis. (B) Fraction of genes in the different high-level COG categories, by intersection. (C to E) The top 25 most common protein products for each ecological comparison considered.
FIG 5
FIG 5
Genes abundant in intersecting ecological groups. (Left columns) Abundance of genes found to be significantly differentially abundant (in a separate cohort) in the described sample types. (Right columns) Number of specific overlaps in abundant genes between specific ecologies.
FIG 6
FIG 6
Taxonomically contextualizing the genetic content of the human gut microbiome. Each ring corresponds to a different ecology. Each “row” corresponds to a different taxonomic annotation for an open reading frame that was abundant in any gut or environment microbiome. The colors correspond to the fractions of all genes with a given annotation that were indicated as abundant in a given ecology. Text color corresponds to phyla.
FIG 7
FIG 7
Taxonomically contextualizing the genetic content of the global human microbiome. Each ring corresponds to a different ecology. Each “row” corresponds to a different taxonomic annotation for an ORF in the same cluster as a consensus gene that was abundant in at least two human microbiome body sites. The colors correspond to the fractions of all genes with a given annotation that were indicated as abundant in a given ecology. Text color corresponds to phyla.
FIG 8
FIG 8
The pan-ecologically conserved genes of metagenomics. (A) The prevalence and abundance (in the 422 external samples used in prior figures), by ecology, of all 1,864 genes found to be assembled at least once in all 17 ecologies. (B) The prevalence of all 1,864 ecologically conserved genes, with colors corresponding to whether or not they aligned to a GTDB bac120 gene. (C) For different percent identities, the number of pan-ecological sequences, the number that align to GTDB bac120 genes, and the average number of bac120 genes aligning to a given identified conserved gene. (D) The most common COG category annotations for the 30% identity ecologically conserved genes.

Similar articles

Cited by

References

    1. Rackaityte E, Lynch SV. 2020. The human microbiome in the 21st century. Nat Commun 11:5256. doi:10.1038/s41467-020-18983-8. - DOI - PMC - PubMed
    1. Pflughoeft KJ, Versalovic J. 2012. Human microbiome in health and disease. Annu Rev Pathol 7:99–122. doi:10.1146/annurev-pathol-011811-132421. - DOI - PubMed
    1. Knights D, Silverberg MS, Weersma RK, Gevers D, Dijkstra G, Huang H, Tyler AD, van Sommeren S, Imhann F, Stempak JM, Huang H, Vangay P, Al-Ghalith GA, Russell C, Sauk J, Knight J, Daly MJ, Huttenhower C, Xavier RJ. 2014. Complex host genetics influence the microbiome in inflammatory bowel disease. Genome Med 6:107. doi:10.1186/s13073-014-0107-1. - DOI - PMC - PubMed
    1. Le Goallec A, Tierney BT, Luber JM, Cofer EM, Kostic AD, Patel CJ. 2020. A systematic machine learning and data type comparison yields metagenomic predictors of infant age, sex, breastfeeding, antibiotic usage, country of origin, and delivery type. PLoS Comput Biol 16:e1007895. doi:10.1371/journal.pcbi.1007895. - DOI - PMC - PubMed
    1. Korpela K, de Vos WM. 2018. Early life colonization of the human gut: microbes matter everywhere. Curr Opin Microbiol 44:70–78. doi:10.1016/j.mib.2018.06.003. - DOI - PubMed

Publication types

LinkOut - more resources