. 2023 Apr 7:13:04032.
doi: 10.7189/jogh.13.04032.

How does obesity affect mortality through blood pressure and blood glucose in Chinese and US citizens? Insights from a causal mediation analysis of two large cohorts

Affiliations

How does obesity affect mortality through blood pressure and blood glucose in Chinese and US citizens? Insights from a causal mediation analysis of two large cohorts

Qi Huang et al. J Glob Health. .

Abstract

Background: Obesity, which has reached the scale of a global pandemic, is a leading cause of premature death. It is unclear to what extent its effect on mortality was driven by blood pressure or glucose levels in people of different ethnicities.

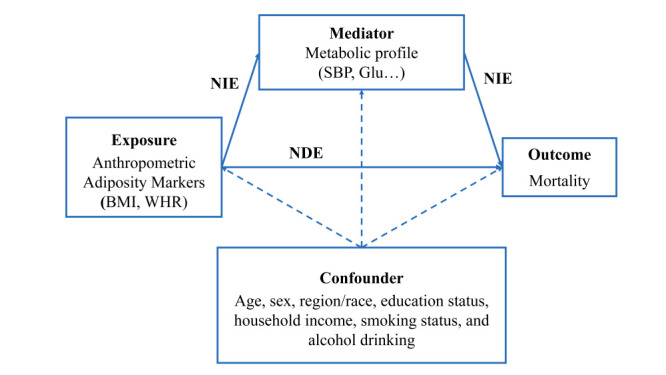
Methods: We conducted a causal mediation analysis to estimate the mediation effect of blood pressure and glucose between body mass index (BMI) or waist-hip ratio (WHR) on mortality based on data from the China Kadoorie Biobank (CKB) (n = 458 385) and US National Health and Nutrition Examination Survey (NHANES) (1999-2008, n = 20 726).

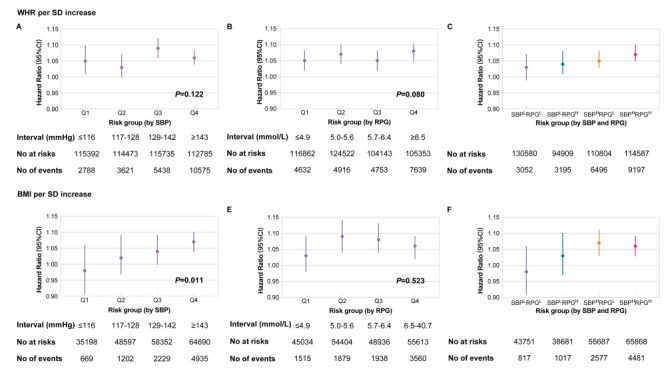
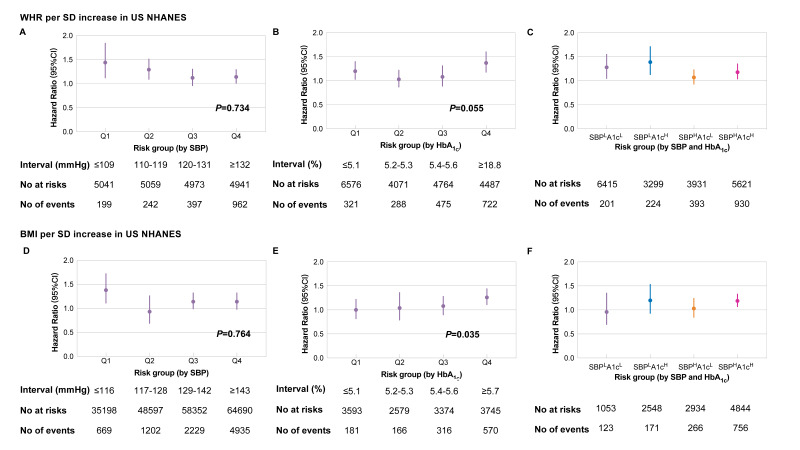
Results: The WHR's effect on mortality was mediated by blood pressure and glucose in the CKB data set by 38.7% (95% confidence interval (CI) = 34.1, 43.2) and 36.4% (95% CI = 31.6, 42.8), whereas in NHANES by 6.0% (95% CI = 2.3, 8.3) and 11.2% (95% CI = 4.7, 22.7), respectively. For associations between BMI and mortality in subjects with overweight or obesity, the mediator proportion of blood glucose and pressure was 49.4% (95% CI = 40.1, 62.5) and 16.9% (95% CI = 13.6, 22.9) in CKB and 9.10% (95% CI = 2.2, 25.9) and 16.7% (95% CI = 7.3, 49.0) in NHANES, respectively. We stratified the patients by their blood glucose, blood pressure level, or both into four groups. The effect of WHR on mortality was comparable across subgroups in either cohort. The associations between BMI and mortality were stronger in patients with higher blood pressure in CKB (P = 0.011) and blood glucose in NHANES (P = 0.035) in patients with overweight and obesity.

Conclusions: The relationship between WHR and mortality in the CKB data set was potentially caused by blood pressure and glucose to a much greater extent than in the NHANES one. The effect of BMI influenced by blood pressure was significantly higher among Chinese individuals with overweight and obesity. These results implicate a different intervention strategy is required for blood pressure and blood glucose in China and US to prevent obesity and obesity-related premature death.


Conflict of interest statement

Disclosure of interest: The authors completed the ICMJE Disclosure of Interest Form (available upon request from the corresponding author) and disclose no relevant interests.

Figures

Figure 1
Figure 1
Direct acyclic graph for mediation analysis. The diagram describes the relationship between obesity (exposure) and mortality (outcome) mediated by blood pressure and glucose (mediators). The exposure-mediator effects were estimated by a linear model, and the exposure-outcome and mediator-outcome effects were estimated by accelerated failure time model, both adjusted by confounders. NDE – natural direct effects, NIE – natural indirect effects.
Figure 2
Figure 2
Risk for all-cause mortality per SD increase in WHR/BMI stratified by blood glucose and pressure in CKB. Panel A. Hazard ratio (95% CI) for all-cause mortality per SD increase in WHR stratified by quartiles of SBP. Panel B. Hazard ratio (95% CI) for all-cause mortality per SD increase in WHR stratified by quartiles of RPG. Panel C. Hazard ratio (95% CI) for all-cause mortality per SD increase in WHR stratified by a combination of SBP and RPG. Panel D. Hazard ratio (95% CI) for all-cause mortality per SD increase in BMI stratified by quartiles of SBP. Panel E. Hazard ratio (95% CI) for all-cause mortality per SD increase in BMI stratified by quartiles of RPG. Panel F. Hazard ratio (95% CI) for all-cause mortality per SD increase in BMI stratified by a combination of SBP and RPG. Hazard ratios were assessed by by Cox regression models adjusted for age, sex, region, education status, household income, current smoking, and alcohol drinking. P-values were estimated by comparing models adding an interaction term between risk group (as linear) and WHR/BMI against the original models, using the likelihood ratio test. Glucose or blood pressure intervals were defined as quartiles. Participants were divided into four groups using the median of SBP and RPG. SBP – systolic blood pressure, RPG – random plasma glucose, SBPLRPGL – SBP lower than the median and RPG lower than the median, SBPHRPGL – SBP higher than the median and RPG lower than the median, SBPLRPGH – SBP lower than the median and RPG higher than the median, SBPHRPGH – SBP higher than the median and RPG higher than the median.
Figure 3
Figure 3
Risk for all-cause mortality per SD increase in WHR/BMI stratified by blood glucose and pressure in US NHANES. Panel A. Hazard ratio (95% CI) for all-cause mortality per SD increase in WHR stratified by quartiles of SBP. Panel B. Hazard ratio (95% CI) for all-cause mortality per SD increase in WHR stratified by quartiles of HbA1c. Panel C. Hazard ratio (95% CI) for all-cause mortality per SD increase in WHR stratified by a combination of SBP and HbA1c. Panel D. Hazard ratio (95% CI) for all-cause mortality per SD increase in BMI stratified by quartiles of SBP. Panel E. Hazard ratio (95% CI) for all-cause mortality per SD increase in BMI stratified by quartiles of HbA1c. Panel F. Hazard ratio (95% CI) for all-cause mortality per SD increase in BMI stratified by a combination of SBP and HbA1c. Hazard ratios were assessed by Cox regression models adjusted for age, sex, race, education status, household income, current smoking, and alcohol drinking. P-value was estimated by comparing models adding an interaction term between risk group (as linear) and WHR/BMI against the original models, using the likelihood ratio test. Glucose or blood pressure intervals were defined as quartiles. Participants were divided into four groups using the median of SBP and RPG. SBP – systolic blood pressure, RPG – random plasma glucose, HbA1c (A1c) – glycated hemoglobin. SBPLA1cL – SBP lower than median and HbA1c lower than median, SBPHA1cL – SBP higher than median and HbA1c lower than median, SBPLA1cH – SBP lower than median and HbA1c higher than median, SBPHA1cH – SBP higher than median and HbA1c higher than median.

References

    1. NCD Risk Factor Collaboration (NCD-RisC) Worldwide trends in body-mass index, underweight, overweight, and obesity from 1975 to 2016: a pooled analysis of 2416 population-based measurement studies in 128.9 million children, adolescents, and adults. Lancet. 2017;390:2627-42. 10.1016/S0140-6736(17)32129-3 - DOI - PMC - PubMed
    1. Di Angelantonio E, Bhupathiraju SN, Wormser D, Gao P, Kaptoge S, de Gonzalez AB, et al. Body-mass index and all-cause mortality: individual-participant-data meta-analysis of 239 prospective studies in four continents. Lancet. 2016;388:776-86. 10.1016/S0140-6736(16)30175-1 - DOI - PMC - PubMed
    1. Gentile CL, Orr JS, Davy BM, Davy KP.Modest weight gain is associated with sympathetic neural activation in nonobese humans. Am J Physiol Regul Integr Comp Physiol. 2007;292:R1834-8. 10.1152/ajpregu.00876.2006 - DOI - PubMed
    1. Genco RJ, Grossi SG, Ho A, Nishimura F, Murayama Y.A Proposed Model Linking Inflammation to Obesity, Diabetes, and Periodontal Infections. J Periodontol. 2005;76 Suppl 11S:2075-84. 10.1902/jop.2005.76.11-S.2075 - DOI - PubMed
    1. Bogers RP, Bemelmans WJ, Hoogenveen RT, Boshuizen HC, Woodward M, Knekt P, et al. Association of overweight with increased risk of coronary heart disease partly independent of blood pressure and cholesterol levels: a meta-analysis of 21 cohort studies including more than 300 000 persons. Arch Intern Med. 2007;167:1720-8. 10.1001/archinte.167.16.1720 - DOI - PubMed

MeSH terms