. 2023 May 1;134(5):1300-1311.
doi: 10.1152/japplphysiol.00348.2022. Epub 2023 Apr 6.

Thermoregulatory responses during road races in hot-humid conditions at the 2019 Athletics World Championships

Affiliations

Thermoregulatory responses during road races in hot-humid conditions at the 2019 Athletics World Championships

Polly Aylwin et al. J Appl Physiol (1985). .

Abstract

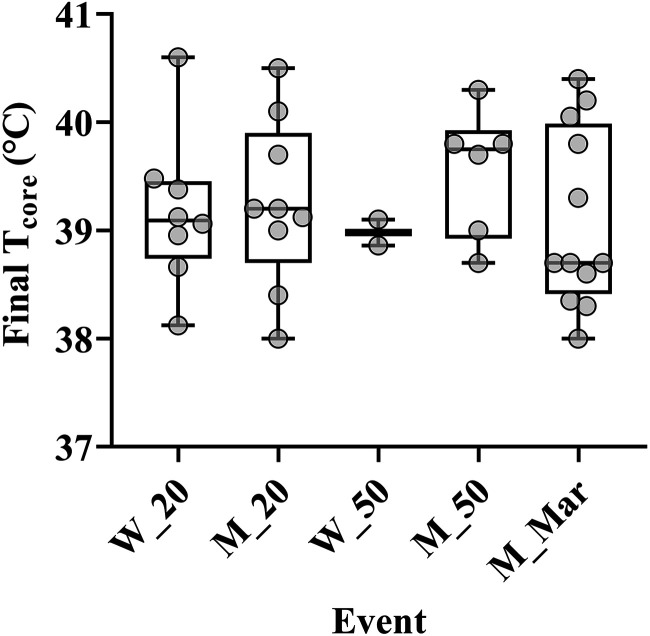
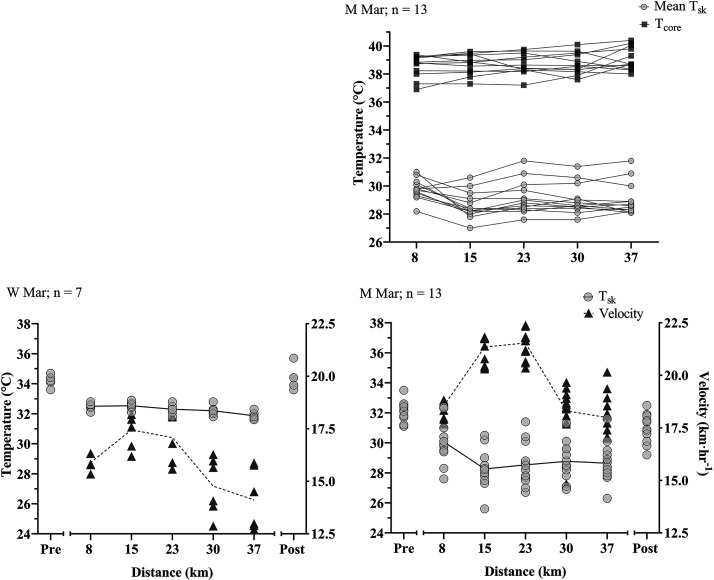
The purpose of this study was to characterize thermoregulatory and performance responses of elite road-race athletes, while competing in hot, humid, night-time conditions during the 2019 IAAF World Athletic Championships. Male and female athletes, competing in the 20 km racewalk (n = 20 males, 24 females), 50 km racewalk (n = 19 males, 8 females), and marathon (n = 15 males, 22 females) participated. Exposed mean skin (Tsk) and continuous core body (Tc) temperature were recorded with infrared thermography and ingestible telemetry pill, respectively. The range of ambient conditions (recorded roadside) was 29.3°C-32.7°C air temperature, 46%-81% relative humidity, 0.1-1.7 m·s-1 air velocity, and 23.5°C-30.6°C wet bulb globe temperature. Tc increased by 1.5 ± 0.1°C but mean Tsk decreased by 1.5 ± 0.4°C over the duration of the races. Tsk and Tc changed most rapidly at the start of the races and then plateaued, with Tc showing a rapid increase again at the end, in a pattern mirroring pacing. Performance times were between 3% and 20% (mean = 113 ± 6%) longer during the championships compared with the personal best (PB) of athletes. Overall mean performance relative to PB was correlated with the wet-bulb globe temperature (WBGT) of each race (R2 = 0.89), but not with thermophysiological variables (R2 ≤ 0.3). As previously reported in exercise heat stress, in this field study Tc rose with exercise duration, whereas Tsk showed a decline. The latter contradicts the commonly recorded rise and plateau in laboratory studies at similar ambient temperatures but without realistic air movement.NEW & NOTEWORTHY This paper provides a kinetic observation of both core and skin temperatures in 108 elite athletes, during various outdoor competition events, adding to the very limited data so far available in the literature taken during elite competitions. The field skin temperature findings contrast previous laboratory findings, likely due to differences in relative air velocity and its impact on the evaporation of sweat. The rapid rise in skin temperature following cessation of exercise highlights the importance of infrared thermography measurements being taken during motion, not during breaks, when being used as a measurement of skin temperature during exercise.

Keywords: competition; endurance; hot temperatures; thermography; thermoregulation.


Conflict of interest statement

No conflicts of interest, financial or otherwise, are declared by the authors.

Figures

None
Graphical abstract
Figure 1.
Figure 1.
Images taken from the MWIR camera, of female athletes, from the anterior, lateral, and posterior perspectives, with indictors of ROIs. ROIs, regions of interest.
Figure 2.
Figure 2.
Data are mean ± standard deviation for the Women’s (W) and Men’s (M) 20 km racewalks. Top graphs show mean core and skin temperatures and mean body temperature. Bottom graphs display mean Tsk, along with air temperature (Tair) and the speed of athletes. Note pre and post data were not available for the Men’s race. *Significant effect of time.
Figure 3.
Figure 3.
Data are mean ± standard deviation for the Women’s (W) and Men’s (M) 50 km racewalks. Top graph shows mean core and skin temperatures. Bottom graphs display mean Tsk, along with air temperature (Tair) and the speed of athletes. Note there is no core temperature data available for the Women’s race. The final time point in the Women’s race has an n = 2 for skin temperature, and pre and post data were not available for the Women’s race or pre for the Men’s. *Significant effect of time, #significant difference between two time points.
Figure 4.
Figure 4.
Data are mean ± standard deviation for the Women’s (W) and Men’s (M) marathons. Top graph shows mean core and skin temperatures. Bottom graphs display mean Tsk, along with air temperature (Tair) and the speed of athletes. Note there is no core temperature data available for the Women’s race. The final time point in the Women’s race has an n = 2 for skin temperature, and pre and post data were not available for the Women’s race or pre for the Men’s. *Significant effect of time.
Figure 5.
Figure 5.
The rate of change per kilometer for skin (solid line) and core (broken line) temperatures for the 20 km racewalk top, 50 km racewalk middle and marathon, bottom graph. Data are expressed as mean ± standard error.
Figure 6.
Figure 6.
Final core temperature, measured in the last kilometer of each race. Box plot minimum values (error bars).
Figure 7.
Figure 7.
Representative skin temperatures of each ROI, during the men’s marathon, separated by the upper body (A; top graph), extremities (B; middle graph), and lower body (C; bottom graph). Data are mean ± standard deviation. ROIs, regions of interest.
Figure A1.
Figure A1.
Individual core (Tcore) and weighted mean skin temperature (Tsk) and velocity during the Women’s (W) and Men’s (M) 20 km racewalks.
Figure A2.
Figure A2.
Individual core (Tcore) and weighted mean skin temperature (Tsk) and velocity during the Women’s (W) and Men’s (M) 50 km racewalks.
Figure A3.
Figure A3.
Individual core (Tcore) and weighted mean skin temperature (Tsk) and velocity during the Women’s (W) and Men’s (M) marathons.

Similar articles

Cited by

References

    1. Intergovernmental Panel on Climate Change. Climate Change 2021: The Physical Science Basis. https://www.ipcc.ch/report/ar6/wg1/ [2021].
    1. Stevens CJ, Taylor L, Dascombe BJ. Cooling during exercise: an overlooked strategy for enhancing endurance performance in the heat. Sports Med 47: 829–841, 2017. doi:10.1007/S40279-016-0625-7. - DOI - PubMed
    1. Hayes M, Castle PC, Ross EZ, Maxwell NS. The influence of hot humid and hot dry environments on intermittent-sprint exercise performance. Int J Sports Physiol Perform 9: 387–396, 2014. doi:10.1123/ijspp.2012-0247. - DOI - PubMed
    1. Racinais S, Moussay S, Nichols D, Travers G, Belfekih T, Schumacher YO, Periard JD. Core temperature up to 41.5°C during the UCI Road Cycling World Championships in the heat. Br J Sports Med 53: 426–429, 2019. doi:10.1136/bjsports-2018-099881. - DOI - PubMed
    1. Henderson MJ, Chrismas BC, Stevens CJ, Coutts AJ, Taylor L. Changes in core temperature during an elite female rugby sevens tournament. Int J Sports Physiol Perform 15: 571–580, 2020. doi:10.1123/IJSPP.2019-0375. - DOI - PubMed

Publication types