. 2023 Jun 1;134(6):1332-1340.
doi: 10.1152/japplphysiol.00021.2023. Epub 2023 Apr 6.

Size-dependent differences in mitochondrial volume density in phrenic motor neurons

Affiliations

Size-dependent differences in mitochondrial volume density in phrenic motor neurons

Matthew J Fogarty et al. J Appl Physiol (1985). .

Abstract

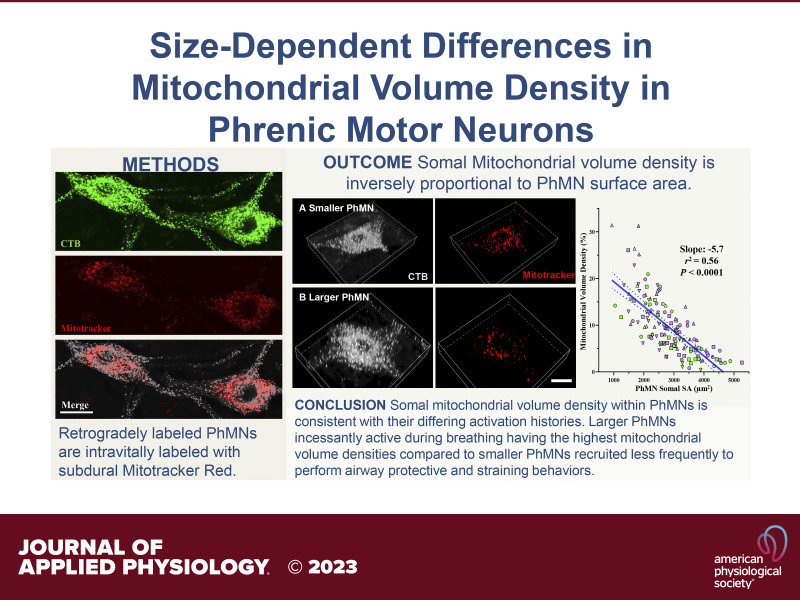
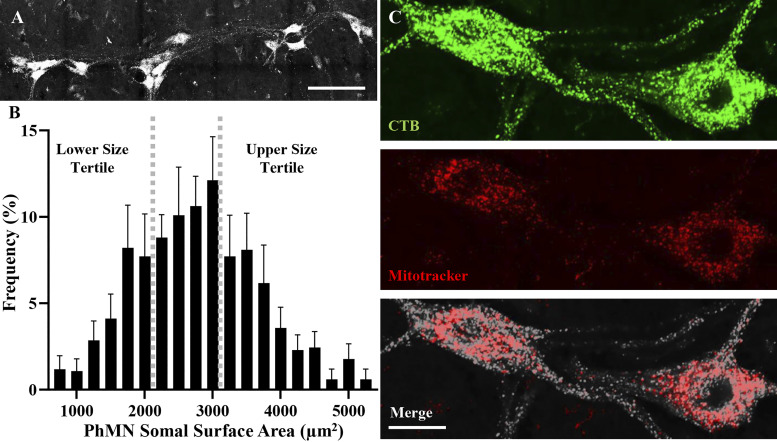
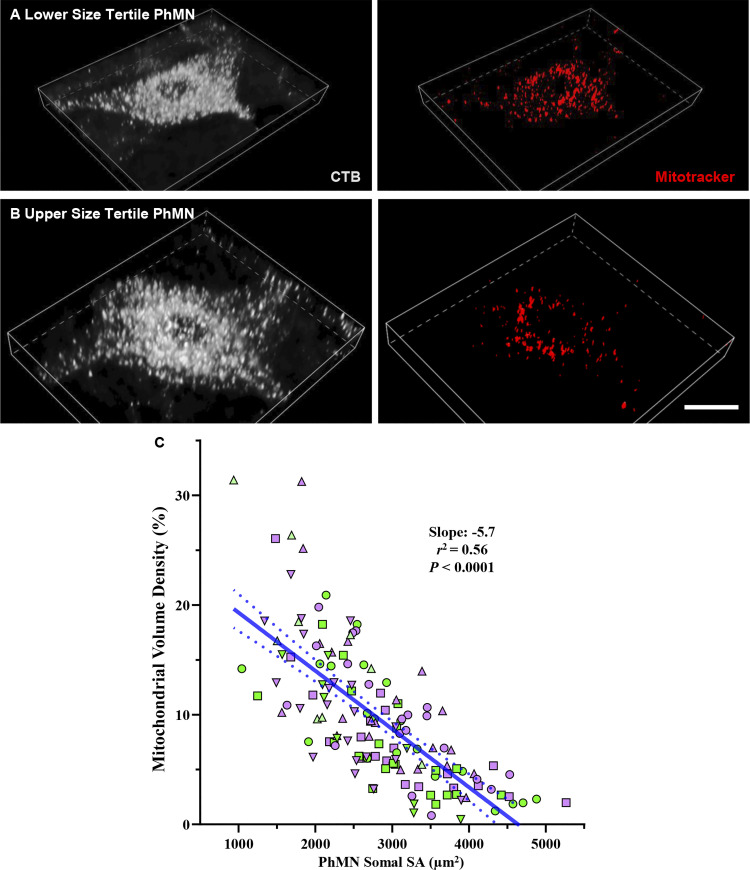
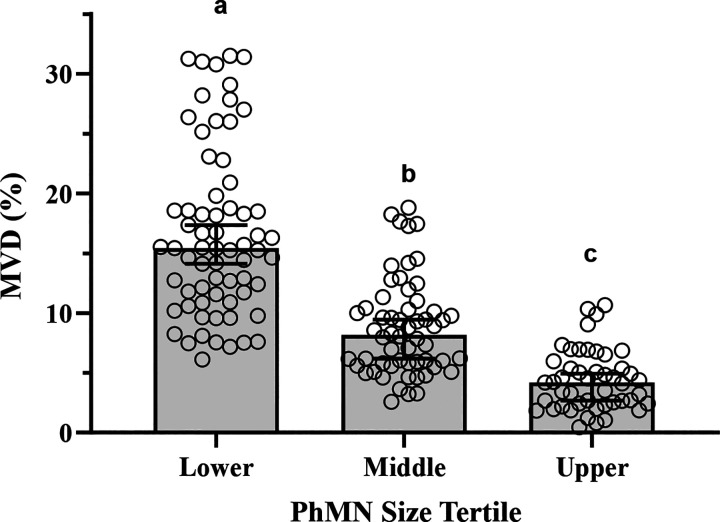
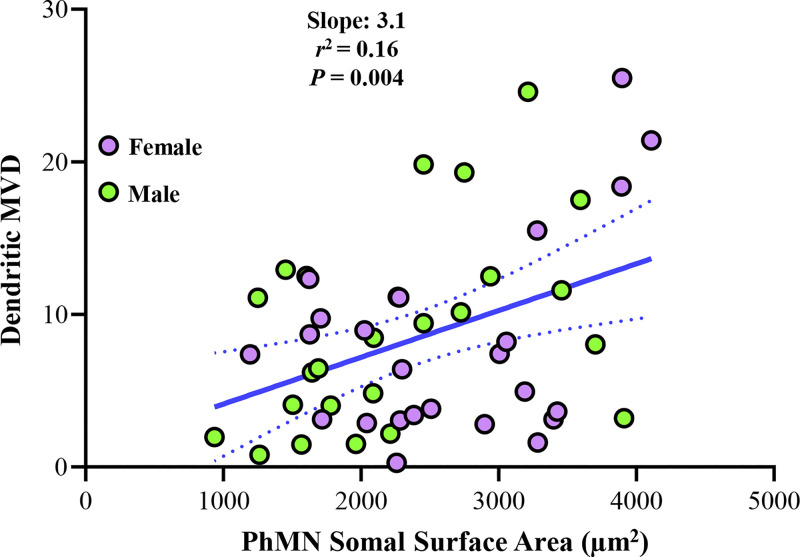
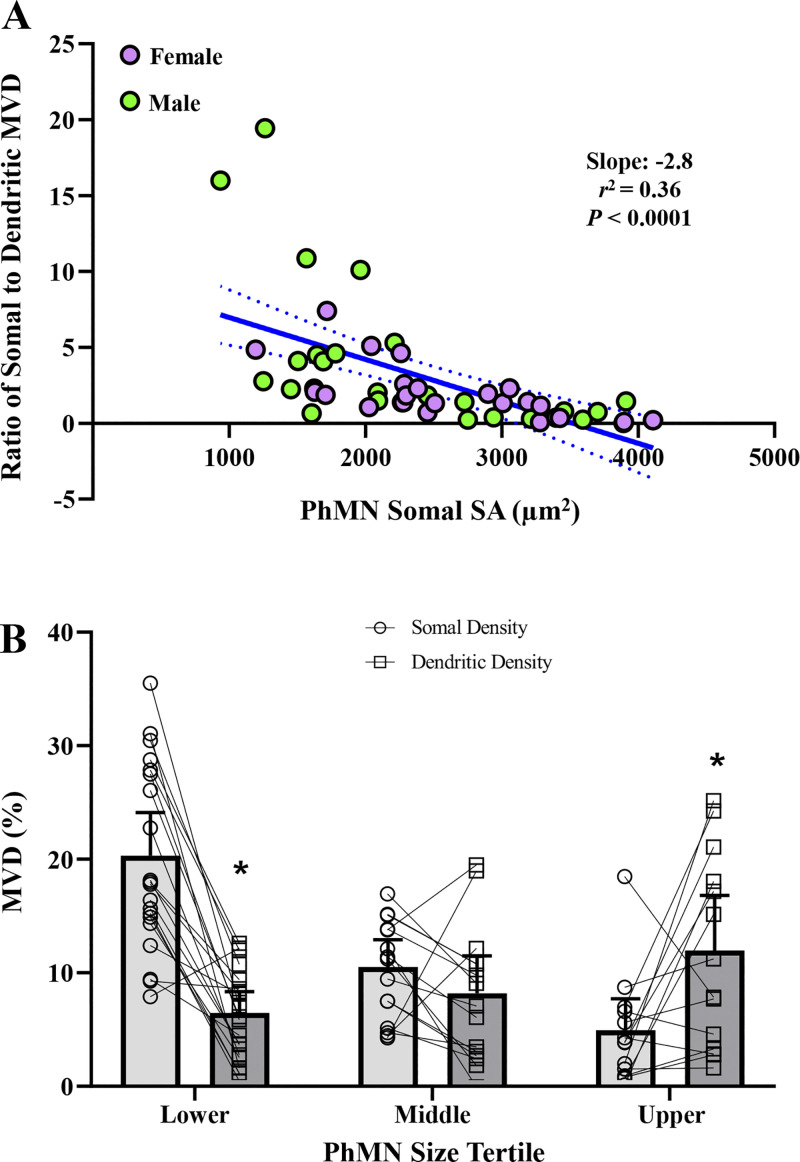
Neuromotor control of diaphragm muscle (DIAm) motor units is dependent on an orderly size-dependent recruitment of phrenic motor neurons (PhMNs). Slow (type S) and fast, fatigue resistant (type FR) DIAm motor units, which are frequently recruited to sustain ventilation, comprise smaller PhMNs that innervate type I and IIa DIAm fibers. More fatigable fast (type FF) motor units, which are infrequently recruited for higher force, expulsive behaviors, comprise larger PhMNs that innervate more type IIx/IIb DIAm fibers. We hypothesize that due to the more frequent activation and thus higher energy demand of type S and FR motor units, the mitochondrial volume density (MVD) of smaller PhMNs is greater compared with larger PhMNs. In eight adult (6 mo old) Fischer 344 rats, PhMNs were identified via intrapleural injection of Alexa488-conjugated cholera toxin B (CTB). Following retrograde CTB labeling, mitochondria in PhMNs were labeled by transdural infusion of MitoTracker Red. PhMNs and mitochondria were imaged using multichannel confocal microscopy using a ×60 oil objective. Following optical sectioning and three-dimensional (3-D) rendering, PhMNs and mitochondria were analyzed volumetrically using Nikon Elements software. Analysis of MVD in somal and dendritic compartments was stratified by PhMN somal surface area. Smaller PhMNs (likely S and FR units) had greater somal MVDs compared with larger PhMNs (likely FF units). By contrast, proximal dendrites or larger PhMNs had higher MVD compared with dendrites of smaller PhMNs. We conclude that more active smaller PhMNs have a higher mitochondrial volume density to support their higher energy demand in sustaining ventilation.NEW & NOTEWORTHY Type S and FR motor units, comprising smaller phrenic motor neurons (PhMNs) are regularly activated to perform indefatigable ventilatory requirements. By contrast, type FF motor units, comprising larger PhMNs, are infrequently activated to perform expulsive straining and airway defense maneuvers. This difference in activation history is mirrored in the mitochondrial volume density (MVD), with smaller PhMNs having higher MVD than larger PhMNs. In proximal dendrites, this trend was reversed, with larger PhMNs having higher MVD than smaller PhMNs, likely due to the maintenance requirements for the larger dendritic arbor of FF PhMNs.

Keywords: MitoTracker; MitoTracker Red; mitochondria; motor neurons.


Conflict of interest statement

No conflicts of interest, financial or otherwise, are declared by the authors.

Figures

None
Graphical abstract
Figure 1.
Figure 1.
Marked size heterogeneity of PhMNs. A: example of maximum intensity projection of a confocal z-scan mosaic showing the wide variety of PhMN sizes. B: the mean (±95% CI) frequency distribution of PhMN surface areas of the rats within this study, with a representation of the tertile cutoffs in gray dashed lines (n = 8 rats; 4 females and 4 males). C: example of fluorescent imaging, with top panel showing CTB retrograde label of PhMNs, middle panel showing the MitoTracker label of neural mitochondria, and bottom panel showing the merge of CTB (gray) and the perinuclear location of MitoTracker. Scale bars: A = 100 µm and C = 15 µm. CI, confidence interval; CTB, cholera toxin B; PhMN, phrenic motor neuron.
Figure 2.
Figure 2.
The inverse relationship between mitochondrial volume density and PhMN somal surface area. A and B: orthogonal 3-D views of small and large somal surface area of CTB-labeled PhMNs, respectively, with deconvolved mitochondrial elements illustrated in the right column of images. C: the x-y plot shows a significant negative relationship between somal mitochondrial volume density (y-axis) and somal surface area (x-axis). n = 172 PhMNs (89 from females and 83 from males) from 8 rats (4 females and 4 males), with each PhMN, its size and MVD being the unit of interest. Each symbol denotes one PhMN mitochondrial volume density estimate, with data from females identified by purple and males identified by green. The symbol shape denotes measures from within a particular subject. Scale bar = 10 µm. CTB, cholera toxin B; 3-D, three-dimensional; MVD, mitochondrial volume density; PhMN, phrenic motor neuron; SA, surface area.
Figure 3.
Figure 3.
Differences in mitochondrial volume density are dependent on PhMN somal size tertile. Scatter plot (mean ± 95% CI) shows that mitochondrial volume densities progressively decrease across the lower to the middle to the upper tertile of PhMN somal surface areas. Lower tertile: n = 67 PhMNs (34 from females and 33 from males); middle tertile: n = 58 PhMNs (33 from females and 25 from males); upper tertile: n = 47 PhMNs (22 from females and 25 from males); with each PhMN’s somal MVD being the unit of interest. Samples obtained from 8 rats (4 females and 4 males). P < 0.0001; Kruskal–Wallis test, different letters denote Dunn’s posttest, where P < 0.05. CI, confidence interval; MVD, mitochondrial volume density; PhMN, phrenic motor neuron.
Figure 4.
Figure 4.
Mitochondrial volume density within proximal dendrites increases with larger PhMN size. In PhMNs where both somal and proximal dendritic analyses were attempted, there was a significant positive relationship between dendritic mitochondrial volume density (y-axis) and somal surface area (x-axis). n = 50 PhMNs (27 from females and 23 from males) from 8 rats (4 females and 4 males), with each PhMN, its size and the dendritic MVD being the unit of interest. Each symbol denotes one PhMN mitochondrial volume density estimate, with data from females identified by purple and males identified by green. MVD, mitochondrial volume density; PhMN, phrenic motor neuron.
Figure 5.
Figure 5.
Differences between somal and dendritic mitochondrial volume density within the same PhMN. A: the ratio of somal to dendritic mitochondrial volume density (MVD) within an individual PhMN (y-axis) is negatively related to PhMN somal surface area (x-axis). n = 50 PhMNs (27 from females and 23 from males) from 8 rats (4 females and 4 males), with each ratio of somal MVD compared with dendritic MVD within each PhMN of differing size being the unit of interest. Each symbol denotes the ratio of the somal MVD to dendritic MVD in one PhMN, with data from females identified by purple and males identified by green. B: scatter plot shows MVD (mean ± 95% CI) in the somas and dendrites of PhMNs within tertiles of different size. When stratified into size tertiles, lower size tertile PhMNs exhibited higher somal MVD compared with dendritic MVD. In upper size tertile PhMN, the opposite occurred with less somal MVD compared with dendritic MVD. Lower tertile: n = 20 PhMNs and dendrites (11 from females and 9 from males); middle tertile: n = 17 PhMNs and dendrites (9 from females and 8 from males); upper tertile: n = 13 PhMNs and dendrites (5 from females and 8 from males); with each PhMN and the somal and dendritic MVDs being the units of interest. Samples obtained from 8 rats (4 females, 4 males). Two-way ANOVA with Bonferroni posttests. *Significant (P < 0.05) difference between soma and dendrite within the tertile. CI, confidence interval; PhMN, phrenic motor neuron.

Similar articles

References

    1. Sieck GC. Neural control of the inspiratory pump. Physiology 6: 260–264, 1991. doi:10.1152/physiologyonline.1991.6.6.260. - DOI
    1. Fogarty MJ, Sieck GC. Evolution and functional differentiation of the diaphragm muscle of mammals. Compr Physiol 9: 715–766, 2019. doi:10.1002/cphy.c180012. - DOI - PMC - PubMed
    1. Sieck GC, Fournier M. Diaphragm motor unit recruitment during ventilatory and nonventilatory behaviors. J Appl Physiol (1985) 66: 2539–2545, 1989. doi:10.1152/jappl.1989.66.6.2539. - DOI - PubMed
    1. Fogarty MJ, Mantilla CB, Sieck GC. Impact of sarcopenia on diaphragm muscle fatigue. Exp Physiol 104: 1090–1099, 2019. doi:10.1113/EP087558. - DOI - PMC - PubMed
    1. Khurram OU, Fogarty MJ, Sarrafian TL, Bhatt A, Mantilla CB, Sieck GC. Impact of aging on diaphragm muscle function in male and female Fischer 344 rats. Physiol Rep 6: e13786, 2018. doi:10.14814/phy2.13786. - DOI - PMC - PubMed

Publication types

LinkOut - more resources