

Myofiber hypertrophy adaptations following 6 weeks of low-load resistance training with blood flow restriction in untrained males and females
- PMID: 37022967
- PMCID: PMC10190928
- DOI: 10.1152/japplphysiol.00704.2022
Myofiber hypertrophy adaptations following 6 weeks of low-load resistance training with blood flow restriction in untrained males and females
Abstract
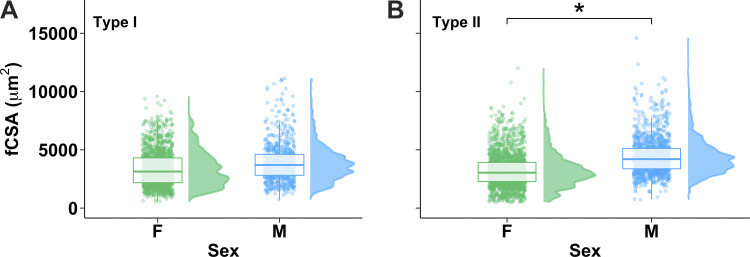
The effects of low-load resistance training with blood flow restriction (BFR) on hypertrophy of type I/II myofibers remains unclear, especially in females. The purpose of the present study is to examine changes in type I/II myofiber cross-sectional area (fCSA) and muscle CSA (mCSA) of the vastus lateralis (VL) from before (Pre) to after (Post) 6 wk of high-load resistance training (HL; n = 15, 8 females) and low-load resistance training with BFR (n = 16, 8 females). Mixed-effects models were used to analyze fCSA with group (HL, BFR), sex (M, F), fiber type (I, II), and time (Pre, Post) included as factors. mCSA increased from pre- to posttraining (P < 0.001, d = 0.91) and was greater in males compared with females (P < 0.001, d = 2.26). Type II fCSA increased pre- to post-HL (P < 0.05, d = 0.46) and was greater in males compared with females (P < 0.05, d = 0.78). There were no significant increases in fCSA pre- to post-BFR for either fiber type or sex. Cohen's d, however, revealed moderate effect sizes in type I and II fCSA for males (d = 0.59 and 0.67), although this did not hold true for females (d = 0.29 and 0.34). Conversely, the increase in type II fCSA was greater for females than for males after HL. In conclusion, low-load resistance training with BFR may not promote myofiber hypertrophy to the level of HL resistance training, and similar responses were generally observed for males and females. In contrast, comparable effect sizes for mCSA and 1-repetition maximum (1RM) between groups suggest that BFR could play a role in a resistance training program.NEW & NOTEWORTHY This is the first study, to our knowledge, to examine myofiber hypertrophy from low-load resistance training with blood flow restriction (BFR) in females. Although this type of training did not result in myofiber hypertrophy, there were comparable increases in muscle cross-sectional area compared with high-load resistance training. These findings possibly highlight that males and females respond in a similar manner to high-load resistance training and low-load resistance training with BFR.
Keywords: blood flow restriction; fiber cross-sectional area; myofiber hypertrophy; vastus lateralis.
Conflict of interest statement
No conflicts of interest, financial or otherwise, are declared by the authors.
Figures


Similar articles
-
Effects of alternating blood flow restricted training and heavy-load resistance training on myofiber morphology and mechanical muscle function.J Appl Physiol (1985). 2020 Jun 1;128(6):1523-1532. doi: 10.1152/japplphysiol.00015.2020. Epub 2020 Apr 23. J Appl Physiol (1985). 2020. PMID: 32324471 Clinical Trial.
-
Acute cellular and molecular responses and chronic adaptations to low-load blood flow restriction and high-load resistance exercise in trained individuals.J Appl Physiol (1985). 2021 Dec 1;131(6):1731-1749. doi: 10.1152/japplphysiol.00464.2021. Epub 2021 Sep 23. J Appl Physiol (1985). 2021. PMID: 34554017
-
Changes in vastus lateralis fibre cross-sectional area, pennation angle and fascicle length do not predict changes in muscle cross-sectional area.Exp Physiol. 2022 Nov;107(11):1216-1224. doi: 10.1113/EP090666. Epub 2022 Sep 30. Exp Physiol. 2022. PMID: 36053170 Free PMC article.
-
Fiber-Type-Specific Hypertrophy with the Use of Low-Load Blood Flow Restriction Resistance Training: A Systematic Review.J Funct Morphol Kinesiol. 2023 Apr 27;8(2):51. doi: 10.3390/jfmk8020051. J Funct Morphol Kinesiol. 2023. PMID: 37218848 Free PMC article. Review.
-
Potential Moderators of the Effects of Blood Flow Restriction Training on Muscle Strength and Hypertrophy: A Meta-analysis Based on a Comparison with High-Load Resistance Training.Sports Med Open. 2024 May 22;10(1):58. doi: 10.1186/s40798-024-00719-3. Sports Med Open. 2024. PMID: 38773002 Free PMC article.
Cited by
-
Commentary: Blood flow restriction combined with resistance training on muscle strength and thickness improvement in young adults: a systematic review, meta-analysis, and meta-regression.Front Physiol. 2024 Oct 17;15:1486727. doi: 10.3389/fphys.2024.1486727. eCollection 2024. Front Physiol. 2024. PMID: 39483750 Free PMC article. No abstract available.
-
Blood flow restriction combined with resistance training on muscle strength and thickness improvement in young adults: a systematic review, meta-analysis, and meta-regression.Front Physiol. 2024 Aug 12;15:1379605. doi: 10.3389/fphys.2024.1379605. eCollection 2024. Front Physiol. 2024. PMID: 39189029 Free PMC article.
-
Sex differences in absolute and relative changes in muscle size following resistance training in healthy adults: a systematic review with Bayesian meta-analysis.PeerJ. 2025 Feb 25;13:e19042. doi: 10.7717/peerj.19042. eCollection 2025. PeerJ. 2025. PMID: 40028215 Free PMC article.
-
Comparing low volume of blood flow restricted to high-intensity resistance training of the finger flexors to maintain climbing-specific strength and endurance: a crossover study.Front Sports Act Living. 2023 Sep 29;5:1256136. doi: 10.3389/fspor.2023.1256136. eCollection 2023. Front Sports Act Living. 2023. PMID: 37841889 Free PMC article.
-
Effects of low-load resistance training with blood flow restriction on muscle fiber myofibrillar and extracellular area.Front Physiol. 2024 Feb 20;15:1368646. doi: 10.3389/fphys.2024.1368646. eCollection 2024. Front Physiol. 2024. PMID: 38444764 Free PMC article.
References
-
- Tanimoto M, Sanada K, Yamamoto K, Kawano H, Gando Y, Tabata I, Ishii N, Miyachi M. Effects of whole-body low-intensity resistance training with slow movement and tonic force generation on muscular size and strength in young men. J Strength Cond Res 22: 1926–1938, 2008. doi:10.1519/JSC.0b013e318185f2b0. - DOI - PubMed
-
- Vann CG, Osburn SC, Mumford PW, Roberson PA, Fox CD, Sexton CL, Johnson MR, Johnson JS, Shake J, Moore JH, Millevoi K, Beck DT, Badisa VL, Mwashote BM, Ibeanusi V, Singh RK, Roberts MD. Skeletal muscle protein composition adaptations to 10 weeks of high-load resistance training in previously-trained males. Front Physiol 11: 259, 2020. doi:10.3389/fphys.2020.00259. - DOI - PMC - PubMed
Publication types
MeSH terms
Grants and funding
LinkOut - more resources
Full Text Sources