. 2023 Apr 7;72(14):355-361.
doi: 10.15585/mmwr.mm7214a1.

Seasonality of Respiratory Syncytial Virus - United States, 2017-2023

Seasonality of Respiratory Syncytial Virus - United States, 2017-2023

Sarah Hamid et al. MMWR Morb Mortal Wkly Rep. .

Abstract

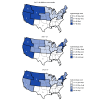
In the United States, respiratory syncytial virus (RSV) infections cause an estimated 58,000-80,000 hospitalizations among children aged <5 years (1,2) and 60,000-160,000 hospitalizations among adults aged ≥65 years each year (3-5). U.S. RSV epidemics typically follow seasonal patterns, peaking in December or January (6,7), but the COVID-19 pandemic disrupted RSV seasonality during 2020-2022 (8). To describe U.S. RSV seasonality during prepandemic and pandemic periods, polymerase chain reaction (PCR) test results reported to the National Respiratory and Enteric Virus Surveillance System (NREVSS)* during July 2017-February 2023 were analyzed. Seasonal RSV epidemics were defined as the weeks during which the percentage of PCR test results that were positive for RSV was ≥3% (9). Nationally, prepandemic seasons (2017-2020) began in October, peaked in December, and ended in April. During 2020-21, the typical winter RSV epidemic did not occur. The 2021-22 season began in May, peaked in July, and ended in January. The 2022-23 season started (June) and peaked (November) later than the 2021-22 season, but earlier than prepandemic seasons. In both prepandemic and pandemic periods, epidemics began earlier in Florida and the Southeast and later in regions further north and west. With several RSV prevention products in development, ongoing monitoring of RSV circulation can guide the timing of RSV immunoprophylaxis and of clinical trials and postlicensure effectiveness studies. Although the timing of the 2022-23 season suggests that seasonal patterns are returning toward those observed in prepandemic years, clinicians should be aware that off-season RSV circulation might continue.


Conflict of interest statement

All authors have completed and submitted the International Committee of Medical Journal Editors form for disclosure of potential conflicts of interest. No potential conflicts of interest were disclosed.

Figures

FIGURE 1
FIGURE 1
Percentage* of polymerase chain reaction test results positive for respiratory syncytial virus, by epidemiologic week — National Respiratory and Enteric Virus Surveillance System, United States, July 2017–February 2023 Abbreviations: PCR = polymerase chain reaction; RSV = respiratory syncytial virus. * Three-week centered moving averages of percentage of RSV-positive PCR test results nationally. The threshold for a seasonal epidemic was set at 3% RSV-positive PCR test results (not based on a moving average).
FIGURE 2
FIGURE 2
Respiratory syncytial virus epidemic onsets* in U.S. Department of Health and Human Services Regions 1–10 and in Florida — National Respiratory and Enteric Virus Surveillance System, United States, July 2017–February 2023§ Abbreviations: FL = Florida; RSV = respiratory syncytial virus. * The epidemic onset was defined as the first of 2 consecutive weeks of a surveillance year when the percentage of PCR tests positive for RSV was ≥3%. Median epidemic onset weeks were calculated for the three RSV epidemics that occurred before the COVID-19 pandemic (2017–18, 2018–19, and 2019–20). https://www.hhs.gov/about/agencies/iea/regional-offices/index.html. Patterns of weekly RSV circulation in Alaska, Florida, and Hawaii are distinct from other states within their assigned regions; therefore, these states were excluded from regional analyses. State-level seasonality for Florida is reported; however, there are an insufficient number of laboratories consistently reporting polymerase chain reaction testing data to present state-level seasonality in Alaska and Hawaii. § Surveillance years were defined based on troughs in RSV circulation. During 2017–2020, surveillance years began in epidemiologic week 27 (early July) and ended the following year in epidemiologic week 26 (late June). The aberrant 2020–21 surveillance year was defined as week 27 through week 8 (late February) inclusive. During the COVID-19 pandemic (2021–22 and 2022–23), surveillance years began in epidemiologic week 9 (early March) and ended the following year in epidemiologic week 8.

References

    1. Hall CB, Weinberg GA, Iwane MK, et al. The burden of respiratory syncytial virus infection in young children. N Engl J Med 2009;360:588–98. 10.1056/NEJMoa0804877 - DOI - PMC - PubMed
    1. McLaughlin JM, Khan F, Schmitt HJ, et al. Respiratory syncytial virus-associated hospitalization rates among US infants: a systematic review and meta-analysis. J Infect Dis 2022;225:1100–11. 10.1093/infdis/jiaa752 - DOI - PMC - PubMed
    1. McLaughlin JM, Khan F, Begier E, Swerdlow DL, Jodar L, Falsey AR. Rates of medically attended RSV among US adults: a systematic review and meta-analysis. Open Forum Infect Dis 2022;9:ofac300. 10.1093/ofid/ofac300 - DOI - PMC - PubMed
    1. Zheng Z, Warren JL, Shapiro ED, Pitzer VE, Weinberger DM. Estimated incidence of respiratory hospitalizations attributable to RSV infections across age and socioeconomic groups. Pneumonia 2022;14:6. 10.1186/s41479-022-00098-x - DOI - PMC - PubMed
    1. Havers FP, Whitaker M, Pham H, et al. 2209. RSV-associated hospitalizations in adults aged ≥18 years and the impact of the COVID-19 pandemic in the United States, October 2018–February 2022. Open Forum Infect Dis 2022;9(Suppl 2):ofac492.1828. 10.1093/ofid/ofac492.1828 - DOI