. 2023 Apr 6;18(4):e0283966.
doi: 10.1371/journal.pone.0283966. eCollection 2023.

Spatial distribution of the Shannon entropy for mass spectrometry imaging

Affiliations

Spatial distribution of the Shannon entropy for mass spectrometry imaging

Lili Xu et al. PLoS One. .

Abstract

Mass spectrometry imaging (MSI) allows us to visualize the spatial distribution of molecular components in a sample. A large amount of mass spectrometry data comprehensively provides molecular distributions. In this study, we focus on the information in the obtained data and use the Shannon entropy as a quantity to analyze MSI data. By calculating the Shannon entropy at each pixel on a sample, the spatial distribution of the Shannon entropy is obtained from MSI data. We found that low-entropy pixels in entropy heat maps for kidneys of mice had different structures between two ages (3 months and 31 months). Such changes cannot be visualized by conventional imaging techniques. We further propose a method to find informative molecules. As a demonstration of the proposed scheme, we identified two molecules by setting a region of interest which contained low-entropy pixels and by exploring changes of peaks in the region.


Conflict of interest statement

The authors declare no conflict of interest.

Figures

Fig 1
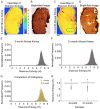
Fig 1. Shannon entropy calculated from the mass spectrum.
(A) The bright-field image of the sagittal rat brain using MALDI-FT-ICR-MSI with 2,5-dihydroxybenzoic acid (DHB) matrix [20]. (B-D) Mass spectra at three different spots on the rat brain (pi: relative mass spectral intensity). At these spots, Shannon entropy values were 6.1 (B), 6.8 (C), and 7.5 (D), respectively. (E) The heat map of the Shannon entropy from the rat brain. The scale bar denotes 1 mm.
Fig 2
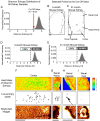
Fig 2. Shannon entropy for the two kidneys.
Entropy heat maps (A and C) and bright-field images (B and D) are shown for the 3- and 31-month mouse kidneys, respectively. Black arrows show examples of high entropy regions. A low-entropy region which appeared only for the 31-month kidney was marked by a black dashed oval. (E and F) Histograms of the Shannon entropy of two samples. (G) The two histograms were superimposed. (H) Box plots for the 3- and 31-month kidneys. Scale bars denote 1 mm.
Fig 3
Fig 3. Detection of low-entropy spots in the mouse kidneys.
(A) The distribution of the Shannon entropy from two kidney samples. (B-C) Low-entropy spots were plotted on the kidney images. Outlines of the kidneys are shown by black solid lines. (D-E) Histograms of the Shannon entropy for the 3- and 31-month mouse kidneys. Enlarged kidney images for the 31-month mouse of the cortex (F), pelvis (G), and the renal capsule (H) in addition to the renal cysts (I). Scale bars denote 1 mm.
Fig 4
Fig 4. ROIs for two kidneys and MALDI-MSI ion images.
(A) The entropy heat map for the 3-month kidney with the ROI marked by a black oval. (B) Ion image of m/z 778.5 for the 3-month mouse. (C) Ion image of m/z 766.5 for the 3-month mouse. (D) The entropy heat map for the 31-month kidney with the ROI marked by a black oval. (E) Ion image of m/z 778.5 for the 31-month mouse. (F) Ion image of m/z 766.5 for the 31-month mouse. Scale bars show 1 mm.
Fig 5
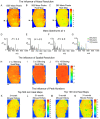
Fig 5. Effects of mass and spatial resolutions on entropy heat maps.
(A-C) Entropy heat maps with low m/z resolutions created by the reduction of the number of intensities to (A) 1250, (B) 500, and (C) 250. (D-F) Mass spectra for three mass resolutions at the identical position (indicated * in (A-C)). (G) Three spectra together with the original spectrum with 2500 intensities. (H-J) Reduced spatial resolutions, by the binning of pixels by the factor (H) 2, (I) 5, and (J) 10. (K-L) Entropy heat maps with top 500 m/z peaks. (M-N) Entropy heat maps with top 100 m/z peaks. Scale bars indicate 1 mm.

References

    1. Chughtai K, Heeren RMA. Mass spectrometric imaging for biomedical tissue analysis. Chem Rev. 2010;110: 3237–3277. doi: 10.1021/cr100012c - DOI - PMC - PubMed
    1. Spengler B. Mass spectrometry imaging of biomolecular information. Anal Chem. 2015;87: 64–82. doi: 10.1021/ac504543v - DOI - PubMed
    1. Saito Y, Waki M, Hameed S, Hayasaka T, Setou M. Development of imaging mass spectrometry. Biol Pharm Bull. 2012;35: 1417–1424. doi: 10.1248/bpb.b212007 - DOI - PubMed
    1. Aizat WM, Ismail I, Noor NM. Recent development in omics studies. Adv Exp Med Biol. 2018;1102: 1–9. doi: 10.1007/978-3-319-98758-3_1 - DOI - PubMed
    1. Roach TNF. Use and abuse of entropy in biology: A case for caliber. Entropy. 2020;22: 1–8. doi: 10.3390/e22121335 - DOI - PMC - PubMed

Publication types