. 2023 Apr 6;18(4):e0284025.
doi: 10.1371/journal.pone.0284025. eCollection 2023.

Estimating the undetected emergence of COVID-19 in the US

Affiliations

Estimating the undetected emergence of COVID-19 in the US

Emily M Javan et al. PLoS One. .

Abstract

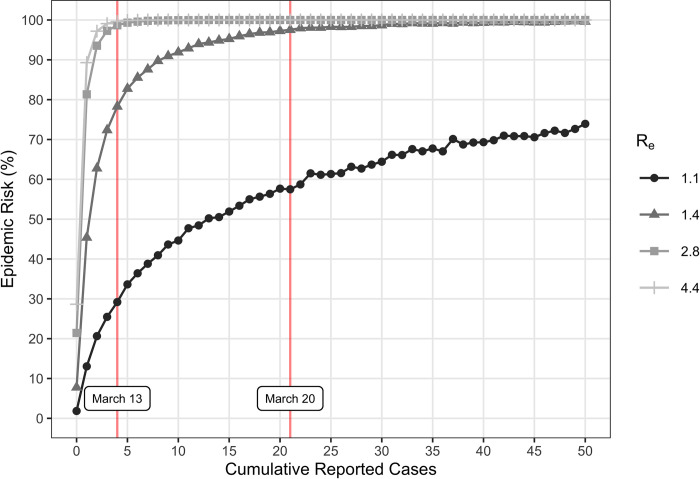
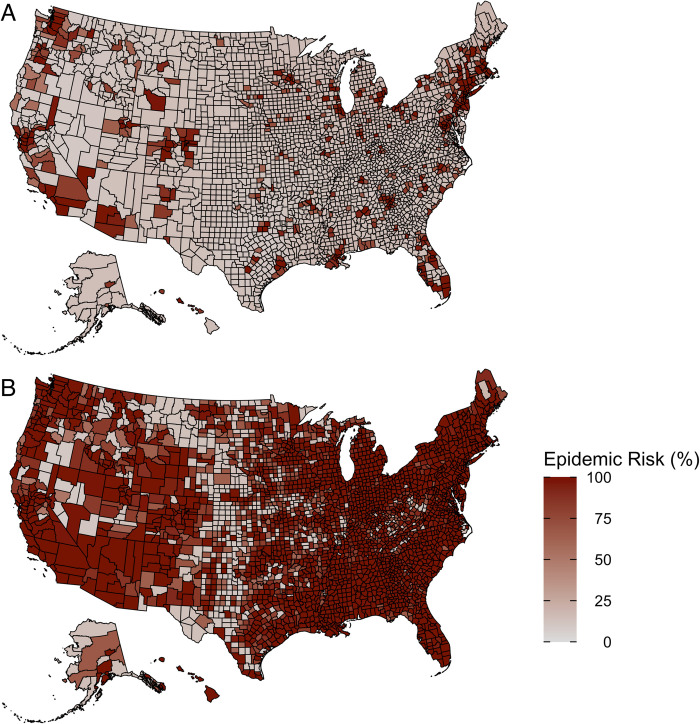
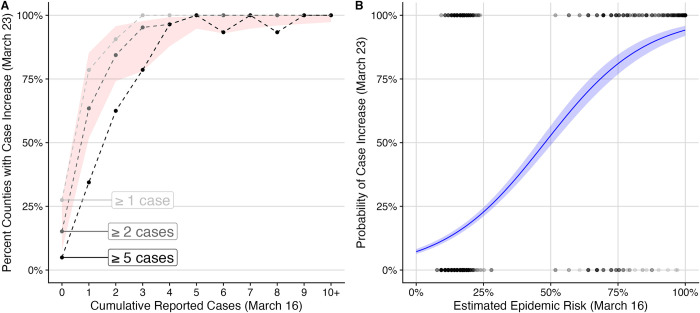
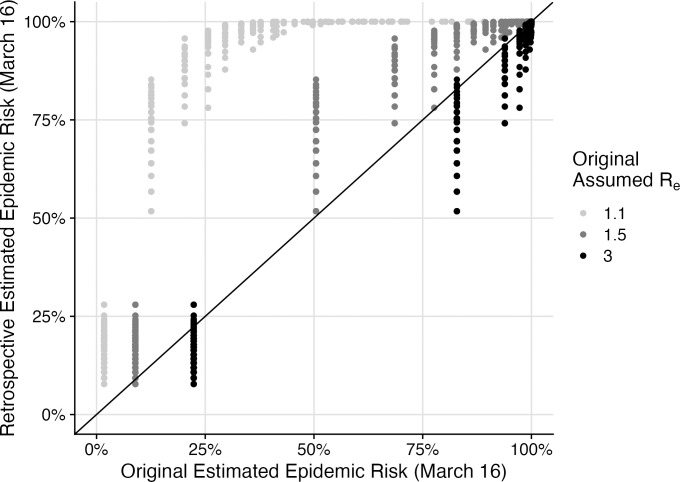
As SARS-CoV-2 emerged as a global threat in early 2020, China enacted rapid and strict lockdown orders to prevent introductions and suppress transmission. In contrast, the United States federal government did not enact national orders. State and local authorities were left to make rapid decisions based on limited case data and scientific information to protect their communities. To support local decision making in early 2020, we developed a model for estimating the probability of an undetected COVID-19 epidemic (epidemic risk) in each US county based on the epidemiological characteristics of the virus and the number of confirmed and suspected cases. As a retrospective analysis we included county-specific reproduction numbers and found that counties with only a single reported case by March 16, 2020 had a mean epidemic risk of 71% (95% CI: 52-83%), implying COVID-19 was already spreading widely by the first detected case. By that date, 15% of US counties covering 63% of the population had reported at least one case and had epidemic risk greater than 50%. We find that a 10% increase in model estimated epidemic risk for March 16 yields a 0.53 (95% CI: 0.49-0.58) increase in the log odds that the county reported at least two additional cases in the following week. The original epidemic risk estimates made on March 16, 2020 that assumed all counties had an effective reproduction number of 3.0 are highly correlated with our retrospective estimates (r = 0.99; p<0.001) but are less predictive of subsequent case increases (AIC difference of 93.3 and 100% weight in favor of the retrospective risk estimates). Given the low rates of testing and reporting early in the pandemic, taking action upon the detection of just one or a few cases may be prudent.


Conflict of interest statement

The authors have declared that no competing interests exist.

Figures

Fig 1
Fig 1. Epidemic risk for the effective reproduction numbers (Re) corresponding to reduced risk (1.1) and the minimum (1.4), median (2.8), and maximum (4.4) estimated across all US counties.
For a given number of reported cases, epidemic risk increased with estimated Re. Epidemic risk is the percent of 100,000 simulations, for each Re, that become epidemics. We classified a simulation as an epidemic if it reached 2,000 cumulative infections and had a minimum prevalence of 50 new infections per day. By the time a single case was reported, there was a 13%, 45%, 81%, or 89% chance of an ongoing epidemic for an Re of 1.1 (reduced risk), 1.4 (minimum), 2.8 (median), or 4.4 (maximum), respectively. County-specific risk was estimated from these curves. For example, Travis County, TX (red lines) had an Re of 2.0, which corresponds to an epidemic risk of 95% on March 13, 2020 and 99% on March 20, 2020 based on cumulative reported case counts of four and twenty-one on those dates, respectively. If the Re was instead estimated as 1.1 in Travis County, then the estimated risk would decrease to 57% based on the twenty-one cases reported on March 20. The model assumed a 10% case detection rate, generation time of 6.0 days, a latent period of 2.9 days, and infectious period of 6.2 days (Table 1 - retrospective).
Fig 2
Fig 2
Estimated COVID-19 epidemic risk in 3,142 US counties as of March 16 (A) and April 13, 2020 (B). Epidemic risk was determined for each county based on its effective reproduction number (Re) as estimated in [7], alongside the number of reported cases in the county on the specific date as described in Fig 1. Epidemic risk is the percent of 100,000 simulations for the county that become epidemics. We classified a simulation as an epidemic if it reached 2,000 cumulative infections and had a minimum prevalence of 50 new infections per day [5]. County-specific Re ranged from 1.4 to 4.4 with a median of 2.8. The model assumed a 10% case detection rate, generation time of 6.0 days, a latent period of 2.9 days, and infectious period of 6.2 days (Table 1 - retrospective).
Fig 3
Fig 3. Expected time until the local epidemic exceeds 1,000 cumulative infections in a county, assuming Re = 2.8, a 10% case detection rate, and generation time of 6.0 days.
For a given number of cumulative reported cases (x-axis), we assume an epidemic is underway then estimate the median and 95% CI (error bars) number of weeks until the cumulative infections reach or exceed 1,000. When the first case is reported, we expect cumulative infections to surpass 1,000 in 3.4 (95% CI 2.0–7.3) weeks; when the 10th case is reported, the expected lead time shrinks to 1.5 (95% CI 1.0–2.9) weeks. The estimates are based on 100,000 stochastic simulations of the retrospective model (Table 1).
Fig 4
Fig 4. Comparison of estimated epidemic risks and reported increases in cases at the county level between March 16 and March 23, 2020.
(A) Proportion of all US counties that had specified one-week increase in reported COVID-19 cases, compared to the cumulative case count in the county as of March 16, 2020 (x-axis) [16]. The light, medium and dark gray lines correspond to increases of at least one, two, or five new reported cases within one week, respectively. The red ribbon indicates model estimates for the probability that an epidemic is underway, depending on the cumulative reported cases. The bottom and top of the ribbon correspond to estimates for the lowest and highest risk counties across the United States, where risk is estimated based on county-specific estimates of Re and the cumulative number of reported cases on March 16. These estimates are calculated based on 100,000 simulations for each reproduction number (Re = 1.4 to 4.4 by 0.1), assuming a 10% case detection rate and a generation time of 6.0 days. (B) Estimates of epidemic risks on March 16 correlate with case count increases in the subsequent week across all counties. Points indicate whether counties reported at least two new COVID-19 cases between March 16 and March 23, where the bottom and top of the graph correspond to counties that did or did report such increases. The line and shading indicate the estimated mean (line) and 95% confidence interval (ribbon) resulting from a logistic regression relating actual one-week reported increase to estimated risk on March 16, 2020. We estimate that a 10% increase in estimated risk corresponds to a 0.53 (95% CI: 0.49–0.58) increase in the log odds that the county reported at least two additional cases in the following week.
Fig 5
Fig 5. Comparison of original epidemic risk estimates, assuming a uniform Re across counties, and retrospective estimates, assuming empirical county-level estimates of Re on March 16, 2020 across 3,142 US counties.
Each point corresponds to a pair of risk estimates (original on x-axis vs retrospective on y-axis) for a single county. Points are shaded according to the assumed effective reproduction number for the original estimate. The solid diagonal line indicates matching estimates.

Similar articles

Cited by

References

    1. Dong E, Du H, Gardner L. An interactive web-based dashboard to track COVID-19 in real time. Lancet Infect Dis. 2020;20: 533–534. doi: 10.1016/S1473-3099(20)30120-1 - DOI - PMC - PubMed
    1. Ansari FM, Aggarwal K, Chopra A, Agrawal MG, Soni P, Agarwal P, et al.. Asymptomatic coronavirus: a boon or bane? J Adv Med Dent Sci Res. 2020;8: 109–111. doi: 10.21276/jamdsr - DOI
    1. Li R, Pei S, Chen B, Song Y, Zhang T, Yang W, et al.. Substantial undocumented infection facilitates the rapid dissemination of novel coronavirus (SARS-CoV-2). Science (80-). 2020;368: 489–493. doi: 10.1126/science.abb3221 - DOI - PMC - PubMed
    1. Havers FP, Reed C, Lim T, Montgomery JM, Klena JD, Hall AJ, et al.. Seroprevalence of antibodies to SARS-CoV-2 in 10 sites in the United States, March 23-May 12, 2020. JAMA Intern Med. 2020;180: 1776–1786. doi: 10.1001/jamainternmed.2020.4130 - DOI - PubMed
    1. Castro LA, Fox SJ, Chen X, Liu K, Bellan SE, Dimitrov NB, et al.. Assessing real-time Zika risk in the United States. BMC Infect Dis. 2017;17: 1–9. doi: 10.1186/s12879-017-2394-9 - DOI - PMC - PubMed

Publication types