. 2023 Apr 11;120(15):e2218083120.
doi: 10.1073/pnas.2218083120. Epub 2023 Apr 6.

Infection of primary nasal epithelial cells differentiates among lethal and seasonal human coronaviruses

Affiliations

Infection of primary nasal epithelial cells differentiates among lethal and seasonal human coronaviruses

Clayton J Otter et al. Proc Natl Acad Sci U S A. .

Abstract

The nasal epithelium is the initial entry portal and primary barrier to infection by all human coronaviruses (HCoVs). We utilize primary human nasal epithelial cells grown at air-liquid interface, which recapitulate the heterogeneous cellular population as well as mucociliary clearance functions of the in vivo nasal epithelium, to compare lethal [Severe acute respiratory syndrome (SARS)-CoV-2 and Middle East respiratory syndrome-CoV (MERS-CoV)] and seasonal (HCoV-NL63 and HCoV-229E) HCoVs. All four HCoVs replicate productively in nasal cultures, though replication is differentially modulated by temperature. Infections conducted at 33 °C vs. 37 °C (reflective of temperatures in the upper and lower airway, respectively) revealed that replication of both seasonal HCoVs (HCoV-NL63 and -229E) is significantly attenuated at 37 °C. In contrast, SARS-CoV-2 and MERS-CoV replicate at both temperatures, though SARS-CoV-2 replication is enhanced at 33 °C late in infection. These HCoVs also diverge significantly in terms of cytotoxicity induced following infection, as the seasonal HCoVs as well as SARS-CoV-2 cause cellular cytotoxicity as well as epithelial barrier disruption, while MERS-CoV does not. Treatment of nasal cultures with type 2 cytokine IL-13 to mimic asthmatic airways differentially impacts HCoV receptor availability as well as replication. MERS-CoV receptor DPP4 expression increases with IL-13 treatment, whereas ACE2, the receptor used by SARS-CoV-2 and HCoV-NL63, is down-regulated. IL-13 treatment enhances MERS-CoV and HCoV-229E replication but reduces that of SARS-CoV-2 and HCoV-NL63, reflecting the impact of IL-13 on HCoV receptor availability. This study highlights diversity among HCoVs during infection of the nasal epithelium, which is likely to influence downstream infection outcomes such as disease severity and transmissibility.

Keywords: MERS-CoV; NL63; SARS-CoV-2; human coronavirus; nasal epithelium.


Conflict of interest statement

The authors have organizational affiliations to disclose, S.R.W. is on the Scientific Advisory Boards of Immunome, Inc., and Ocugen, Inc., consulted for Merck and Pfizer. N.A.C. consults for GSK, AstraZeneca, Novartis, Sanofi/Regeneron, and Oyster Point Pharmaceuticals, has US Patent "Therapy and Diagnostics for Respiratory Infection" (10,881,698 B2, WO20913112865), and a licensing agreement with GeneOne Life Sciences.

Figures

Fig. 1.
Fig. 1.
SARS-CoV-2, MERS-CoV, and HCoV-NL63 replicate productively in nasal epithelial cultures. Nasal ALI cultures derived from six donors were infected in triplicate with SARS-CoV-2, MERS-CoV, or HCoV-NL63 at MOI = 5 PFU/cell. ASL was collected at 48, 96, and 144 h post infection (hpi), and infectious virus was quantified by a plaque assay. (A) Titers from each of the six donors were averaged for each time point and depicted as mean ± SD for each virus. (BD) Average titers for SARS-CoV-2 (B), MERS-CoV (C), and HCoV-NL63 (D) infected cultures derived from individual donors. Donor numbers are shown in the key to the right. Each time point represents averaged titer from three transwells derived from that donor, displayed as mean ± SD.
Fig. 2.
Fig. 2.
Replication of HCoV-NL63 and SARS-CoV-2, but not MERS-CoV, is modulated by temperature. Nasal ALI cultures were equilibrated at 33 °C or 37 °C for 1 d prior to infection, then were infected at MOI = 5 PFU/cell in triplicate, and incubated at 33 °C or 37 °C. ASL was collected at 48, 96, and 144 hpi and viral titers quantified via a plaque assay. (A and B) Average titers from triplicate cultures derived from seven donors infected with SARS-CoV-2 and MERS-CoV are shown as mean ± SD. (C) Average titers from triplicate cultures derived from four donors infected with HCoV-NL63. Statistical significance of changes in viral titer in cultures incubated at 33 °C vs. 37 °C for each virus was calculated by repeated measures two-way ANOVA: *P ≤ 0.05; **P ≤ 0.01. Comparisons without asterisks are nonsignificant.
Fig. 3.
Fig. 3.
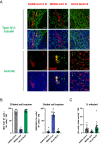
SARS-CoV-2 and HCoV-NL63 infect ciliated nasal epithelial cells, while MERS-CoV infects goblet cells. (A) Representative images of infected nasal ALI cultures to identify cellular tropism. Infected cells were identified using primary antibodies against viral nucleocapsid for each HCoV. Primary antibodies against ciliated cell marker type βIV Tub and mucin MUC5AC were used to identify ciliated epithelial cells and goblet cells, respectively. Nuclei were stained with Hoescht. Note for MERS-CoV, an antibody specific to MERS-CoV nonstructural protein 8 (nsp8) was used in place of MERS-CoV nucleocapsid due to species incompatibility with the MUC5AC antibody. Images shown are representative of images acquired from nasal ALI cultures derived from 16 donors; three high-power (40× magnification) fields were analyzed in a transwell derived from each donor infected with each HCoV. (Scale bars in each image are 50 μm.) Infected transwells were fixed at a different time point for each virus given differing replication kinetics: SARS-CoV-2 (48 hpi), MERS-CoV (96 hpi), and HCoV-NL63 (24 hpi). Representative images from mock-infected cultures stained with type βIV Tub, MUC5AC, and each HCoV nucleocapsid antibody confirming the absence of nonspecific signal can be found in SI Appendix, Fig. S1. (B) Percentage of infected cells that are either ciliated or goblet cells for each HCoV. Ten images from at least five different donors were quantified for each cell type for each HCoV. (C) Total percentage of infected cells for each HCoV calculated as number of N+ cells divided by total number of cells. % infection was calculated using each of the images used for cell tropism quantification (20 images per HCoV).
Fig. 4.
Fig. 4.
SARS-CoV-2 and HCoV-NL63 disrupt nasal epithelial barrier integrity. Nasal ALI cultures derived from 11 donors in three independent experiments were infected with SARS-CoV-2, MERS-CoV, or HCoV-NL63 at MOI = 5 PFU/cell. TEER was measured prior to infection (0 hpi) and at 96 and 192 hpi. (A) ∆TEER values were calculated by subtracting baseline TEER (0 hpi) from TEER at 192 hpi. Each point on the scatterplot denotes the ∆TEER value for an individual transwell; data from duplicate/triplicate cultures from 11 donors is shown. The average ∆TEER is shown as a bar graph for each virus, depicted as mean ± SD. (BD) TEER values for individual transwells derived from four donors infected with each HCoV are shown, illustrating TEER changes within-transwell over time. These data are representative of TEER traces acquired from cultures derived from 11 donors. (E) ASL from the four donors in BD was titered via a plaque assay to confirm productive replication of each virus in these cultures. (F) TEER values for individual transwells are shown for duplicate cultures derived from four donors infected with WT MERS-CoV or MERS-CoV mutant (MERS-CoV-nsp15H231A/∆NS4A). For TEER traces (BD, and F), transwells derived from the same donor are color-coded, with donor numbers shown in the key to the right. Statistical significance of ∆TEER values for each virus compared with mock-infected cultures was calculated by one-way ANOVA: **P ≤ 0.01; ****P ≤ 0.0001. Data that did not reach significance are labeled ns.
Fig. 5.
Fig. 5.
SARS-CoV-2 and HCoV-NL63, but not MERS-CoV, induce cytotoxicity in infected nasal epithelial cultures. Nasal ALI cultures derived from 11 donors in three independent experiments were infected with SARS-CoV-2, MERS-CoV, or HCoV-NL63 and ASL was collected at 0, 96, 192 hpi. LDH in ASL was quantified, and % cytotoxicity was calculated relative to cultures treated with 2% Triton X-100. (A) Apical LDH values from triplicate cultures derived from four donors infected with each HCoV were averaged and reported as mean ± SD; each point represents the average % cytotoxicity among triplicate cultures from one donor. Dotted lines connect the average cytotoxicity among all four donors for each HCoV. *** indicates average cytotoxicity in SARS-CoV-2 and HCoV-NL63-infected cultures is significantly higher than that of MERS-CoV-infected cultures at 192 hpi (P ≤ 0.001 by two-way ANOVA). No comparisons reached significance at 96 hpi. Data from four donors shown here are representative of LDH data from infected cultures derived from 11 total donors. (B) % cytotoxicity values from infected cultures derived from all 11 donors were averaged and reported as mean ± SD for each virus. (C) % cytotoxicity values from duplicate cultures derived from four donors and infected with WT MERS-CoV or MERS-CoV mutant (MERS-CoV-nsp15H231A/∆NS4A), reported as mean ± SD. Statistical significance of average % cytotoxicity values for each virus was compared at each time point via two-way ANOVA: ***P ≤ 0.001; ****P ≤ 0.0001. Comparisons that did not reach significance are denoted ns.
Fig. 6.
Fig. 6.
HCoV-229E replicates in nasal cultures and induces an early cytotoxicity signature. (A) Nasal ALI cultures derived from 4 donors were infected in duplicate with HCoV-229E at MOI = 5 PFU/cell and incubated at either 33 °C or 37 °C. ASL was collected at 0, 48 96, and 144 hpi and HCoV-229E viral titers determined via a plaque assay, reported as mean ± SD for each of the four donors. (B) Cultures from an additional four donors were infected at MOI = 5 and ASL collected at 0, 96, and 192 hpi for titer quantification. (C) ∆TEER values for each HCoV-229E-infected culture were calculated by subtracting TEER at baseline from 96 hpi TEER values (96–0) or by subtracting TEER at baseline from 192 hpi TEER values (192–0). Each point represents ∆TEER calculated from a single transwell, with bars indicating average ∆TEER for that time point comparison. ∆TEER for donor-matched mock-infected cultures also shown for each time point. (D) TEER measured prior to infection (0 hpi), as well as at 96 and 192 hpi, is plotted for each transwell infected with HCoV-229E to track TEER changes over time. Transwells derived from the same donor are color-coded according to the donor number key to the right. (E) ASL was used for LDH quantification to determine % cytotoxicity relative to nasal cultures treated with Triton X-100 (ceiling). Each point represents the average % cytotoxicity at the indicated time point from duplicate transwells from each donor, and the overall average % cytotoxicity is shown with bars. Statistical significance of changes in viral titer in cultures incubated at 33 ºC vs 37 ºC for each virus was calculated by one-way ANOVA. Statistical significance of ∆TEER values in 229E- vs. mock-infected cultures was calculated by paired t-test. *, P ≤ 0.05; ***, P ≤ 0.001.
Fig. 7.
Fig. 7.
IL-13 treatment of nasal epithelial cultures impacts HCoV receptor abundance and cellular distribution. (A and B) Uninfected nasal ALI cultures derived from three donors were sham-treated or treated with IL-13 in triplicate for the final 2 wk of differentiation, and total RNA was harvested and expression of DPP4 (A) and ACE2 (B) mRNA was quantified by RT-qPCR and expressed as fold change over sham-treated cultures using the 2−Δ(ΔCT) formula. Data are displayed as mean ± SD. (C) Uninfected sham- and IL-13-treated ALI cultures were fixed and stained with primary antibodies against DPP4 and MUC5AC. Representative images from one of four donors analyzed in this way are shown. (D) Uninfected ALI cultures derived from pooled donors (cells from four donors pooled prior to plating on transwells) were sham- or IL-13-treated and total protein was harvested for analysis via western blot. ALI cultures derived from 10 donors (for SARS-CoV-2 and MERS-CoV) or seven donors (for HCoV-NL63) were sham- or IL-13-treated prior to infection with each HCoV and total protein harvested for similar western blot analysis. Proteins were separated via SDS-PAGE and immunoblotted with antibodies against DPP4, ACE2, MUC5AC, type βIV Tub, nucleocapsid (N) for each of SARS-CoV-2 (SARS-2), MERS-CoV (MERS), and HCoV-NL63 (NL63), and glyceraldehyde 3-phosphate dehydrogenase (GADPH). Data are representative of similar findings in 10 (for SARS-CoV-2 or MERS-CoV) or seven (for HCoV-NL63) donors total.
Fig. 8.
Fig. 8.
HCoV replication is significantly impacted by IL-13 treatment of nasal epithelial cultures. Nasal ALI cultures derived from 10 donors (for SARS-CoV-2 and MERS-CoV), seven donors (for HCoV-NL63), or four donors (for HCoV-229E) were sham- or IL-13-treated for the final 2 wk of differentiation and then were infected in triplicate with each HCoV. ASL was collected at 48 and 96 hpi and infectious virus quantified via a plaque assay. (A) Viral titer at 48 hpi for sham- and IL-13-treated cultures infected with each HCoV was averaged by donor and plotted as before-and-after plots, connecting mean titer in sham-treated cultures (gray) with mean titer in IL-13-treated cultures (green). Each set of connected lines represents titer data from one donor. (B) Similar before-and-after plots comparing 96 hpi titers in donor-matched sham- vs. IL-13 treated cultures. Statistical significance of the difference in titer in sham vs. IL-13 treated cultures was determined for each HCoV at each time point using paired t tests: **P ≤ 0.01; ***P ≤ 0.001; ****P ≤ 0.0001; ns, not significant.

Update of

References

    1. Kesheh M. M., Hosseini P., Soltani S., Zandi M., An overview on the seven pathogenic human coronaviruses. Rev. Med. Virol. 32, e2282 (2022). - PubMed
    1. Coleman C. M., Frieman M. B., Coronaviruses: Important emerging human pathogens. J. Virol. 88, 5209–5212 (2014). - PMC - PubMed
    1. Wang Y., Grunewald M., Perlman S., Coronaviruses: An updated overview of their replication and pathogenesis. Methods Mol. Biol. 2203, 1–29 (2020). - PMC - PubMed
    1. Li G., et al. , Coronavirus infections and immune responses. J. Med. Virol. 92, 424–432 (2020). - PMC - PubMed
    1. Chan-Yeung M.,Xu R., SARS: epidemiology. Respirology 8, S9–S14 (2003). - PMC - PubMed

Publication types