. 2023 Jun:62:102689.
doi: 10.1016/j.redox.2023.102689. Epub 2023 Apr 1.

HIV-1 Tat-mediated microglial ferroptosis involves the miR-204-ACSL4 signaling axis

Affiliations

HIV-1 Tat-mediated microglial ferroptosis involves the miR-204-ACSL4 signaling axis

Muthukumar Kannan et al. Redox Biol. 2023 Jun.

Abstract

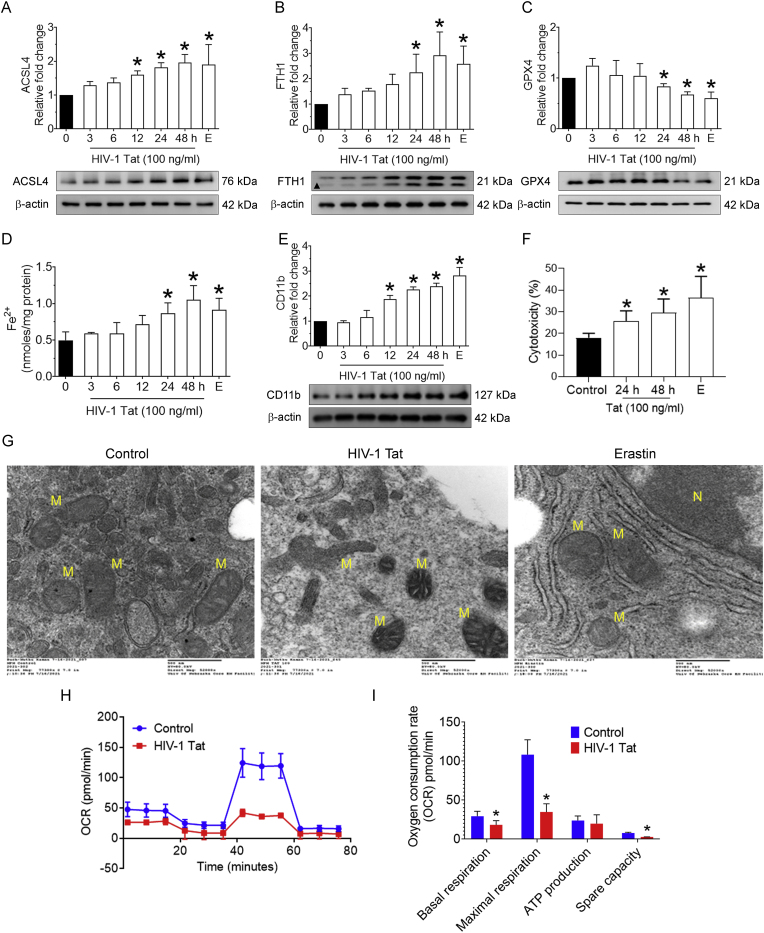
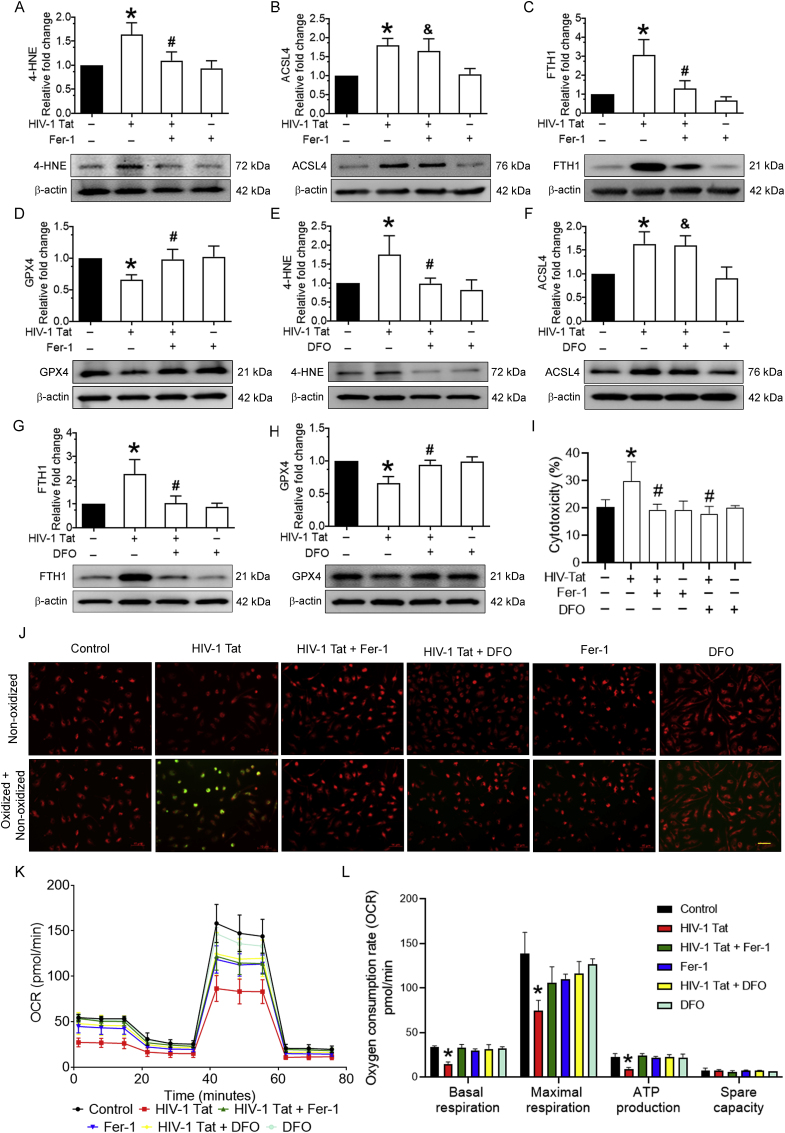
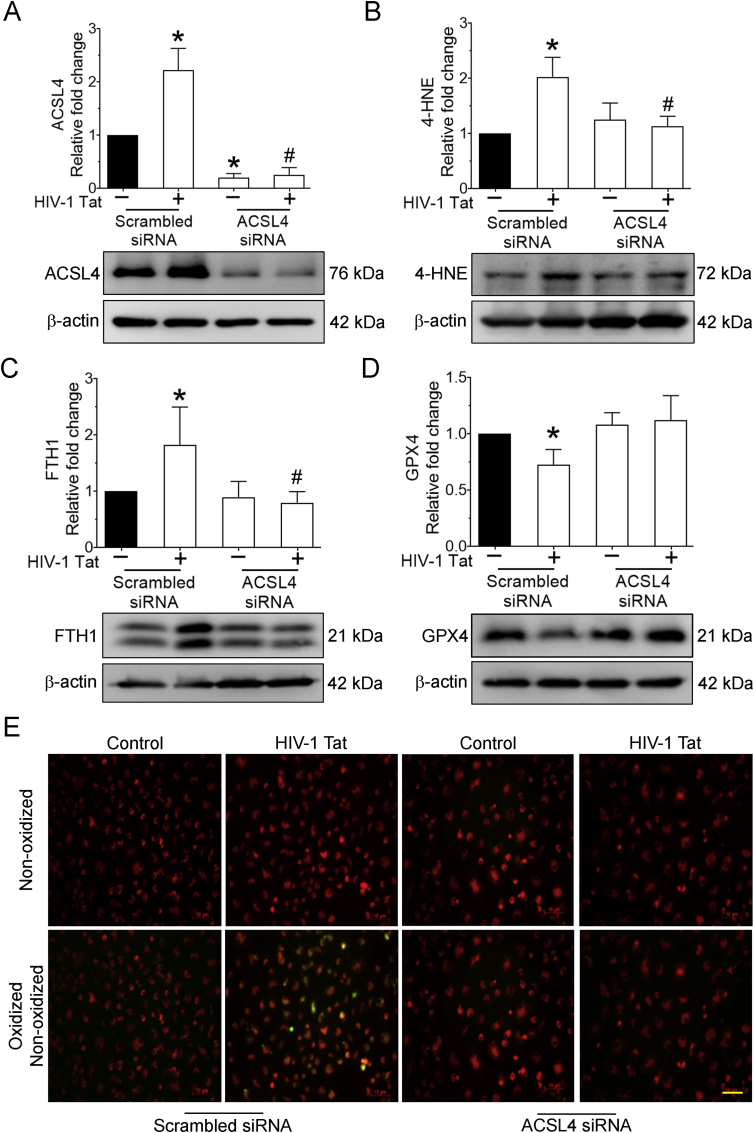
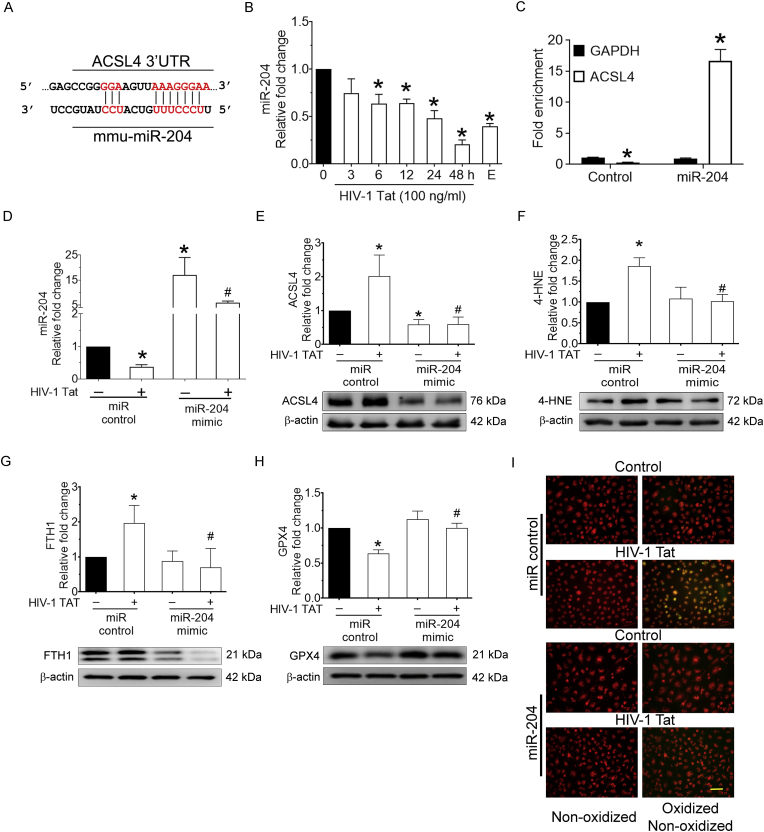
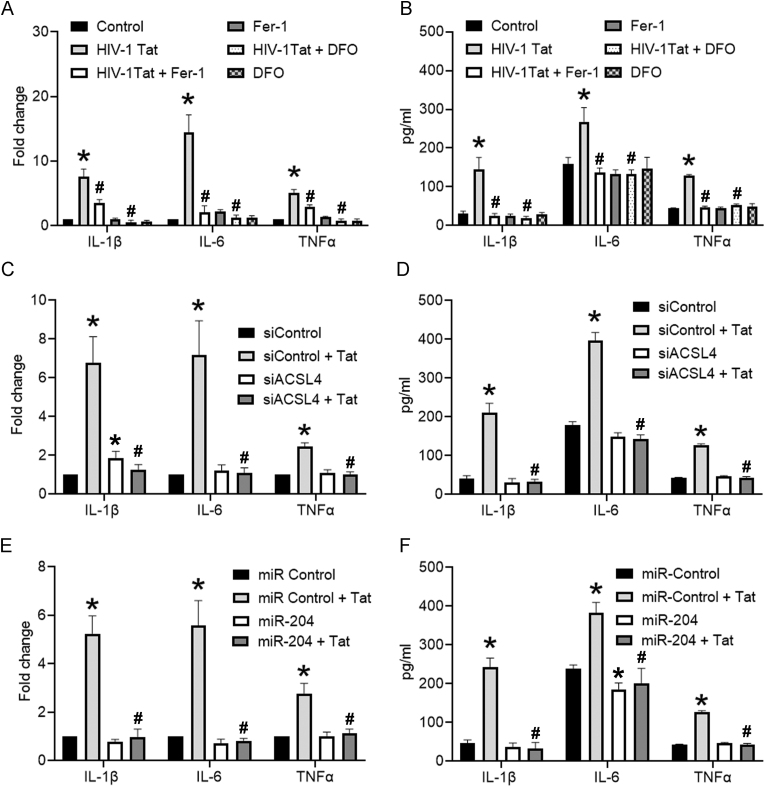
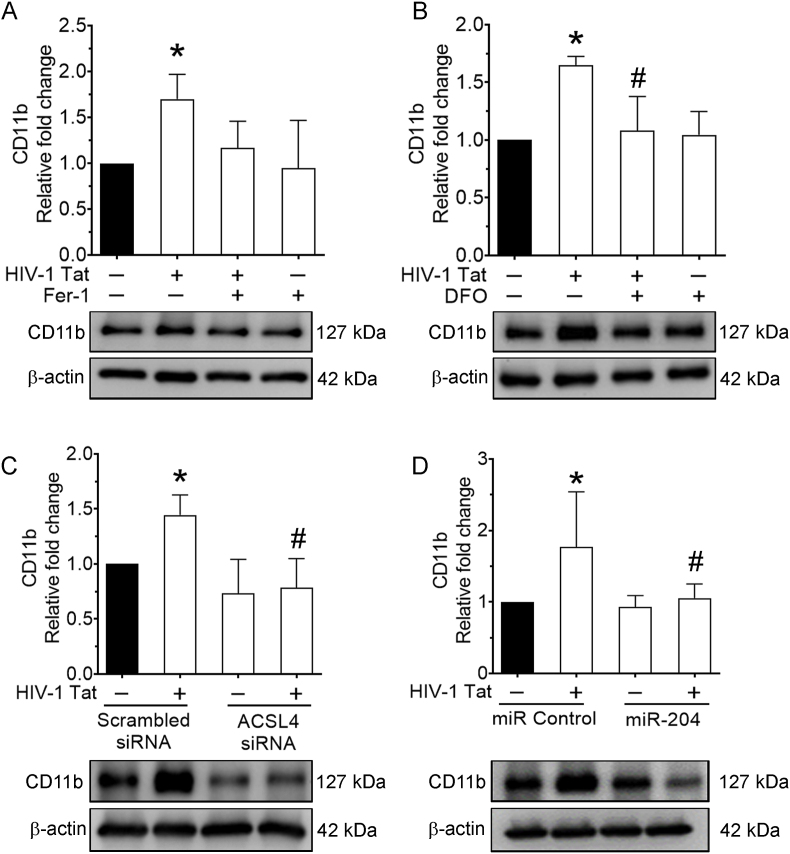
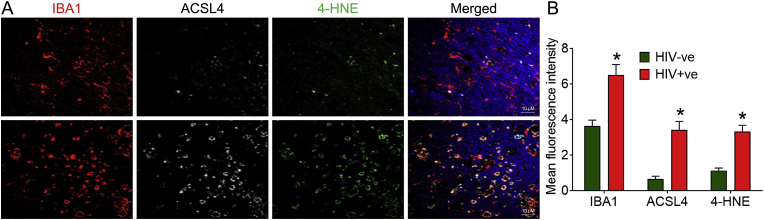
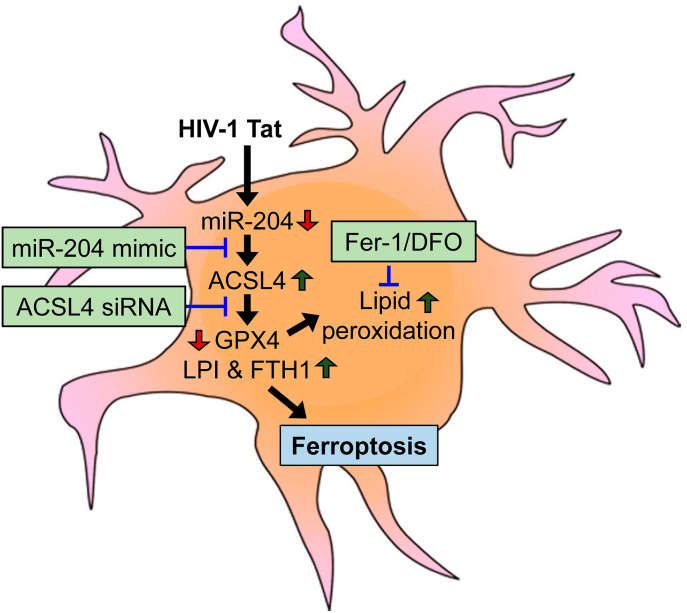
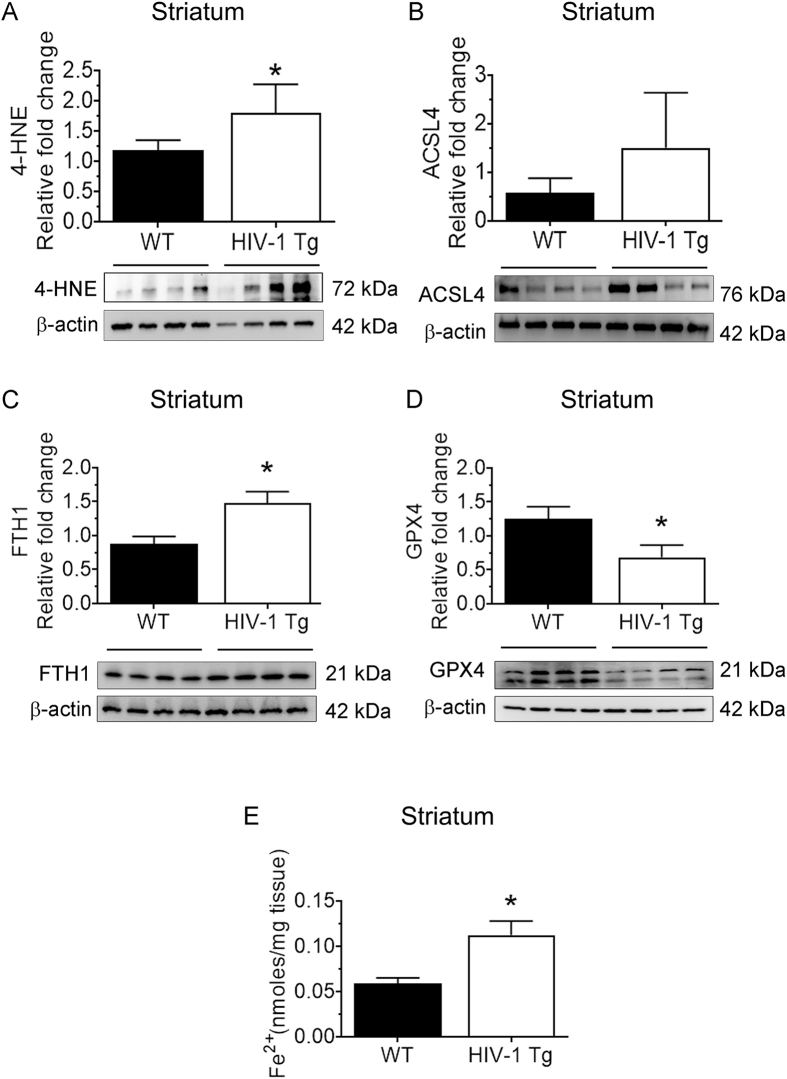
This study was focused on exploring the role of the HIV-1 Tat protein in mediating microglial ferroptosis. Exposure of mouse primary microglial cells (mPMs) to HIV-1 Tat protein resulted in induction of ferroptosis, which was characterized by increased expression of Acyl-CoA synthetase long-chain family member 4 (ACSL4), in turn, leading to increased generation of oxidized phosphatidylethanolamine, elevated levels of lipid peroxidation, upregulated labile iron pool (LIP) and ferritin heavy chain-1 (FTH1), decreased glutathione peroxidase-4 and mitochondrial outer membrane rupture. Also, inhibition of ferroptosis by ferrostatin-1 (Fer-1) or deferoxamine (DFO) treatment suppressed ferroptosis-related changes in mPMs. Similarly, the knockdown of ACSL4 by gene silencing also inhibited ferroptosis induced by HIV-1 Tat. Furthermore, increased lipid peroxidation resulted in increased release of proinflammatory cytokines, such as TNFα, IL6, and IL1β and microglial activation. Pretreatment of mPMs with Fer-1 or DFO further blocked HIV-1 Tat-mediated microglial activation in vitro and reduced the expression and release of proinflammatory cytokines. We identified miR-204 as an upstream modulator of ACSL4, which was downregulated in mPMs exposed to HIV-1 Tat. Transient transfection of mPMs with miR-204 mimics reduced the expression of ACSL4 while inhibiting HIV-1 Tat-mediated ferroptosis and the release of proinflammatory cytokines. These in vitro findings were further validated in HIV-1 transgenic rats as well as HIV + ve human brain samples. Overall, this study underscores a novel mechanism(s) underlying HIV-1 Tat-mediated ferroptosis and microglial activation involving miR-204-ACSL4 signaling.

Keywords: Ferroptosis; HIV-1 Tat; Lipid oxidation; Microglia; Neuroinflammation.


Conflict of interest statement

Declaration of competing interest The authors declare that they have no known competing financial interests or personal relationships that could have appeared to influence the work reported in this paper.

Figures

Fig. 1
Fig. 1
HIV-1 Tat-induced lipid oxidation in mPMs. Representative western blotting imaging showing the dose (A) and time (B) dependent expression of 4-HNE in HIV-1 Tat exposed mPMs. β-actin was used as an internal control for all the experiments. Bar graph showing the levels of MDA in HIV-1 Tat exposed mPMs (C). The data are presented as mean ± SD from six independent experiments. Nonparametric Kruskal–Wallis one-way ANOVA followed by Dunn's post hoc test was used to determine the statistical significance of multiple groups. *P < 0.05 versus control. Representative fluorescent microscopy images showing the oxidized lipids levels in HIV-1 Tat exposed mPMs, magnification: 20× and scale bar: 10 μm (D). Lipidomics analysis (heatmap; N = 3) showing the altered expression of major phospholipids in HIV-1 Tat exposed microglial cells (E). Bar graph showing the oxidized phosphatidylethanolamine (OxPE) normalized with μg of protein (F). An unpaired Student t-test was used to determine the statistical significance. *P < 0.05 versus control. E− Erastin (5 μM; 48 h), HT-Heat inactivated HIV-1 Tat (100 ng/ml; 48 h).
Fig. 2
Fig. 2
HIV-1 Tat-mediated induction of ferroptosis in mPMs. Representative western blotting imaging showing the time-dependent expression levels of ACSL4 (A), FTH (B), and GPX4 (C) in HIV-1 Tat (100 ng/ml) exposed mPMs. Bar graph showing the levels of LIP in HIV-1 Tat exposed mPMs in a time-dependent manner (D). Representative western blotting imaging showing the time-dependent expression of CD11b (E) in HIV-1 Tat exposed mPMs. β-actin was used as an internal control for all the experiments. Bar graph showing the levels of cytotoxicity in HIV-1 Tat exposed mPMs (F). The data are presented as mean ± SD from 6 independent experiments. Nonparametric Kruskal–Wallis one-way ANOVA followed by Dunn's post hoc test was used to determine the statistical significance of multiple groups. *P < 0.05 versus control. Representative Transmission electron microscopic images showing the altered mitochondrial ultrastructure in HIV-1 Tat exposed mPMs (G). N, nucleus; M, mitochondria. Scale bar: 500 nm. Seahorse mitostress analysis showing the OCR levels in HIV-1 Tat exposed mPMs (H). Bar graph showing individual mitochondrial function parameters calculated from the OCR data (I). The data are presented as mean ± SD from 3 independent experiments. Nonparametric Kruskal–Wallis one-way ANOVA followed by Dunn's post hoc test was used to determine the statistical significance of multiple groups. *P < 0.05 versus control; #P < 0.05 versus HIV-1 Tat. E− Erastin (5 μM; 48 h).
Fig. 3
Fig. 3
Pharmacological inhibition of ferroptosis in HIV-1 Tat-exposed mPMs. Representative western blotting imaging showing the expression levels of 4-HNE (A), ACSL4 (B), FTH (C), and GPX4 (D) in Fer-1 (10 μM; 1 h) pretreated and HIV-1 Tat (100 ng/ml) exposed mPMs. Representative western blotting imaging showing the expression levels of 4-HNE (E), ACSL4 (F), FTH (G), and GPX4 (H) in DFO (2 μM; 1 h) pretreated and HIV-1 Tat (100 ng/ml) exposed mPMs. β-actin was used as an internal control for all the experiments. The data are presented as mean ± SD from 6 independent experiments. Nonparametric Kruskal–Wallis one-way ANOVA followed by Dunn's post hoc test was used to determine the statistical significance of multiple groups. *P < 0.05 versus control; #P < 0.05 versus HIV-1 Tat; &Not significant versus HIV-1 Tat. Bar graph showing the cytotoxicity in mPMs pretreated with Fer-1 (10 μM; 1 h) or DFO (2 μM; 1 h) followed by HIV-1 Tat (100 ng/ml) for 24 h (I). Representative fluorescent microscopy images showing the oxidized lipids levels in either Fer-1 (10 μM; 1 h) or DFO (2 μM; 1 h) pretreated and HIV-1 Tat (100 ng/ml) exposed mPMs; magnification: 20× and scale bar: 10 μm (J). Seahorse mitostress analysis showing the OCR levels in either Fer-1 (10 μM; 1 h) or DFO (2 μM; 1 h) pretreated and HIV-1 Tat (100 ng/ml) exposed mPMs (K). Bar graph showing individual mitochondrial function parameters calculated from the OCR data (L). The data are presented as mean ± SD from 3 independent experiments. Nonparametric Kruskal–Wallis one-way ANOVA followed by Dunn's post hoc test was used to determine the statistical significance of multiple groups. *P < 0.05 versus control; #P < 0.05 versus HIV-1 Tat. Fer-1: Ferrostatin, DFO: Deferoxamine.
Fig. 4
Fig. 4
HIV-1 Tat-mediated induction of ferroptosis involved ACSL4 in mPMs. Representative western blotting imaging showing the expression levels of 4-HNE (A), ACSL4 (B), FTH (C), and GPX4 (D) in ACSL4 silenced mPMs exposed with HIV-1 Tat (100 ng/ml; 48 h). β-actin was used as an internal control for all the experiments. The data are presented as mean ± SD from 6 independent experiments. Nonparametric Kruskal–Wallis one-way ANOVA followed by Dunn's post hoc test was used to determine the statistical significance of multiple groups. *P < 0.05 versus control; #P < 0.05 versus HIV-1 Tat. Representative fluorescent microscopy images showing the oxidized lipids levels in ACSL4 silenced mPMs exposed with HIV-1 Tat, magnification: 20× and scale bar: 10 μm (E).
Fig. 5
Fig. 5
miR-204 targets 3′-UTR of ACSL4 in mPMs. The putative binding site of miR-204 in the 3′-UTR of mouse ACSL4 mRNA (A). The potential complementary binding residues are shown in red color. Representative qPCR analysis showing time-dependent downregulation of miR-204 expression in HIV-1 Tat (100 ng/ml; 48 h) exposed mPMs (B). U6 was used as an endogenous control. miRNA target validation assay confirmed increased enrichment of ACSL4, the miR-204 target mRNA, in miR-204 overexpressed BV2 cells. GAPDH was used as an endogenous control (C). Representative qPCR analysis showing the transfection efficiency of miR-204 in mPMs overexpressed with miR-204 mimic followed by HIV-1 Tat (100 ng/ml; 48 h) exposure (D). U6 was used as an endogenous control. Representative western blotting imaging showing the expression levels of ACSL4 (E), 4-HNE (F), FTH (G), and GPX4 (H) in mPMs overexpressed with miR-204 mimic followed by HIV-1 Tat (100 ng/ml; 48 h) exposure. β-actin was used as an internal control for all the experiments. The data are presented as mean ± SD from 6 independent experiments. Nonparametric Kruskal–Wallis one-way ANOVA followed by Dunn's post hoc test was used to determine the statistical significance of multiple groups. *P < 0.05 versus control; #P < 0.05 versus HIV-1 Tat. Representative fluorescent microscopy images showing the oxidized lipids levels in mPMs overexpressed with miR-204 mimic followed by HIV-1 Tat (100 ng/ml; 48 h) exposure, magnification: 20× and scale bar: 10 μm (I). (For interpretation of the references to color in this figure legend, the reader is referred to the Web version of this article.)
Fig. 6
Fig. 6
HIV-1 Tat-mediated ferroptosis induced proinflammatory cytokines in mPMs. qPCR (A) and ELISA (B) analysis showing the expression levels of proinflammatory cytokines such as IL1β, IL6, and TNFα in either Fer-1 (10 μM; 1 h) or DFO (2 μM; 1 h) pretreated and HIV-1 Tat (100 ng/ml) exposed mPMs. qPCR (C) and ELISA (D) analysis showing the expression levels of proinflammatory cytokines such as IL1β, IL6, and TNFα in ACSL4 silenced mPMs exposed with HIV-1 Tat (100 ng/ml; 48 h). qPCR (E) and ELISA (F) analysis showing the expression levels of proinflammatory cytokines such as IL1β, IL6, and TNFα in mPMs overexpressed with miR-204 mimic followed by HIV-1 Tat (100 ng/ml; 48 h) exposure. The data are presented as mean ± SD from 6 independent experiments. Nonparametric Kruskal–Wallis one-way ANOVA followed by Dunn's post hoc test was used to determine the statistical significance of multiple groups. *P < 0.05 versus control; #P < 0.05 versus HIV-1 Tat.
Fig. 7
Fig. 7
HIV-1 Tat-mediated ferroptosis induced cellular activation in mPMs. Representative western blotting imaging showing the expression levels of CD11b in either Fer-1 (10 μM; 1 h) or DFO (2 μM; 1 h) pretreated and HIV-1 Tat (100 ng/ml) exposed mPMs (A and B). Representative western blotting imaging showing the expression levels of CD11b in ACSL4 silenced mPMs exposed with HIV-1 Tat (C). Representative western blotting imaging showing the expression levels of CD11b in mPMs overexpressed with miR-204 mimic followed by HIV-1 Tat (D) exposure. β-actin was used as an internal control for all the experiments. The data are presented as mean ± SD from 6 independent experiments. Nonparametric Kruskal–Wallis one-way ANOVA followed by Dunn's post hoc test was used to determine the statistical significance of multiple groups. *P < 0.05 versus control; #P < 0.05 versus HIV-1 Tat.
Fig. 8
Fig. 8
Microglial ferroptosis in the brains of HIV-1 Tg rats. Representative western blotting imaging showing the ferroptosis markers such as 4-HNE (A), ACSL4 (B), FTH1 (C), LIP (D), and GPX4 (E) in the frontal cortices of wild-type and HIV-1 Tg rats (n = 4). β -actin was probed as a protein loading control for all experiments. Representative western blotting imaging showing the ferroptosis markers such as 4-HNE (F), ACSL4 (G), FTH1 (H), and GPX4 (I) in the adult microglia isolated from the cortices of wild-type and HIV-1 Tg rats (n = 4). Representative immunofluorescence staining for IBA1, microglial activation marker (green), FTH1 (red), and DAPI (blue) in the frontal cortices of wild-type and HIV-1 Tg rats, magnification: 20× and scale bar: 10 μm (J). Bar graph showing the percentage colocalization of FTH1 with IBA-1 in the frontal cortices of wild-type and HIV-1 Tg rats. β-actin was probed as a protein loading control for all experiments. An unpaired Student t-test was used to determine the statistical significance. *P < 0.05 versus control. (For interpretation of the references to color in this figure legend, the reader is referred to the Web version of this article.)
Fig. 9
Fig. 9
Increased expression of ferroptosis markers in the brains of HIV + ve individuals. Representative immunofluorescence staining for IBA1, microglial activation marker (red), ACSL4 (white), 4-HNE (green), and DAPI (blue) in the frontal cortices of HIV-ve and HIV + ve individuals, magnification: 100× and scale bar: 10 μm (A). Bar graph showing the mean fluorescence intensity of ferroptosis markers such as ASCL4 and 4-HNE in the frontal cortices of HIV-ve and HIV + ve individuals. An unpaired Student t-test was used to determine the statistical significance. *P < 0.05 versus HIV-ve. (For interpretation of the references to color in this figure legend, the reader is referred to the Web version of this article.)
Fig. 10
Fig. 10
Schematic showing the proposed mechanism involved in HIV-1 Tat-mediated microglial ferroptosis.
Fig. S1.
Fig. S1
Fig. S2.
Fig. S2

References

    1. Weichseldorfer M., Reitz M., Latinovic O.S. Past HIV-1 medications and the current status of combined antiretroviral therapy options for HIV-1 patients. Pharmaceutics. 2021;13 - PMC - PubMed
    1. Nath A., Psooy K., Martin C., Knudsen B., Magnuson D.S., Haughey N., Geiger J.D. Identification of a human immunodeficiency virus type 1 Tat epitope that is neuroexcitatory and neurotoxic. J. Virol. 1996;70:1475–1480. - PMC - PubMed
    1. Fitting S., Xu R., Bull C., Buch S.K., El-Hage N., Nath A., Knapp P.E., Hauser K.F. Interactive comorbidity between opioid drug abuse and HIV-1 Tat: chronic exposure augments spine loss and sublethal dendritic pathology in striatal neurons. Am. J. Pathol. 2010;177:1397–1410. - PMC - PubMed
    1. Hargus N.J., Thayer S.A. Human immunodeficiency virus-1 Tat protein increases the number of inhibitory synapses between hippocampal neurons in culture. J. Neurosci. 2013;33:17908–17920. - PMC - PubMed
    1. Kim H.J., Martemyanov K.A., Thayer S.A. Human immunodeficiency virus protein Tat induces synapse loss via a reversible process that is distinct from cell death. J. Neurosci. 2008;28:12604–12613. - PMC - PubMed

Publication types